HAL Id: hal-01542119
https://hal.sorbonne-universite.fr/hal-01542119
Submitted on 19 Jun 2017
HAL is a multi-disciplinary open access
archive for the deposit and dissemination of
sci-entific research documents, whether they are
pub-lished or not. The documents may come from
teaching and research institutions in France or
abroad, or from public or private research centers.
L’archive ouverte pluridisciplinaire HAL, est
destinée au dépôt et à la diffusion de documents
scientifiques de niveau recherche, publiés ou non,
émanant des établissements d’enseignement et de
recherche français ou étrangers, des laboratoires
publics ou privés.
Distributed under a Creative Commons Attribution| 4.0 International License
Medium of Galaxies? Results from Integral Field
Spectroscopy
Enrique Pérez-Montero, Carolina Kehrig, Jarle Brinchmann, José M. Vilchez,
Daniel Kunth, Florence Durret
To cite this version:
Enrique Pérez-Montero, Carolina Kehrig, Jarle Brinchmann, José M. Vilchez, Daniel Kunth, et al..
Are Wolf-Rayet Stars Able to Pollute the Interstellar Medium of Galaxies? Results from Integral
Field Spectroscopy.
Advances in Astronomy, Hindawi Publishing Corporation, 2013, pp.837392.
�10.1155/2013/837392�. �hal-01542119�
Volume 2013, Article ID 837392,15pages
http://dx.doi.org/10.1155/2013/837392
Research Article
Are Wolf-Rayet Stars Able to Pollute the Interstellar Medium of
Galaxies? Results from Integral Field Spectroscopy
Enrique Pérez-Montero,
1Carolina Kehrig,
1Jarle Brinchmann,
2José M. Vílchez,
1Daniel Kunth,
3and Florence Durret
31Instituto de Astrof´ısica de Andaluc´ıa-CSIC, Apartado. 3004, 18008 Granada, Spain
2Leiden Observatory, Leiden University, P.O. Box 9513, 2300 RA Leiden, The Netherlands
3Institut d’Astrophysique de Paris, UMR 7095 CNRS, Universit´e Pierre & Marie Curie, 98 bis boulevard Arago, 75014 Paris, France
Correspondence should be addressed to Enrique P´erez-Montero; [email protected] Received 17 May 2013; Accepted 30 August 2013
Academic Editor: Polychronis Papaderos
Copyright © 2013 Enrique P´erez-Montero et al. This is an open access article distributed under the Creative Commons Attribution License, which permits unrestricted use, distribution, and reproduction in any medium, provided the original work is properly cited.
We investigate the spatial distribution of chemical abundances in a sample of low metallicity Wolf-Rayet (WR) galaxies selected from the SDSS. We used the integral field spectroscopy technique in the optical spectral range (3700 ˚A–6850 ˚A) with PMAS attached to the CAHA 3.5 m telescope. Our statistical analysis of the spatial distributions of O/H and N/O, as derived using the direct method or strong-line parameters consistent with it, indicates that metallicity is homogeneous in five out of the six analysed objects in scales of the order of several kpc. Only in the object WR404 is a gradient of metallicity found in the direction of the low surface brightness tail. In contrast, we found an overabundance of N/O in spatial scales of the order of hundreds of pc associated with or close to the positions of the WR stars in 4 out of the 6 galaxies. We exclude possible hydrodynamical causes, such as the metal-poor gas inflow, for this local pollution by means of the analysis of the mass-metallicity relation (MZR) and mass-nitrogen-to-oxygen relation (MNOR) for the WR galaxies catalogued in the SDSS.
1. Introduction
Wolf-Rayet (WR) galaxies host very bright episodes of star formation characterized by the emission of broad WR bumps
in their optical spectrum [1]. The two main bumps in the
optical range are the blue bump, centered at a wavelength of
4650 ˚A, produced by the emission from N v, N iii, C iii/C iv,
and He ii, and associated with WC and WN stars, and the red
bump which is fainter, centered at∼5800 ˚A, produced mainly
by C iii and C iv, and associated with WC stars. The lines making up these bumps originate in the dense stellar winds from WR stars ejecting metals into the interstellar medium (ISM).
The number of known WR galaxies has tremendously increased from the discovery of the first one (He 2–10:
[2]), with different published catalogs [3–6], until the list
of WR galaxies in the Sloan Digital Sky Survey (SDSS) by
Brinchmann et al. [7] with around 570 objects with the
identi-fication of the WR bumps in their integrated spectra.
There is increasing evidence that the most challenging problems for this kind of objects appear in the low metallicity galaxies. Although it is well documented that the number of WR stars and the intensity of the WR bumps are higher
for higher metallicities [8], the values found in some low
metallicity H ii galaxies, such as IZw18 [9], are claimed to
be much higher than those predicted by synthesis population
models (e.g., [10]).
Among the other important open issues regarding WR galaxies is the chemical enrichment of the ISM surrounding the stellar clusters where the WR stars are located. It is well known that there is an overabundance of the N/O ratio found
in some WR nebulae (e.g., [11–13]) and also in the ISM of
some WR galaxies, where the WR features are diluted (e.g.,
HS0837 + 4717, [14], NGC5253, [15], other H ii galaxies in
[16,17], and green pea galaxies, [18]). Brinchmann et al. [7]
also showed that the median N/O ratio in WR galaxies with EW(H𝛽) < 100 ˚A has an excess of ∼25% in relation to the other star-forming galaxies in the SDSS. Chemical evolution
Table 1: The sample of observed Wolf-Rayet galaxies with different properties, including names, redshifts, positions, WR index, and date of observations with PMAS.
Name Redshift R.A (2000) 𝛿 (2000) WR class Other designation Observing date
WR 038 0.0158 17 h 29 m 06.55 s +56 d 53 m 19.23 s 2 SHOC 575 22-23 Jun 2009 WR 039 0.0472 17 h 35 m 01.24 s +57 d 03 m 08.55 s 2 SHOC 579 25 Jun 2009 WR 057 0.0179 00 h 32 m 18.59 s +15 d 00 m 14.16 s 3 SHOC 022 11 Oct 2009 WR 266 0.0213 15 h 38 m 22.00 s +45 d 48 m 07.02 s 2 24-25 Jun 2009 WR 404 0.0220 21 h 34 m 37.80 s +11 d 25 m 10.19 s 2 CGCG 427-004 24-25 Jun 2009 WR 505 0.0164 16 h 27 m 51.17 s +13 d 35 m 13.73 s 2 22-23 Jun 2009
models do not predict high N/O values in these
low-metallicity galaxies [19], as for12+log(O/H) < 8.2 most of the
N in the ISM has a primary origin, and therefore, its chemical abundance does not depend on the metallicity of the gas, and the expected N/O ratio for closed-box models has a constant value around log(N/O) ≈ −1.5. However, many of these inte-grated observations do not allow us to properly relate the excess in some chemical species with their WR con-tent.
To investigate the issue, among others, of the possible connection between the presence of WR stars and the chemical pollution of the surrounding ISM, we have carried out a program to study metal-poor WR galaxies by means of
integral field spectroscopy (IFS; [20–22]). Integrated
obser-vations, such as long slit or fibers, may fail to correlate the spatial location and distribution of WR features with respect to the physical conditions and the chemical abundances of the ISM as derived from the optical emission lines. Thus, a two-dimensional analysis of the ionized material in galaxies helps us to better understand the interplay between the massive stellar population and the ISM. For instance, whether WR stars are a significant contributor to abundance fluctuations
on timescales of𝑡 ∼ 107yr and to the formation of
high-ioni-zation lines (e.g., He ii 4686 ˚A) is still an unsolved issue (e.g.,
[23,24]) that can be probed more precisely when applying IFS
to nearby galaxies (see [22]).
Thus far, the results coming from WR galaxies studied IFS point to different scenarios, depending on the relative posi-tion between the local or extended N and/or He enrichment
and the location(s) of the WR stars. L´opez-S´anchez et al. [25]
claimed to find a local N overabundance associated with WR
emission in IC-10. A similar result is found by James et al. [26]
for the blue compact dwarf galaxy Haro 11. Monreal-Ibero et
al. [27] also find in NGC5253 local peaks of high N/O (see
also [28]), but only some of them are associated with WR
emission; so this could be indicative of a different timescale between the formation of the WRs and the mixing of the ejected material with the surrounding ISM. A similar
scen-ario is found by Kehrig et al. [22] in Mrk178, where only one
out of three detected WR clusters can be associated with an overabundance of N and He. Finally, in P´erez-Montero et al.
[21], the IFS study of N overabundant objects HS0837 + 4717
and Mrk930, also identified as WR galaxies, leads to high values of N/O in scales of more than 1 kpc, much beyond the power of the observed WR stars to pollute the ISM in these scales and thus pointing to other hydrodynamical processes affecting the chemistry of the gas in these galaxies, such as the
infall of metal-poor gas [29]. James et al. [30] also propose a
similar scenario for their results of IFS observations of the merging galaxy UM448.
In this work, we extend the sample of low-metallicity WR galaxies studied by means of IFS by six objects selected from
the WR galaxy catalog by Brinchmann et al. [7]. The paper is
organized as follows. InSection 2, we describe the observed
WR galaxies, and we report the IFS observations and data
reduction. In Section 3, we present our results, including
emission-line maps and derivation of oxygen and nitrogen chemical abundances and their distributions in the observed fields of view. We also describe the measurement of the WR
bumps in the observed galaxies. InSection 4, we discuss our
results about the chemical pollution of the ISM in the context of WR stars the surrounding ISM. Finally, we summarize our
results and present our conclusions inSection 5.
2. Data Acquisition and Reduction
2.1. Object Selection and Observations. We obtained IFS data
of a sample of six objects selected from the SDSS WR galaxy
catalog by Brinchmann et al. [7] following three criteria:
(i) galaxies should be associated with a WR index of 2 (convincing WR features in the SDSS spectrum) or 3 (very clear features) in the catalog, (ii) the main ionization source should be dominated by star formation as derived using
diagnostic diagrams based on strong emission lines [31], and
(iii) galaxies should have oxygen abundances lower than half
the solar value[12 + log(O/H) ≈ 8.4] as derived from the
direct method. These criteria were completed with two other observational conditions: (i) to have sizes smaller than the
field of view (FoV) of PMAS in lens array mode16 × 16
in order to cover the entire galaxy in one single pointing, (ii) all objects were visible from the CAHA observatory in the assigned dates at an air mass lower than 1.2. The six target WR
galaxies are listed inTable 1. Column (1) quotes the names of
the objects from the catalog of Brinchmann et al. [7]. Column
(2) shows the redshift of each galaxy. Columns (3) and (4) give the object coordinates. Column (5) gives the WR index as
done by Brinchmann et al. [7], column (6) gives other names,
and finally column (7) shows the observing date.
The data were acquired with the Integral Field Unit (IFU) Potsdam Multi-Aperture Spectrophotometer (PMAS),
devel-oped at the Astrophysikalisches Institut Potsdam [32]. PMAS
is attached to the 3.5 m Telescope at the CAHA Observa-tory (Spain). The PMAS spectrograph is equipped with 256
sampling of1×1on the sky resulting in a FoV of16×16 collecting square areas known as spaxels.
We were awarded a service mode run on the nights of June 22–25, 2009 (program F09-3.5-27). In addition, we continued our program with additional time on October 11th, 2009 as part of the commissing run for the new PMAS CCD.
During observations taken in June, 2009 with the old
PMAS 2K × 2K CCD, we used the V600 grating in two
separate spectral ranges: the blue side, covering a spectral
range∼3700–5200 ˚A (centered at 4500 ˚A), and the red one
(centered at 6325 ˚A), providing a spectral range from∼5350
to 6850 ˚A. For the galaxy WR057, taken with the new 4K×
4K PMAS CCD but with the same resolution, we were able to cover the whole optical spectral range (∼3700–6850 ˚A) in one shot using the same V600 grating. The data were binned by a factor of 2 in the spectral direction, yielding a
spec-tral resolution of ∼1.6 ˚A/pixel. The data were acquired
under nonphotometric conditions and with a seeing varying
between1and1.5. To avoid major differential atmospheric
refraction (DAR) effects, all expositions were taken at air
mass<1.2. We used one single pointing for each galaxy,
cover-ing in all cases the most intense burst of star formation and its surroundings. Observations of the spectrophotometric
standard stars BD+ 253941 and PG1633 in the first run and
BD+ 284211 for the calibration of WR057 in the second
one were obtained during the observing nights for flux calibration. Bias frames, arc exposures (HgNe), and spectra of a continuum lamp were taken following the science exposures as part of the PMAS baseline calibrations.
2.2. Data Reduction. For all objects observed with the PMAS
2K× 2K CCD, the first steps of the data reduction were done
through the R3D package [33]. We used the P3d tool [34]
to perform the basic data reduction of WR057, taken with
the new PMAS 2K× 4K CCD. This CCD is read out in four
quadrants which have slightly different gains [35]. At the time
we observed WR057, P3d was the only software capable to handle the characteristics of the new CCD.
After trimming, combining the four quadrants for WR057 and bias subtraction, the expected locations of the spectra were traced on a continuum-lamp exposure obtained before each target exposure. We extracted the target spectra by adding the signal from the 5 pixels around the central traced pixel (that is, the total object spectrum width). With exposures of HgNe arc lamps obtained immediately after the science exposures, the spectra were wavelength calib-rated.
Fibers have different transmissions that may depend on the wavelength. The continuum-lamp exposures were used to determine the differences in the transmission fiber-to-fiber and to obtain a normalized fiber-flat image, including the wavelength dependence. This step was carried out by running the fiber-flat.pl script from the R3D package. In order to homogenize the response of all the fibers, we divided our wavelength calibrated science images by the normalized fiber
flat [33]. Then, to remove cosmic rays, different exposures
taken at the same pointing were combined using the imcom-bine routine in IRAF (IRAF is distributed by the National Optical Astronomical Observatories, which are operated by
the Association of Universities for Research in Astronomy, Inc., under cooperative agreement with the National Science Foundation). Flux calibration was performed using the IRAF tasks standard, sensfunc, and calibrate. We coadded the spectra of the central fibers of the standard star to create a one-dimensional spectrum that was used to obtain the sensitivity function.
The reduced spectra were contained in a data cube for each object.
3. Results
3.1. Line Measurements. The emission-line fluxes on the
extracted one-dimensional spectra were measured for each spaxel using a Gaussian fitting over the local position of the continuum. This procedure was done using an automatic routine based on the IRAF task splot. In the case of those
lines with a lower signal-to-noise (S/N) (e.g., [O iii] 4363 ˚A
and [N ii] 6584 ˚A), the results from this routine were revised
by eye inspection and, if necessary, repeated using a manual measurement.
The adjacent continuum to each line can be affected by the underlying stellar population which can depress the intensity of the Balmer emission lines with stellar absorption wings
(e.g., [36]). This stellar absorption was studied for the
bright-est spaxels by fitting a combination of synthesis spectra of single stellar populations (SSP) libraries by Bruzual and
Char-lot [37] and the code STARLIGHT (the STARLIGHT project
is supported by the Brazilian agencies CNPq, CAPES, and FAPESP and by the France-Brazil CAPES/Cofecub program)
[38, 39]. The fitted spectra were later subtracted from the
observed ones and the emission-line intensities of the resid-uals were compared with the corresponding noncorrected values. For those objects of our sample with very high H𝛽
equivalent widths (more than 200 ˚A for WR039 and around
100 ˚A for WR038, WR057, WR404, and WR505), the
correc-tion at H𝛽 wavelength is negligible (less than 1 ˚A). Only in the case of WR266, with EW(H𝛽) of 54 ˚A, we found a correction
around 4 ˚A for EW(H𝛽). For this object, appropriate
correc-tions for each Balmer line were taken into account according to the SSP fitting in the brightest spaxels.
We calculated the statistical errors of the line fluxes,𝜎𝑙,
using the expression𝜎𝑙= 𝜎𝑐𝑁1/2[1 + EW/𝑁Δ]1/2(as in [40]),
where 𝜎𝑐 represents a standard deviation of the noise in a
range centred close to the measured emission line,𝑁 is the
number of pixels used in the measurement of the line flux,
EW is the equivalent width of the line, andΔ is the wavelength
dispersion in ˚A/pixel. This expression takes into account the
error in the continuum and the photon count statistics of the emission line. The error measurements were performed on the extracted one-dimensional spectra. In order to minimize errors in the ratios between a certain emission line and H𝛽, we always took first its ratio in relation to the closest hydrogen emission line (i.e., H𝛼 in the case of [N ii]), and then, we renormalized using the corresponding theoretical ratio (i.e., at the electron temperature derived in the integrated SDSS
observations for each object) from Storey and Hummer [41].
We checked that the variation of this temperature across the FoV of the instrument does not introduce errors in the
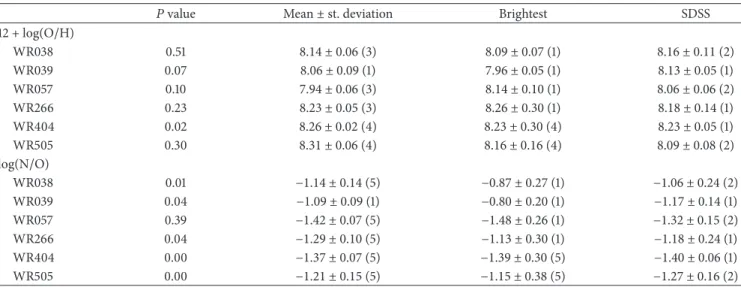
Table 2: Total oxygen abundances and N/O derived for the six studied WR galaxies using different methods as described in the text. The confidence level from the Lilliefors test for those spaxels where all involved emission lines were measured is the𝑃 value. Column (3) lists the mean value and standard deviation (sigma) from the Gaussian fit as long as𝑃 value >0.05; otherwise, the mean value and sigma of the data distribution are shown. Column (4) and (5) show the O/H, N/O, and their corresponding errors derived from the brightest spaxel and from the SDSS spectrum for each galaxy, respectively. The number in parenthesis indicates the method used to derive the chemical abundances: (1) from direct method with [O II] 3727 ˚A, (2) from direct method with [O II] 7319, 7330 ˚A, (3) from N2, (4) from O3N2, and (5) from N2O2.
𝑃 value Mean± st. deviation Brightest SDSS
12 + log(O/H) WR038 0.51 8.14 ± 0.06 (3) 8.09 ± 0.07 (1) 8.16 ± 0.11 (2) WR039 0.07 8.06 ± 0.09 (1) 7.96 ± 0.05 (1) 8.13 ± 0.05 (1) WR057 0.10 7.94 ± 0.06 (3) 8.14 ± 0.10 (1) 8.06 ± 0.06 (2) WR266 0.23 8.23 ± 0.05 (3) 8.26 ± 0.30 (1) 8.18 ± 0.14 (1) WR404 0.02 8.26 ± 0.02 (4) 8.23 ± 0.30 (4) 8.23 ± 0.05 (1) WR505 0.30 8.31 ± 0.06 (4) 8.16 ± 0.16 (4) 8.09 ± 0.08 (2) log(N/O) WR038 0.01 −1.14 ± 0.14 (5) −0.87 ± 0.27 (1) −1.06 ± 0.24 (2) WR039 0.04 −1.09 ± 0.09 (1) −0.80 ± 0.20 (1) −1.17 ± 0.14 (1) WR057 0.39 −1.42 ± 0.07 (5) −1.48 ± 0.26 (1) −1.32 ± 0.15 (2) WR266 0.04 −1.29 ± 0.10 (5) −1.13 ± 0.30 (1) −1.18 ± 0.24 (1) WR404 0.00 −1.37 ± 0.07 (5) −1.39 ± 0.30 (5) −1.40 ± 0.06 (1) WR505 0.00 −1.21 ± 0.15 (5) −1.15 ± 0.38 (5) −1.27 ± 0.16 (2)
theoretical ratio larger than those associated with the flux of the emission lines.
3.2. Extinction Correction and𝐻𝛼 Maps. For each fiber
spec-trum, we derived its corresponding reddening coefficient, c(H𝛽), using a weighted fit to the values of the Balmer decrement derived from H𝛼/H𝛽 and H𝛾/H𝛽 as compared to the theoretical values expected for recombination case B
from Storey and Hummer [41] at the electron density and
temperature obtained from the integrated SDSS DR-7 spectra
and applying the extinction law given by Cardelli et al. [42]
with𝑅𝑉 = 3.1. In all cases, homogeneous low values of the
reddening constant were derived in agreement with the same values derived from the analysis of the corresponding SDSS one-dimensional spectra.
The fluxes of the emission lines for each spaxel were corrected for extinction using its corresponding c(H𝛽) value. H𝛼 emission line maps (continuum subtracted and extinction
corrected) are shown inFigure 1. As can be seen, the observed
FoV encompasses the whole optical extent of our galaxies, which are mostly very compact, with the exception of WR404, which presents a cometary aspect with a low bright-ness tail towards the NE direction, and WR505, which pre-sents several knots of star formation other than the brightest one at west of the FoV.
3.3. Oxygen and Nitrogen Chemical Abundances. The
chem-ical abundances of oxygen and nitrogen were studied in a representative sample of the observed spaxels in the six WR galaxies using different methods as explained below.
The most accurate method to derive oxygen abundances in emission-line objects, as those in our sample, is the so-called direct method which depends on the relative intensity
of both nebular oxygen emission lines to a hydrogen
recom-bination emission line, such as H𝛽 (i.e., [O ii]/H𝛽 for O+/H+
and [O iii]/H𝛽 for O2+/H+), and the previous
determina-tion of the electron temperature, via the quotient between
auroral-to-nebular emission lines, such as [O iii] 4363 ˚A and
[O iii] 5007 ˚A. See, for instance, P´erez-Montero et al. [21]
or Kehrig et al. [22] for additional details of this procedure
and how to calculate the low-excitation electron temperature to derive low-excitation ionic abundances. This method was applied to the SDSS DR7 spectra of the brightest regions of the six observed galaxies leading to values of the total oxygen abundances compatible with the low metallicity regime. Owing to the spectral coverage in the SDSS spectra (3800–
9100 ˚A), the [O ii] 3727 ˚A emission line was not detected in
WR038, WR057, and WR505, and the [O ii] 7319, 7330 ˚A were
used instead, as described in Kniazev et al. [43]. The total
abundances derived in the SDSS spectra using this method
are listed inTable 2.
Regarding the PMAS IFS observations, the direct method was applied in a representative number of spaxels only in
WR039, where the [O iii] 4363 ˚A emission line was detected
with acceptable S/N (>2.5). In the other galaxies of our sample, the direct method could only be applied in the brightest spaxels in WR038, WR057, and WR505 and in none of them in WR266 and WR404.
Therefore, the spatial analysis of the chemical properties in these galaxies was done by means of strong-line methods.
We first resorted to the N2 parameter (e.g., [44]), defined as
the ratio between [N ii] 6584 ˚A and H𝛼. This parameter has
the advantage that it does not depend on reddening nor flux calibration uncertainties and is linearly well correlated with oxygen abundance up to solar metallicities. On the contrary, it has an important drawback when it is used for extended
WR038-H𝛼 flux +8 +6 +4 +2 0 −2 −4 −6 −8 +8 +6 +4 +2 0 −2 −4 −6 −8 330 pc 6E−15 5E−15 4E−15 3E−15 2E−15 1E−15 0 Δ𝛿 ( ) Δ𝛼() +8 +6 +4 +2 0 −2 −4 −6 −8 +8 +6 +4 +2 0 −2 −4 −6 −8 WR039-H𝛼 flux 950 pc 1.4E−12 1.2E−12 1E−12 6E−13 4E−13 2E−13 0 8E−13 Δ𝛿 ( ) Δ𝛼() WR057-H𝛼 flux 360 pc 19E−14E−15 8E−15 6E−15 7E−15 5E−15 4E−15 3E−15 2E−15 1E−15 0 +8 +6 +4 +2 0 −2 −4 −6 −8 +8 +6 +4 +2 0 −2 −4 −6 −8 Δ𝛿 ( ) Δ𝛼() WR266-H𝛼 flux 3E−15 2.5E−15 2E−15 1.5E−15 1E−15 5E−16 0 +8 +6 +4 +2 0 −2 −4 −6 −8 +8 +6 +4 +2 0 −2 −4 −6 −8 450 pc Δ𝛿 ( ) Δ𝛼() WR404-H𝛼 flux 440 pc 8E−15 7E−15 6E−15 5E−15 4E−15 3E−15 2E−15 1E−15 0 +8 +6 +4 +2 −2 −4 −6 −8 +8 +6 +4 +2 0 −2 −4 −6 −8 0 Δ𝛿 ( ) Δ𝛼() +8 +6 +4 +2 0 −2 −4 −6 −8 +8 +6 +4 +2 0 −2 −4 −6 −8 WR505-H𝛼 flux 230 pc 7E−15 6E−15 5E−15 4E−15 3E−15 2E−15 1E−15 0 Δ𝛿 ( ) Δ𝛼()
Figure 1: Extinction corrected H𝛼 maps of the six observed WR galaxies. In all images, each spaxel has 1of resolution. North is up, and
east is to the left. Fluxes are in units of erg/s/cm2. The relative size in parsecs, at the adopted distance of each object, is indicated. For WR038, the spaxels where the WR bump was detected from our PMAS data are marked with red crosses.
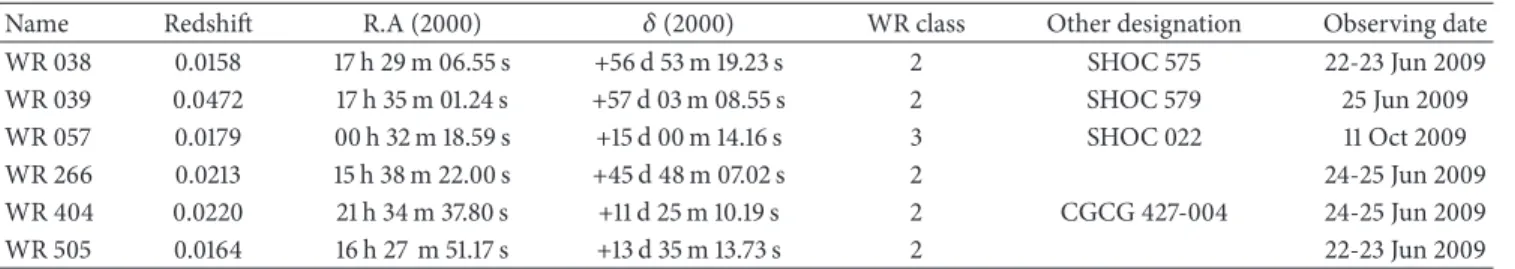
objects, as those studied in this work by means of IFS, as it
also varies as a function of the excitation conditions [45]. We
verified in what objects this method could be applied to derive reliably the spatial distribution of the oxygen abundance, by
plotting inFigure 2the relation between the N2 parameter
and the [O ii]/[O iii] ratio, which traces the nebular excitation. As can be seen, in the most extended objects of our sample, WR404 and WR505, there is a clear correlation between these two emission-line ratios. In the other objects, there is no clear relation between them, with the possible exception of WR057, but in this object, the spatial variation of N2 is lower than the observational errors. Hence, in the case of WR404 and WR505 galaxies, we used the strong-line parameter O3N2, firstly introduced as a metallicity calibrator
by Alloin et al. [46] and which is defined as the emission-line
ratio between [O iii] 5007 ˚A and [N ii] 6584 ˚A. According
to several authors, such as Pettini and Pagel [47] or
P´erez-Montero and Contini [48], this parameter is not valid for very
low metallicity objects (12+log(O/H) < 8.0), but, on the con-trary, its dependence on excitation is much lower than in the case of N2. According to the values derived from the SDSS spectra for WR404 and WR505, their mean oxygen abundances are higher than the lower limit for O3N2, so this parameter was used for these two objects instead.
For the sake of consistency between the three employed methods (direct method in the case of WR039, N2 parameter for WR038, WR057, and WR266, and O3N2 for WR404 and WR505), we used the calibrations presented in
P´erez-Montero and Contini [48] for N2 and O3N2, which are
con-sistent with the direct method. The resulting oxygen
abun-dance maps of the six observed galaxies are plotted inFigure 3
along with the histogram distributions of the abundances in those spaxels with enough S/N in all the involved emission lines (S/N > 2.5).
In the case of the nitrogen-to-oxygen ratio (N/O), the
direct method can also be used to derive the N+/H+ratio and
then deriving N/O using the approximation N+/O+ ≈ N/O
[as before, see further details in [21, 22]], but this method
could only be used in a representative number of spaxels in WR039. For the other five galaxies, we resorted to the
N2O2 parameter, defined as the ratio of [N ii] 6584 ˚A and
[O ii] 3727 ˚A. This ratio has the advantage that it has a
mono-tonic linear relation with N/O and, contrary to N2, it does not have any dependence on excitation as it only depends on low-excitation emission lines. As in the case of oxygen abund-ances, we used the empirical calibration of N2O2 with N/O
from P´erez-Montero and Contini [48], which is consistent
with the direct method derivations of this chemical abun-dance ratio. The resulting N/O maps of the six observed
galaxies are plotted inFigure 4along with the histogram
dis-tributions of the abundances in those spaxels with enough S/N in all the involved emission lines.
3.4. Spatial Chemical Homogeneity. To study to what extent
the chemical content of the gas can be considered as homo-geneous and to give the statistical significance of the O/H and N/O distributions, we used the procedure presented
in P´erez-Montero et al. [21] and refined in Kehrig et al.
[22]. This method is based on the assumption that a certain
property can be considered as spatially homogeneous across the observed FoV if two conditions are satisfied: for the cor-responding dataset (i) the null hypothesis (i.e., the data come from a normally distributed population) of the Lilliefors test
[49] cannot be rejected at the 5% significance level and (ii)
the observed variations of the data distribution around the single mean value can be explained by random errors; that is, the corresponding Gaussian sigma should be lower or of the order of the typical uncertainty of the considered property; we take as typical uncertainty the square root of the weighted
sample variance. InTable 2, we show the results from our
statistical analysis for both total O/H and N/O.
The Lilliefors test for each of the distributions was performed on the linear values of the chemical abundances. The corresponding confidence levels (𝑃 values) are listed in
Table 2with the resulting means and Gaussian sigma in case
that the𝑃 value is higher than 0.05. Otherwise, the means
and standard deviations are those of the distributions. In
those cases where the𝑃 value is larger than 0.05, the second
condition imposed to consider a homogeneous distribution is also satisfied in all cases. In all distributions where a strong-line method was used to derive both O/H and N/O, the sigma of the Gaussian is much lower than the intrinsic uncertainty associated with these methods (∼0.3 dex). For WR039, where the direct method was used, the weighted sigma for both oxygen abundance and N/O is 0.2 dex, which also is larger than the usual sigmas in the Gaussian fittings.
4. Discussion: Are WR Stars Able to
Pollute the ISM of Galaxies?
The use of IFS is fundamental to study the spatial extent of the chemical properties of the ISM in extended objects. In this context, this technique along with the use of appropriate statistical tools allows us to explore the presence of chemical inhomogeneities in both O/H and N/O and to relate this local pollution with the position of WR stars, whose stellar winds enrich the surrounding ISM with the products of the main sequence nuclear burning of massive stars.
Our statistical method points to a high degree of homo-geneity in O/H across the FoV of the studied galaxies, imply-ing scales of several kpc, with the only exception of WR404, where a possible gradient of metallicity is found. This spatial variation of the metallicity goes from lower values in the brightest region of the galaxy at the SE to slightly higher values in the low surface brightness tail towards the NW.
Our spatial analysis of N/O reveals that only WR057 presents values for which the homogeneity of this abundance ratio cannot be ruled out. In contrast, for all the other cases, the conditions assumed to consider a homogeneous distribu-tion of N/O are not fulfilled, as very high values of this ratio in certain positions of the FoV were measured.
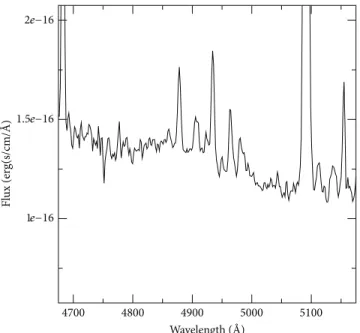
Although the WR blue bump is detectable in the SDSS spectra of the six selected galaxies, we only found it in our PMAS observations in two spaxels of the WR039 galaxy.
These are marked with red crosses inFigure 1. A thorough
analysis of the causes of the missing detection of the bump in the other objects will be performed in a forthcoming
0 0.2 0.4 0.6 0.8 1 WR038 −2 −1.9 −1.8 −1.7 −1.6 −1.5 −1.4 −1.3 −1.2 −1.1 −1 −0.9 −0.8 −0.7 −0.6 −0.5 −1 −0.8 −0.6 −0.4 −0.2
log([O ii]/[O iii])
log([N ii ]/H 𝛼 ) WR039 0 0.2 0.4 0.6 0.8 1 −2 −1.9 −1.8 −1.7 −1.6 −1.5 −1.4 −1.3 −1.2 −1.1 −1 −0.9 −0.8 −0.7 −0.6 −0.5 −1 −0.8 −0.6 −0.4 −0.2
log([O ii]/[O iii])
log([N ii ]/H 𝛼 ) WR057 0 0.2 0.4 0.6 0.8 1 −2 −1.9 −1.8 −1.7 −1.6 −1.5 −1.4 −1.3 −1.2 −1.1 −1 −0.9 −0.8 −0.7 −0.6 −0.5 −1 −0.8 −0.6 −0.4 −0.2
log([O ii]/[O iii])
log([N ii ]/H 𝛼 ) WR266 0 0.2 0.4 0.6 0.8 1 −2 −1.9 −1.8 −1.7 −1.6 −1.5 −1.4 −1.3 −1.2 −1.1 −1 −0.9 −0.8 −0.7 −0.6 −0.5 −1 −0.8 −0.6 −0.4 −0.2
log([O ii]/[O iii])
log([N ii ]/H 𝛼 ) WR404 0 0.2 0.4 0.6 0.8 1 log([O ii]/[O iii])
−2 −1.9 −1.8 −1.7 −1.6 −1.5 −1.4 −1.3 −1.2 −1.1 −1 −0.9 −0.8 −0.7 −0.6 −0.5 log([N ii ]/H 𝛼 ) −1 −0.8 −0.6 −0.4 −0.2 WR505 0 0.2 0.4 0.6 0.8 1 log([O ii]/[O iii])
−2 −1.9 −1.8 −1.7 −1.6 −1.5 −1.4 −1.3 −1.2 −1.1 −1 −0.9 −0.8 −0.7 −0.6 −0.5 log([N ii ]/H 𝛼 ) −1 −0.8 −0.6 −0.4 −0.2
Figure 2: Relation between the [O ii]/[O iii] and [N ii]/H𝛼 emission line ratios for those spaxels with sufficient S/N in the four involved lines of the six observed galaxies.
8.3 8.2 8.1 8 7.9 +8 +6 +4 +2 0 −2 −4 −6 −8 +8 +6 +4 +2 0 −2 −4 −6 −8 WR038-12+ log(O/H) Δ𝛿 ( ) 0.5 1.0 1.5 2.0 2.5 0 2 4 6 8 10 12 N u m b er o f spax els WR038
Gaussian mean 12+ log(O/H) = 8.14
Gaussian sigma= 0.06 WR039-12+ log(O/H) 8.3 8.2 8.1 8 7.9 +8 +6 +4 +2 0 −2 −4 −6 −8 +8 +6 +4 +2 0 −2 −4 −6 −8 Δ𝛿 ( ) 0.5 1.0 1.5 2.0 2.5 0 2 4 6 8 10 12 N u m b er o f spax els WR039
Gaussian mean 12+ log(O/H) = 8.06
Gaussian sigma= 0.09 8.3 8.2 8.1 8 7.8 7.9 7.7 +8 +6 +4 +2 0 −2 −4 −6 −8 +8 +6 +4 +2 0 −2 −4 −6 −8 WR057-12+ log(O/H) Δ𝛿 ( ) 0.5 1.0 1.5 2.0 2.5 2 0 4 6 8 10 12 14 N u m b er o f s p ax els WR057
Gaussian mean 12+ log(O/H) = 7.94
Gaussian sigma= 0.06 WR226-12+ log(O/H) 8.3 8.4 8.2 8.1 8 +8 +6 +4 +2 0 −2 −4 −6 −8 +8 +6 +4 +2 0 −2 −4 −6 −8 8.5 Δ𝛿 ( ) Δ𝛼() 0.5 1.0 1.5 2.0 2.5 0 2 4 6 8 10 12 14 N u m b er o f s p ax els WR266
Gaussian mean 12+ log(O/H) = 8.26
Gaussian sigma= 0.02
N(O)/N(H) (×10−4)
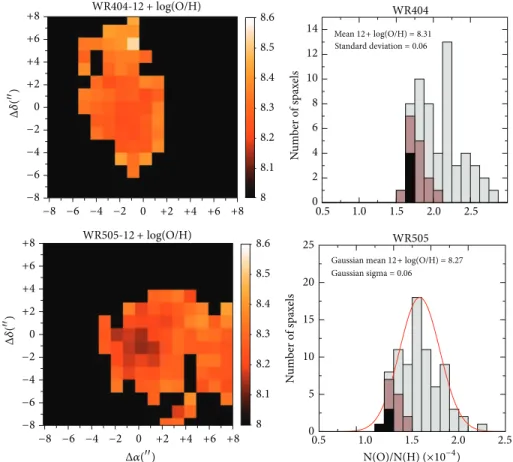
8.3 8.5 8.6 8.4 8.2 8.1 8 +8 +6 +4 +2 0 −2 −4 −6 −8 +8 +6 +4 +2 0 −2 −4 −6 −8 WR404-12+ log(O/H) Δ𝛿 ( ) 0.5 1.0 1.5 2.0 2.5 0 2 4 6 8 10 12 14 N u m b er o f s p ax els WR404 Mean 12+ log(O/H) = 8.31 Standard deviation= 0.06 8.3 8.4 8.5 8.6 8.2 8.1 8 +8 +6 +4 +2 0 −2 −4 −6 −8 +8 +6 +4 +2 0 −2 −4 −6 −8 WR505-12+ log(O/H) Δ𝛿 ( ) Δ𝛼() 0.5 1.0 1.5 2.0 2.5 0 5 10 15 20 25 N u m b er o f spax els WR505 N(O)/N(H) (×10−4)
Gaussian mean 12+ log(O/H) = 8.27
Gaussian sigma= 0.06
Figure 3: Oxygen abundance maps derived as described in the text and histogram distributions in linear scale for WR038, WR039, and WR057. In all images, each spaxel has1resolution, north is up and east is left. The bars in the histogram represent spaxels with detected WR emission (red), spaxels in the same positions as the SDSS pointing (black), spaxels adjacent to this position (brown), and the other spaxels (grey). Same figure for WR266, WR404, and WR505.
by coadding the emission from the 2 spaxels with the WR bump detection. The measured luminosity of the bump at the adopted distance, once the emission lines over the bump
were removed, [LWR = 1040.08 ± 0.08erg/s], is consistent with
the value measured in the integrated SDSS spectrum [LWR=
1039.97 ± 0.15erg/s]. In contrast, the equivalent width of the
bump in these two spaxels (20 ± 4 ˚A) is much higher than in the SDSS spectrum (8 ± 4 ˚A), as expected, taking into account the fact that the collected stellar continuum in the
area of the two1PMAS spaxels is fainter than in the3SDSS
fiber.
To investigate the possible connection between the detected nitrogen overabundance and the location of the WR
stars, we identified in the histograms shown in Figures3and4
the probable positions of the WR stars. In the case of WR039, where the WR bump was detected in our IFS data, the corre-sponding spaxels with WR emission are plotted as red bars. In the rest of the objects, we selected the four spaxels probably encompassed by the SDSS fiber and which are thought to host the WR population, and we plotted them in the histograms as black bars. This subset of spaxels always includes the brightest H𝛼 position in the observed galaxies. Finally, to study the possible extent of the N pollution, we also identified the 12 spaxels around these 4 positions of the SDSS fiber as brown bars in the histograms. As can be seen in the histograms
and can also be confirmed by visual inspection of the N/O maps, the nitrogen overabundance is tightly related to the position of the WRs in WR038, WR039, WR266, and WR505, although there is not a perfect match between them. This is well illustrated in the unique case where we identified the WR emission, WR039, where the N overabundance is slightly displaced in relation to the position of the WR bumps. The other galaxy whose N/O is not homogeneous is WR404, but in this case, this is probably related to the gradient of metal-licity across its tail detected in the O/H analysis, as no direct relation between the N overabundance and the positions of the WRs is detected.
The results obtained in this work, in which we find evidence for a local nitrogen overabundance (in zones of the order of 100 pc around the position of the WR bumps) in four out of the six observed galaxies by means of IFS have the following implications
(i) WR stars are possibly the main cause of the overabundance of nitrogen observed in 4 out of 6 observed galaxies at spatial scales of the order of several hundreds of parsecs detected around the position of these stars, differing from the objects
studied in P´erez-Montero et al. [21], where this
WR038-log(N/O) +8 +6 +4 +2 0 −2 −4 −6 −8 +8 +6 +4 +2 0 −2 −4 −6 −8 −1 −0.9 −0.8 −0.7 −1.1 −1.2 −1.3 −1.4 −1.5 Δ𝛿 ( ) Mean log(N/O)= −1.14 0 0.05 0.1 0.15 0.2 0 5 10 N u m b er o f spax els WR038 Standard deviation= 0.14 WR039-log(N/O) +8 +6 +4 +2 0 −2 −4 −6 −8 +8 +6 +4 +2 0 −2 −4 −6 −8 −1 −0.9 −0.8 −0.7 −1.1 −1.2 −1.3 −1.4 −1.5 Δ𝛿 ( ) 0 0.05 0.1 0.15 0.2 0 5 10 N u m b er o f spax els WR039 Mean log(N/O)= −1.09 Standard deviation= 0.19 WR057-log(N/O) +8 +6 +4 +2 0 −2 −4 −6 −8 +8 +6 +4 +2 0 −2 −4 −6 −8 −1.15 −1.2 −1.25 −1.3 −1.35 −1.4 −1.45 −1.5 −1.55 −1.6 Δ𝛿 ( ) 0 0.05 0.1 0.15 0.2 0 5 10 15 20 N u m b er o f spax els WR057
Gaussian mean log(N/O)= −1.42
Gaussian sigma= 0.07 WR266-log(N/O) +8 +6 +4 +2 0 −2 −4 −6 −8 +8 +6 +4 +2 0 −2 −4 −6 −8 −1.25 −1.2 −1.15 −1.1 −1.05 −1 −1.3 −1.35 −1.4 −1.45 −1.5 Δ𝛿 ( ) Δ𝛼() 0 5 10 15 N u m b er o f spax els WR266 Mean log(N/O)= −1.28 0 0.05 0.1 0.15 0.2 N(N)/N(O) Standard deviation= 0.10 Figure 4: Continued.
WR404-log(N/O) +8 +6 +4 +2 0 −2 −4 −6 −8 +8 +6 +4 +2 0 −2 −4 −6 −8 −1.35 −1.3 −1.25 −1.2 −1.15 −1.4 −1.45 −1.5 −1.55 −1.6 Δ𝛿 ( ) 0 0.05 0.1 0.15 0.2 0 5 10 15 20 25 N u m b er o f spax els WR404 Mean log(N/O)= −1.37 Standard deviation= 0.07 WR505-log(N/O) +8 +6 +4 +2 0 −2 −4 −6 −8 +8 +6 +4 +2 0 −2 −4 −6 −8 −1 −1.1 −1.2 −1.3 −1.4 −1.5 −0.7 −0.8 −0.9 Δ𝛿 ( ) Δ𝛼() 0 0.05 0.1 0.15 0.2 N(N)/N(O) 0 5 10 15 20 25 N u m b er o f spax els WR505 Mean log(N/O)= −1.21 Standard deviation= 0.15
Figure 4: N/O ratio maps derived as described in the text and histogram distributions in linear scale for WR038, WR039, and WR057. In all images, each spaxel has1resolution, north is up, and east is left. The colors in the bars have the same meaning as inFigure 3. Same figure for WR266, WR404, and WR505. 4700 4800 4900 5000 5100 Wavelength ( ˚A) 1e−16 1.5e−16 2e−16 Fl ux (er g(s/cm/ ˚ A)
Figure 5: Optical spectrum obtained by coadding the two spaxels in WR038 where the Wolf-Rayet blue bump is detected.
According to the chemical yields of massive stars from
Moll´a and Terlevich [50] presented in Figure 14 of
P´erez-Montero et al. [21], the stellar masses of the
ionizing clusters in the sample of WR galaxies studied
here (all of them around107M⊙) can produce a N/O
excess at distances compatible with the scales at which the N pollution has been detected by means of IFS in this work.
(ii) As the local N pollution has not been observed in all the studied objects in this work and in those where it was observed, it does not show a perfect match with the positions of the WR bump. Although it is necessary to take the limited spatial resolution of our observations into account, this mismatch could be possibly due to a timescale offset between the lifetime of the WR stars and the mixing of the ejected material with the ISM. Possibly, the positions with relatively high N/O trace regions where the WR stars were present. In contrast, the positions where the bumps are detected are tracing the ongoing star formation regions. This spatial mismatch between N excess and WR positions has also been observed in other nearby star-forming objects studied by means of optical IFS
(e.g., NGC5253, [27]). This timescale offset between
WR lifetimes and N mixing is supported by the results from other previous works based on IFS data where WR stars were reported, but not the excess
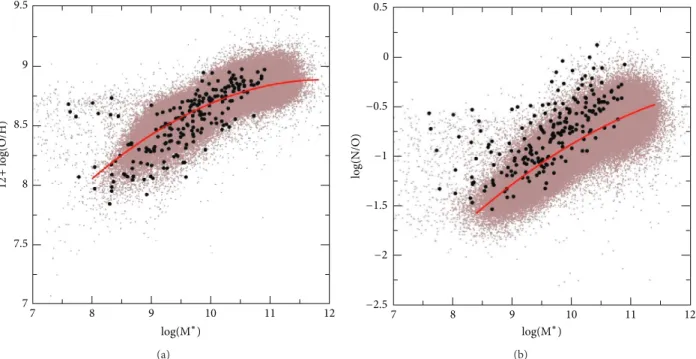
9.5 9 8.5 8 7.5 7 12 + log(O/H) log(M∗) 7 8 9 10 11 12 (a) 0.5 0 −0.5 −1 −2 −2.5 log(N/O) log(M∗) 7 8 9 10 11 12 −1.5 (b)
Figure 6: MZR (a) and MNOR (b) relations for the star-forming galaxies selected from the SDSS DR7. The solid red lines, calculated by P´erez-Montero et al. [55], are quadratic fits to the medians in stellar mass bins of 0.2 dex. The black points are the galaxies matching the catalog of WR galaxies by Brinchmann et al. [7].
in N/O (e.g., in this work, WR057 and WR404, in
HS0837 + 4717 and Mrk930 in [21], or in two out of
the three WR clusters detected in Mrk178 [22]).
(iii) The local nitrogen pollution happens while homo-geneous values of the oxygen abundance are found, which could be indicative that oxygen is not noti-ceably present in the winds ejected by the WR stars at this stage. Apparently, the properties of these winds (density, velocity, etc.) favour the mixing of their com-ponents with the surrounding warm ISM. However, the mixing expected later of the oxygen ejected dur-ing the last stages of the WR phase and the subsequent O-rich SNe explosions have a timescale much longer
than that of early WR winds (e.g., [51]).
(iv) Additional mechanisms other than the enrichment due to WR winds are thought to be responsible for the nitrogen overabundance in star-forming galaxies.
This is the case of collisional deexcitation of O+ in
strong shocks associated with mergers [52] or other
hydrodynamical processes, such as the infall of
pris-tine gas [29], which can at same time reduce the
overall metallicity of galaxies and boost the star form-ation. These processes could be behind the relation between metallicity and star-formation rate in galax-ies. On the contrary, such a mechanism will not have any influence on the abundance ratio of metals as N
and O [53]. A very suitable tool to identify these
pro-cesses and to distinguish them from local pollution, as in the case of N ejection by WR stars, is the simulta-neous analysis of the relations between stellar mass and metallicity (MZR) and with N/O (MNOR). This
was already used by Amor´ın et al. [54] to understand
the low metallicity combined with N/O ratio much higher than the values in the plateau of the diagram O/H versus N/O measured in green pea galaxies. In that work the analysis of these galaxies shows that these objects have the expected N/O for their masses, while they have systematically lower metallicities, even though WR stars have been detected in deep
GTC spectra of some of them [18].
Hence, for WR galaxies, we try to understand their aver-age observed N/O excess, as reported by Brinchmann et al.
[7], doing the same analysis. InFigure 6the MZR is shown
for the star-forming galaxies of the SDSS, with their stellar masses compiled from the Max Planck Institute for Astrophy-sics-Johns Hopkins University (MPA-JHU) catalog
(avail-able at http://www.mpa-garching.mpg.de/SDSS/) and
oxy-gen abundances calculated using the N2 parameter for emis-sion lines with S/N larger than 2. The solid red line, as
explained in P´erez-Montero et al. [55], is a quadratic fit to the
medians for stellar mass bins of 0.2 dex. The black points are the matches between the WR galaxy catalog by Brinchmann
et al. [7] and all the other star-forming SDSS galaxies selected
from the MPA/JHU list. The number of matches obeying the S/N criterion and having a minimum redshift (𝑧 > 0.02) to avoid serious aperture effects in the determination of the
stellar mass, as described in P´erez-Montero et al. [55], is 254.
In the right panel of the same figure, the MNOR is shown, as calculated using the N2S2 parameter with the calibration by
P´erez-Montero and Contini [48]. As can be appreciated and
contrary to green pea galaxies, the WR galaxies are in average in agreement with the metallicities expected for their stellar
mass but, in contrast, have larger N/O ratios, which could be just local pollution values in the same region covered by the SDSS fiber and possibly due to the enrichment by WR stars.
5. Summary
In this work, we presented 3.5 m CAHA-PMAS IFS obser-vations of six metal-poor compact WR galaxies selected
from the catalog published by Brinchmann et al. [7] in the
optical spectral range 3700–6850 ˚A. Our aim is to study the
connection between the presence of WR stars and N/O excess as compared with the values predicted by chemical evolution models at this metallicity regime.
We derived O/H and N/O abundances ratios using the direct method (i.e., with the determination of the electron
temperature) or strong-line methods based on [N ii] 6584 ˚A
emission line, such as N2, O3N2 (for O/H), and N2O2 (for N/O) with the calibrations provided by P´erez-Montero and
Contini [48], which are consistent with the direct method. We
studied the homogeneity of the spatial distributions of both O/H and N/O using the same statistical procedure introduced
by P´erez-Montero et al. [21] and improved by Kehrig et al.
[22].
Our results indicate that in all the studied objects O/H can be considered as uniform in scales of the order of several kpc, with the exception of WR404, for which a gradient of O/H is found in the same direction of a low surface brightness tail. In contrast, N/O can only be considered as homogeneous in WR057. In four of the six studied galaxies (WR038, WR039, WR266, and WR505), we found positions associated with or close to the WR stars with N excess in spatial scales of the order of several hundreds of pc. We discussed that, according
to the models presented by P´erez-Montero et al. [21] based
on massive star yields of Moll´a and Terlevich [50], the N
excess length scale is consistent with the distances at which the stellar clusters in these galaxies can enhance the gas-phase abundance of N. On the other hand, our analysis of both the MZR and the MNOR of the WR galaxies of the SDSS WR
catalog of Brinchmann et al. [7] excludes hydrodynamical
effects, such as metal-poor gas inflows, as the more frequent cause of the N excess detected in the SDSS galaxies with a detection of the WR bump.
Based on observations collected at the Centro Astro-n´omico Hispano Alem´an (CAHA) at Calar Alto, operated jointly by the Max-Planck Institut f¨ur Astronomie and the Instituto de Astrof´ısica de Andaluc´ıa (CSIC).
Acknowledgment
This work has been partially supported by projects AYA2007-67965-C03-02 and AYA2010-21887-C04-01 of the Spanish National Plan for Astronomy and Astrophysics. The authors thank an anonymous referee for his/her very thorough revision of this paper that has helped to improve it.
References
[1] D. E. Osterbrock and R. D. Cohen, “Two galaxies with Wolf-Rayet features in their spectra,” Astrophysical Journal, vol. 261, pp. 64–69, 1982.
[2] D. A. Allen, A. E. Wright, and W. M. Goss, “The dwarf emission galaxy He 2.10,” Monthly Notices of the Royal Astronomical
Society, vol. 177, p. 91, 1976.
[3] P. S. Conti, C. D. Garmany, and P. Massey, “Spectroscopic stud-ies of Wolf-Rayet stars. V-Optical spectrophotometry of the emission lines in Small Magellanic Cloud stars,” The
Astrophys-ical Journal, vol. 341, pp. 113–119, 1989.
[4] D. Schaerer, T. Contini, and M. Pindao, “New catalogue of Wolf-Rayet galaxies and high-excitation extra-galactic HII regions,”
Astronomy & Astrophysics, vol. 136, no. 1, pp. 35–52, 1999.
[5] N. G. Guseva, Y. I. Izotov, and T. X. Thuan, “A spectroscopic study of a large sample of Wolf-Rayet galaxies,” Astrophysical
Journal Letters, vol. 531, no. 2, pp. 776–803, 2000.
[6] W. Zhang, X. Kong, C. Li, H.-Y. Zhou, and F.-Z. Cheng, “Wolf-Rayet galaxies in the Sloan Digital Sky Survey: the metallicity dependence of the initial mass function,” Astrophysical Journal
Letters, vol. 655, no. 2 I, pp. 851–862, 2007.
[7] J. Brinchmann, D. Kunth, and F. Durret, “Galaxies with Wolf-Rayet signatures in the low-redshift Universe,” Astronomy &
Astrophysics, vol. 485, pp. 657–677, 2008.
[8] P. A. Crowther, “Physical properties of Wolf-Rayet stars,”
Annual Review of Astronomy & Astrophysics, vol. 45, pp. 177–
219, 2007.
[9] F. Legrand, D. Kunth, J.-R. Roy, J. M. Mas-Hesse, and J. R. Walsh, “Detection of WR stars in the metal-poor starburst galaxy IZw 18,” Astronomy & Astrophysics, vol. 326, no. 3, pp. L17–L20, 1997. [10] R. M. G. Delgado, M. Cervi˜no, L. P. Martins, C. Leitherer, and P. H. Hauschildt, “Evolutionary stellar population synthesis at high spectral resolution: optical wavelengths,” Monthly Notices
of the Royal Astronomical Society, vol. 357, no. 3, pp. 945–960,
2005.
[11] J. M. V´ılchez and C. Esteban, “Wolf Rayet stars and interrela-tions with other massive stars in galaxies,” in Proceedings of the
IAU Symposium, vol. 143, Bali, Indonesia, 1991.
[12] C. Esteban and J. M. V´ılchez, “On the chemodynamics of Wolf-Rayet ring nebulae—NGC 6888,” The Astrophysical Journal, vol. 390, pp. 536–540, 1992.
[13] A. Fern´andez-Mart´ın, D. Mart´ın-Gord´on, J. M. V´ılchez et al., “Ionization structure and chemical abundances of the Wolf-Rayet nebula NGC 6888 with integral field spectroscopy,”
Astronomy & Astrophysics, vol. 541, article A119, 2012.
[14] S. Pustilnik, A. Kniazev, A. Pramskij et al., “HS 0837 + 4717—a metal-deficient blue compact galaxy with large nitrogen excess,”
Astronomy & Astrophysics, vol. 419, no. 2, pp. 469–484, 2004.
[15] A. R. L´opez-S´anchez, C. Esteban, J. Garc´ıa-Rojas, M. Peimbert, and M. Rodr´ıguez, “The localized chemical pollution in NGC 5253 revisited: results from deep echelle spectrophotometry,”
The Astrophysical Journal, vol. 656, p. 168, 2007.
[16] G. F. H¨agele, E. P´erez-Montero, ´A. I. D´ıaz, E. Terlevich, and R. Terlevich, “The temperature and ionization structure of the emitting gas in H II galaxies: implications for the accuracy of abundance determinations,” Monthly Notices of the Royal
Astronomical Society, vol. 372, no. 1, pp. 293–312, 2006.
[17] G. F. H¨agele, ´A. I. D´ıaz, E. Terlevich, R. Terlevich, E. P´erez-Montero, and M. V. Cardaci, “Precision abundance analysis of bright H ii galaxies,” Monthly Notices of the Royal Astronomical
Society, vol. 383, pp. 209–229, 2008.
[18] R. Amor´ın, E. P´erez-Montero, J. M. V´ılchez, and P. Papaderos, “The star formation history and metal content of the green peas. New detailed gtc-osiris spectrophotometry of three galaxies,”
[19] M. Moll´a, J. M. V´ılchez, M. Gavil´an, and A. I. D´ıaz, “The nitro-gen-to-oxygen evolution in galaxies: the role of the star forma-tion rate,” Monthly Notices of the Royal Astronomical Society, vol. 372, pp. 1069–1080, 2006.
[20] C. Kehrig, J. M. V´ılchez, and S. F. S´anchez, “The interplay between ionized gas and massive stars in the HII galaxy IIZw70: integral field spectroscopy with PMAS,” Astronomy &
Astrophysics, vol. 477, pp. 813–822, 2008.
[21] E. P´erez-Montero, J. M. V´ılchez, B. Cedr´es et al., “Integral field spectroscopy of nitrogen overabundant blue compact dwarf galaxies,” Astronomy & Astrophysics, vol. 532, article A141, 2011. [22] C. Kehrig, E. Perez-Montero, J. M. V´ılchez et al., “Uncovering multiple Wolf-Rayet star clusters and the ionized ISM in Mrk 178: the closest metal-poor Wolf-Rayet H ii galaxy,” Monthly
Notices of the Royal Astronomical Society, vol. 432, pp. 2731–
2745, 2013.
[23] C. Kehrig, M. S. Oey, P. A. Crowther et al., “Gemini GMOS spec-troscopy of HeII nebulae in M 33,” Astronomy & Astrophysics, vol. 526, no. 16, article A128, 2011.
[24] M. Shirazi and J. Brinchmann, “Strongly star forming galaxies in the local Universe with nebular Heii𝜆4686 emission,” Monthly
Notices of the Royal Astronomical Society, vol. 421, no. 2, pp.
1043–1063, 2012.
[25] ´A. R. L´opez-S´anchez, A. Mesa-Delgado, L. L´opez-Mart´ın, and C. Esteban, “The ionized gas at the centre of IC10: a possible localized chemical pollution by Wolf-Rayet stars,” Monthly
Notices of the Royal Astronomical Society, vol. 411, no. 3, pp.
2076–2092, 2011.
[26] B. L. James, Y. G. Tsamis, J. R. Walsh, M. J. Barlow, and M. S. Westmoquette, “The Lyman break analogue Haro 11: spatially resolved chemodynamics with VLT FLAMES,” Monthly Notices
of the Royal Astronomical Society, vol. 430, pp. 2097–2112, 2013.
[27] A. Monreal-Ibero, J. R. Walsh, and J. M. V´ılchez, “The ionized gas in the central region of NGC 5253. 2D mapping of the physical and chemical properties,” Astronomy & Astrophysics, vol. 544, article A60, 2012.
[28] M. S. Westmoquette, B. James, A. Monreal-Ibero, and J. R. Walsh, “Piecing together the puzzle of NGC 5253: abundances, kinematics and WR stars,” Astronomy & Astrophysics, vol. 550, article A88, 2013.
[29] J. K¨oppen and G. Hensler, “Effects of episodic gas infall on the chemical abundances in galaxies,” Astronomy & Astrophysics, vol. 434, no. 2, pp. 531–541, 2005.
[30] B. L. James, Y. G. Tsamis, M. J. Barlow, J. R. Walsh, and M. S. Westmoquette, “The merging dwarf galaxy UM 448: chemody-namics of the ionized gas from VLT integral field spectroscopy,”
Monthly Notices of the Royal Astronomical Society, vol. 428, no.
1, pp. 86–102, 2013.
[31] J. A. Baldwin, M. M. Phillips, and R. Terlevich, “Classifica-tion parameters for the emission-line spectra of extragalactic objects,” Publications of the Astronomical Society of the Pacific, vol. 93, pp. 5–19, 1981.
[32] M. M. Roth, T. Fechner, D. Wolter et al., “Commissioning of the CCD231 4K×4K detector for PMAS,” in High Energy, Optical,
and Infrared Detectors for Astronomy IV, vol. 7742 of Proceedings of SPIE, June 2010.
[33] S. F. S´anchez, “Techniques for reducing fiber-fed and inte-gral-field spectroscopy data: An implementation on R3D,”
Astronomische Nachrichten, vol. 327, pp. 850–861, 2006.
[34] C. Sandin, T. Becker, M. M. Roth et al., “P3D: a general data-reduction tool for fiber-fed integral-field spectrographs,”
Astro-nomy & Astrophysics, vol. 515, article A35, 2010.
[35] A. Kelz, M. A. W. Verheijen, M. M. Roth et al., “PMAS: the potsdam multi-aperture spectrophotometer—II. The wide inte-gral field unit PPak,” Publications of the Astronomical Society of
the Pacific, vol. 118, no. 839, pp. 129–145, 2006.
[36] A. I. Diaz, “Hydrogen absorption line profiles of ionizing star clusters,” Monthly Notices of the Royal Astronomical Society, vol. 231, pp. 57–67, 1988.
[37] G. Bruzual and S. Charlot, “Stellar population synthesis at the resolution of 2003,” Monthly Notices of the Royal Astronomical
Society, vol. 344, no. 4, pp. 1000–1028, 2003.
[38] R. Cid Fernandes, Q. Gu, J. Melnick et al., “The star formation history of Seyfert 2 nuclei,” Monthly Notices of the Royal
Astro-nomical Society, vol. 355, no. 1, pp. 273–296, 2004.
[39] A. Mateus, L. Sodr´e Jr., R. C. Fernandes, G. Stasi´nska, W. Schoenell, and J. M. Gomes, “Semi-empirical analysis of Sloan Digital Sky Survey galaxies—II. The bimodality of the galaxy population revisited,” Monthly Notices of the Royal Astronomical
Society, vol. 370, no. 2, pp. 721–737, 2006.
[40] E. P´erez-Montero and A. I. D´ıaz, “Line temperatures and elemental abundances in H II galaxies,” Monthly Notices of the
Royal Astronomical Society, vol. 346, no. 1, pp. 105–118, 2003.
[41] P. J. Storey and D. G. Hummer, “Recombination line intensities for hydrogenic ions-IV. Total recombination coefficients and machine-readable tables for Z=1 to 8,” Monthly Notices of the
Royal Astronomical Society, vol. 272, pp. 41–48, 1995.
[42] J. A. Cardelli, G. C. Clayton, and J. S. Mathis, “The relationship between infrared, optical, and ultraviolet extinction,” The
Astro-physical Journal, vol. 345, pp. 245–256, 1989.
[43] A. Y. Kniazev, E. K. Grebel, L. Hao, M. A. Strauss, J. Brinkmann, and M. Fukugita, “Discovery of eight new extremely metal-poor galaxies in the sloan digital sky survey,” Astrophysical Journal
Letters, vol. 593, no. 2, pp. L73–L76, 2003.
[44] G. Denicol´o, R. Terlevich, and E. Terlevich, “New light on the search for low-metallicity galaxies—I. The N2 calibrator,”
Monthly Notices of the Royal Astronomical Society, vol. 330, no.
1, pp. 69–74, 2002.
[45] E. P´erez-Montero and A. I. D´ıaz, “A comparative analysis of empirical calibrators for nebular metallicity,” Monthly Notices of
the Royal Astronomical Society, vol. 361, no. 3, pp. 1063–1076,
2005.
[46] D. Alloin, S. Collin-Souffrin, M. Joly, and L. Vigroux, “Nitrogen and oxygen abundances in galaxies,” Astronomy & Astrophysics, vol. 78, pp. 200–216, 1979.
[47] M. Pettini and B. E. J. Pagel, “[O III]/[N II] as an abundance indicator at high redshift,” Monthly Notices of the Royal
Astro-nomical Society, vol. 348, no. 3, pp. L59–L63, 2004.
[48] E. P´erez-Montero and T. Contini, “The impact of the nitrogen-to-oxygen ratio on ionized nebula diagnostics based on [N ii] emission lines,” Monthly Notices of the Royal Astronomical
Society, vol. 398, no. 2, pp. 949–960, 2009.
[49] H. W. Lilliefors, “On the Kolmogorov-Smirnov test for normal-ity with mean and variance unknown,” Journal of the American
Statistical Association, vol. 62, pp. 399–402, 1967.
[50] M. Moll´a and R. Terlevich, “Modelling the composition of a young star cluster ejecta,” Monthly Notices of the Royal
Astro-nomical Society, vol. 425, pp. 1696–1708, 2012.
[51] G. Tenorio-Tagle, “Interstellar matter hydrodynamics and the dispersal and mixing of heavy elements,” Astronomical Journal, vol. 111, no. 4, pp. 1641–1650, 1996.
[52] J. C. Raymond, “Shock waves in the interstellar medium,”
[53] M. G. Edmunds, “General constraints on the effect of gas flows in the chemical evolution of galaxies,” Monthly Notices of the
Royal Astronomical Society, vol. 246, p. 678, 1990.
[54] R. O. Amor´ın, E. P´erez-Montero, and J. M. V´ılchez, “On the oxygen and nitrogen chemical abundances and the evolution of the “green pea” galaxies,” The Astrophysical Journal Letters, vol. 715, article L128, 2010.
[55] E. P´erez-Montero, T. Contini, F. Lamareille et al., “The cosmic evolution of oxygen and nitrogen abundances in star-forming galaxies over the past 10 Gyr,” Astronomy & Astrophysics, vol. 549, article A25, 2013.
Submit your manuscripts at
http://www.hindawi.com
Hindawi Publishing Corporation
http://www.hindawi.com Volume 2014
High Energy PhysicsAdvances in
World Journal
Hindawi Publishing Corporation
http://www.hindawi.com Volume 2014
Hindawi Publishing Corporation
http://www.hindawi.com Volume 2014
Fluids
Journal ofAtomic and Molecular Physics Journal of
Hindawi Publishing Corporation
http://www.hindawi.com Volume 2014 Hindawi Publishing Corporation
http://www.hindawi.com Volume 2014 Condensed Matter Physics
Optics
International Journal of
Hindawi Publishing Corporation
http://www.hindawi.com Volume 2014
Hindawi Publishing Corporation
http://www.hindawi.com Volume 2014
Astronomy
Advances inInternational Journal of
Hindawi Publishing Corporation
http://www.hindawi.com Volume 2014
Superconductivity
Hindawi Publishing Corporation
http://www.hindawi.com Volume 2014
Statistical Mechanics
International Journal of Hindawi Publishing Corporation
http://www.hindawi.com Volume 2014
Gravity
Hindawi Publishing Corporation
http://www.hindawi.com Volume 2014
Astrophysics
Journal ofHindawi Publishing Corporation
http://www.hindawi.com Volume 2014
Physics
Research International
Hindawi Publishing Corporation
http://www.hindawi.com Volume 2014
Solid State PhysicsJournal of Computational Methods in Physics Journal of
Hindawi Publishing Corporation
http://www.hindawi.com Volume 2014
Hindawi Publishing Corporation
http://www.hindawi.com Volume 2014
Soft Matter
Hindawi Publishing Corporation http://www.hindawi.com
Aerodynamics
Journal ofVolume 2014 Hindawi Publishing Corporation
http://www.hindawi.com Volume 2014
Photonics
Hindawi Publishing Corporation
http://www.hindawi.com Volume 2014
Journal of
Biophysics
Hindawi Publishing Corporation
http://www.hindawi.com Volume 2014

![Figure 2: Relation between the [O ii]/[O iii] and [N ii]/H](https://thumb-eu.123doks.com/thumbv2/123doknet/14796871.604222/8.900.135.765.100.1075/figure-relation-emission-spaxels-sufficient-involved-observed-galaxies.webp)