University of Dundee
Tracing the ancestry of modern bread wheats
Pont, Caroline; Leroy, Thibault; Seidel, Michael; Tondelli, Alessandro; Duchemin, Wandrille
Published in: Nature Genetics DOI: 10.1038/s41588-019-0393-z Publication date: 2019 Document Version Peer reviewed version
Link to publication in Discovery Research Portal
Citation for published version (APA):
, Pont, C., Leroy, T., Seidel, M., Tondelli, A., Duchemin, W., Armisen, D., Lang, D., Bustos-Korts, D., Goué, N., Balfourier, F., Molnár-Láng, M., Lage, J., Kilian, B., Özkan, H., Waite, D., Dyer, S., Letellier, T., Alaux, M., ... Salse, J. (2019). Tracing the ancestry of modern bread wheats. Nature Genetics, 51(5), 905-911.
https://doi.org/10.1038/s41588-019-0393-z
General rights
Copyright and moral rights for the publications made accessible in Discovery Research Portal are retained by the authors and/or other copyright owners and it is a condition of accessing publications that users recognise and abide by the legal requirements associated with these rights.
• Users may download and print one copy of any publication from Discovery Research Portal for the purpose of private study or research. • You may not further distribute the material or use it for any profit-making activity or commercial gain.
• You may freely distribute the URL identifying the publication in the public portal.
Take down policy
If you believe that this document breaches copyright please contact us providing details, and we will remove access to the work immediately and investigate your claim.
1
Tracing the ancestry of modern bread wheats.
Caroline Pont1*, Thibault Leroy2,3*, Michael Seidel4*, Alessandro Tondelli5*, Wandrille Duchemin1*, David
Armisen1*, Daniel Lang4*, Daniela Bustos-Korts6*, Nadia Goué1, François Balfourier1, Marta
Molnar-Lang7, Jacob Lage8, Benjamin Kilian9,10, Hakan Özkan11, Darren Waite12, Sarah Dyer13, Thomas Letellier14,
Michael Alaux14, WHEALBI consortium15, IWGSC16, Joanne Russell17, Beat Keller18, Fred van Eeuwijk6,
Manuel Spannagl4, Klaus F.X. Mayer4,19, Robbie Waugh17,20,21, Nils Stein10, Luigi Cattiveli5§, Georg
Haberer4§, Gilles Charmet1§, Jerome Salse1§†
1. INRA-Université Clermont-Auvergne, UMR 1095 GDEC, 5 Chemin de Beaulieu, 63000 Clermont-Ferrand,
France.
2. INRA-Université de Bordeaux, UMR 1202 BIOGECO, 69 Route d'Arcachon, 33612 Cestas, France. 3. ISEM, Université de Montpellier, CNRS, IRD, EPHE, Place Eugène Bataillon, 34095 Montpellier, France 4. PGSB, Helmholtz Center Munich, Ingolstädter Landstraße 1 · D-85764 Neuherberg, Germany.
5. Council for Agricultural Research and Economics (CREA), Research Centre for Genomics and Bioinformatics,
via S. Protaso, 302. I -29017 Fiorenzuola d'Arda PC, Italy.
6. Wageningen University, Droevendaalsesteeg 4, 6708 PB, Wageningen, Netherlands.
7. Agricultural Institute, Centre for Agricultural Research, Hungarian Academy of Sciences, Martonvásár,
Brunszvik u. 2, 2462, Hungary.
8. KWS UK Ltd, 56 Church St, Thriplow, Royston SG8 7RE, United Kingdom. 9. Global Crop Diversity Trust, 53113 Bonn, Germany.
10. Leibniz Institute of Plant Genetics and Crop Plant Research (IPK), Corrensstraße 3, 06466 Gatersleben,
Germany.
11. University of Çukurova, Faculty of Agriculture, Department of Field Crops, 01330 Adana, Turkey. 12. Earlham Institute, Norwich Research Park, Norwich NR4 7UZ, United Kingdom.
13. NIAB, Huntingdon Road, Cambridge CB3 0LE, United Kingdom. 14. URGI, INRA, Université Paris-Saclay, 78026, Versailles, France.
15. WHEAt and barley Legacy for Breeding Improvement (WHEALBI) consortium, https://www.whealbi.eu/project/partners/. Coordinator, Gilles Charmet ([email protected]), INRA UMR 1095 GDEC, France.
16. International Wheat Genome Sequencing Consortium (IWGSC), http://www.wheatgenome.org. Executive
Director, Kellye Eversole ([email protected]), 2841 NE Marywood Ct Lee's Summit, MO 64086,
United States.
17. The James Hutton Institute, Invergowrie Dundee DD2 5DA, Scotland.
18. Department of Plant and Microbial Biology, University of Zurich, Zollikerstrasse 107, 8008 Zürich,
Switzerland.
19. School of Life Sciences, Technical University Munich, Weihenstephan, Germany.
20. The University of Dundee, Division of Plant Sciences, School of Life Sciences, Dundee, DD1 4HN, Scotland. 21. School of Agriculture, Food and Wine, University of Adelaide, Adelaide, South Australia, Australia.
* These authors contributed equally to this work. § These authors jointly supervised this work. † Corresponding author.
ABSTRACT - For more than 10,000 years, the selection of plant and animal traits that are better tailored for human use has shaped the development of civilizations. During this period, bread wheat (Triticum aestivum) emerged as one of the world’s most important crops. We used exome sequencing of a world-wide panel of
almost 500 genotypes selected from across the geographical range of the wheat species complex to explore how 10,000 years of hybridization, selection, adaptation and plant breeding shaped the genetic makeup of modern bread wheats. We observed considerable genetic variations at the genic, chromosomal and subgenomic levels deciphering the likely origins of modern day wheats, the consequences of range expansion and allelic variants selected since its domestication. Our data supports a reconciled model of wheat evolution and provides novel avenues for future breeding improvement.
INTRODUCTION
-
Bread wheat has an allo-hexaploid genome consisting of three closely related subgenomes (AABBDD). It is proposed to have originated from two polyploidization events, (i) a tetraploidization some 0.5 million years before present (ybp) from the hybridization between wild Triticum urartu Tumanian ex Gandilvan (AA) and an undiscovered species of the Aegilops speltoides Tausch lineage (BB), followed by (ii) a hexaploidization some 10,000 ybp as a result of hybridization between a descendant of this original tetraploid hybrid (AABB) and the wild diploid Aegilops tauschii (Coss) (DD)1. Archaeobotanical evidence suggests that the2
resulting allo-hexaploid wheats were domesticated in the Fertile Crescent, a region extending from Israel, Jordan, Lebanon, Syria to South-East Turkey, to northern Iraq and western Iran 2-5. Modern cultivated bread wheats are
therefore the product of at least 10,000 years of human selection during domestication and cultivation (improvement and breeding). Today they comprise high-yielding varieties adapted to a wide range of environments ranging from low humidity regions in Nigeria, Australia, India, and Egypt to high humidity regions like South America6.
RESULTS
-
In order to explore the origins and patterns of genetic diversity that exist within the currently accessible wheat gene pool, we assembled a worldwide panel of 487 genotypes that included wild diploid and tetraploid relatives, domesticated tetraploid and hexaploid landraces, old cultivars and modern elite cultivars (Table S1). Mapping exome capture sequence data7 from these lines onto the ‘Chinese Spring’ reference genome sequence(IWGSC8) revealed 620,158 genetic variants (including 595,939 SNPs and InDels between hexaploid genotypes)
distributed across 41,032 physically ordered wheat genes (Table S2). Equivalent sequence coverage at the chromosome and homoeologous gene/region levels (medians within one standard deviation) excluded bias in the detection and calling of structural variants (Figure S1). Furthermore, correlation between gene and structural variant distribution (r>82%) across the three subgenomes, expected from exome capture experiment, supports the lack of bias in genic variants detection at the chromosome level with a visible gradient from distal gene-rich regions to pericentromeric gene-poor regions (Figure S2). Both individual subgenomes (with a B>A>>D gradient) and chromosome compartments (with a telomere>core>>centromere gradient) exhibited differences in their content of structural variation (Figure S3). In summary, our variant dataset provides a comprehensive overview of wheat genomic diversity at various scales (gene, region, chromosome and genome), and represent a rich source of genetic information for exploitation by both the academic and agricultural research communities (Figure 1, circles #1 to #3).
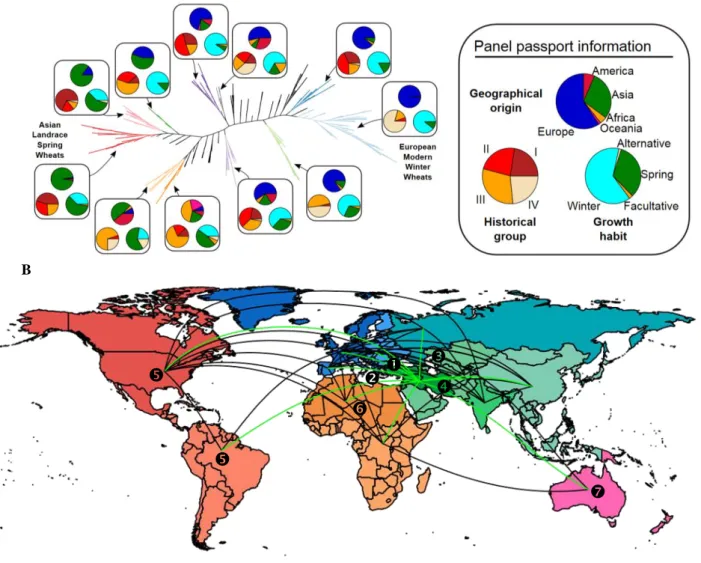
Phylogenetic and principle component analyses revealed three major factors driving the partitioning of diversity within our panel (Figure 2): vernalization requirement (winter vs spring), historical groups (groups I to IV, oldest to newest: old landraces to modern elite lines) and geographical origin (Europe, Asia, Oceania, Africa and America), Figure 2A and Figure S4. Among the 11 major tree clades chosen on the criteria of size,
representativeness and statistical support, permutation tests for the conservation of clade monophyly significantly
confirmed a strong grouping for all three dimensions (p-value<10e-6). However, the deep structure of the phylogeny is centered around continental difference, and subsequently more recent shifts in growth habit traits (such as vernalization requirement) resulting from intense selection for yield in modern wheat breeding practices. Superimposing both country and continent of origin onto the phylogenetic clusters suggests that the observed genetic diversity is mainly structured along an east-west axis consistent with established routes of human migration out of the Fertile Crescent. Two paths to Western Europe follow an inland (via Anatolia and the Balkans to Central Europe) and coastal (via Egypt to the Maghreb and Iberian Peninsula) route, complemented by two additional paths north-east and along the Inner Asian Mountain Corridor, followed by further colonization events in American, Oceanian, African territories (Figure 2B, Figure S5) 9.
We next explored selection footprints resulting from domestication (comparing wild and domesticated wheats) and breeding (comparing historical bread wheat groups I to IV) using a sliding-window (as opposed to
gene-centric) approach to deciphering local reduction in diversityand taking into account the geographical structuring
of the wheat panel (Figure 1 circles #4 and #5). For the detection of domestication signals, we computed the nucleotide diversity per site (Tajima’s π) over non-overlapping 1 Mb sliding windows for wild diploid (T. urartu,
A. speltoides, A. tauschii), wild tetraploid (T. dicoccoides) and the domesticated hexaploid (T. aestivum) wheats
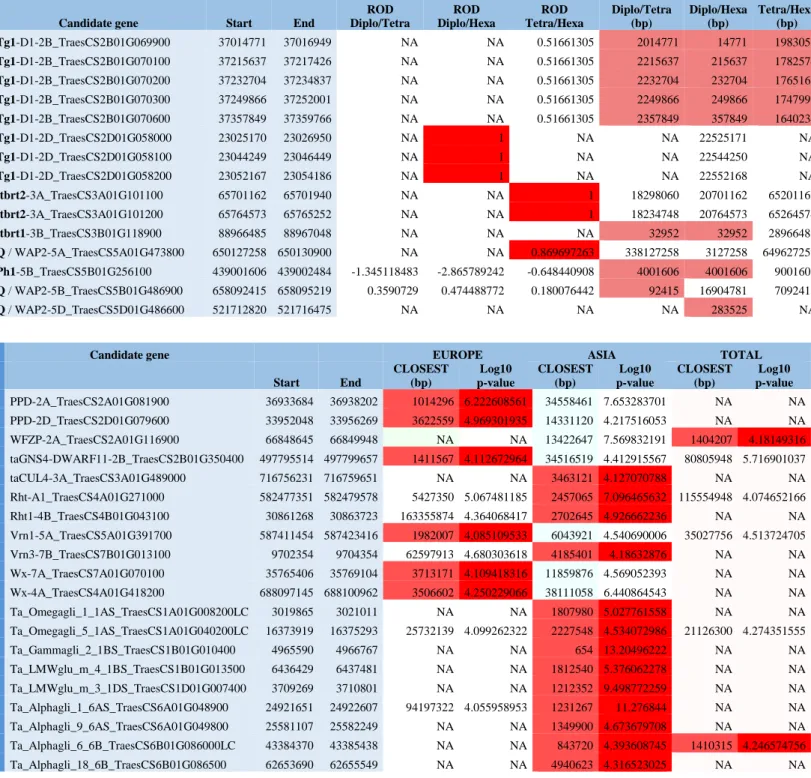
from Asia, where the previous diploid and tetraploid progenitors in our panel originated. Contrasts between wild wheat ancestors and hexaploid landraces support considerable heterogeneity in the reduction of diversity (RoD) during the domestication process along the wheat genome (Figure S6). Strongly affected genomic regions (1,221), showing a loss of at least four-fifths of the diversity (RoD>0.8, red dots in Fig 1 circle #5), cover 9.2% of the wheat genome (1.2 Gb). Known domestication genes conferring brittle rachis (Brt), tenacious glume (Tg), homoeologous pairing (Ph) and non-free-threshing character (Q) were identified within or in close (<5 Mb distance) proximity to these regions. Interestingly, known domestication genes only account for a minority of the observed peaks, suggesting that further domestication genes still need to be discovered(Table S3) 10-11, as reported
for other grass species such as maize12.
To unravel regions targeted by breeders during the last centuries of wheat improvement, we compared the RoD statistics in the European panel within historical groups II, III and IV (i.e. those subject to breeding) to those of Group I (landraces), Figure 3A. Our results are consistent with two main rounds of diversity reduction, an initial wave between Groups I and II (11.7% of RoD),reflecting early breeding improvement, and a second wave between groups III and IV (13.3% of RoD) that followed the green revolution (i.e. renovation of agricultural practices
starting between 1950 and the late 1960s). Modern wheat varieties showed an average loss of nucleotide diversity
of 21.8% compared to those of Group I, with strong variation within and between chromosomes (Figure 3B). This appeared to be more intense on the A (median RoD =33.2%) and B (median RoD =28.0%) subgenomes compared
3
to the D subgenome (median RoD =5.8%), which may reflect their different contributions to wheat improvement (Figure 3A). To identify genetic markers/regions selected by wheat breeders, we performed a genome-wide scan across all samples using the individual-centric method PCAdapt13to take into account the graduated population structure within and between groups, and at a higher granularity among European and Asian samples separately (Figure S7). We identified 5,089 polymorphic sites exhibiting improvement signals (p-values < 0.0001, red dots in Fig 1 circle #4). Known genes including Ppd and VRN genes for photoperiod sensitivity and vernalization, Rht for reduced height, Glutenin and Gliadin genes involved in seed storage protein accumulation, FZP for Frizzy panicle, GNS for grain number, Wx for waxy as well as the CUL gene driving plant architecture, were located close (<5 Mb distance) to these improvement signals (Table S3)14-17. Large genomic regions (>10 Mb) where selection appears to have occurred during the last centuries (between historical groups I and IV) and eventually became fixed, were observed especially on chromosome 1A and the two most structurally re-arranged chromosomes 4A and 7B of the wheat genome (Figure 3B)18. Extending the 8,308 and 9,948 polymorphic sites associated to improvement footprints observed in the European and Asian genotypes over 2 Mb overlapping windows, defined a cumulative genomic space of 950 Mb (7% of the genome) and 1.3 Gb (10% of the genome) with selection signatures for the two geographical areas respectively. Interestingly, only 168 Mb (13 to 18% of the previous genomic space under selection) of the genomic regions harboring selection signatures are identical between the European and Asian germplasm, suggesting independent improvement targets from the two geographic origins (Figure S7).
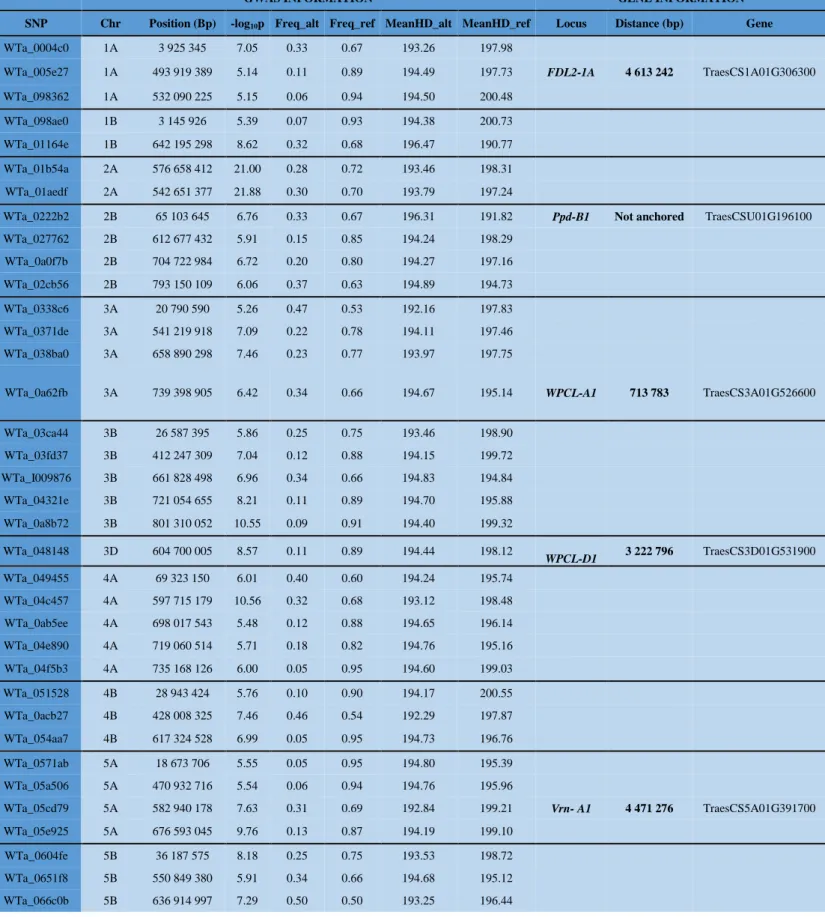
We then tested whether the observed allelic variation could be linked to two key life-history traits, heading date (HD) and plant height (PH) by conducting multi-environment genome-wide association studies (GWAS), Figure 1 circles #6 and #7. We grew and evaluated 435 hexaploid bread wheat genotypes for heading date and plant height in four common garden experiments (partially replicated design) in France (INRA, Clermont-Ferrand), Hungary (ATK, Martonvasar), Turkey (University of Çukurova, Adana) and United Kingdom (KWS, Cambridge). A sub-set of 390,657 SNPs, stringently filtered for call rate (<0.80) and Minor Allele Frequency (MAF, >0.05) was used for GWAS. We identified 48 and 40 genomic sites significantly associated (p-values of 0.01 and 0.05 FDR significance thresholds) with variation in HD (Figure S8, Table S4) and PH (Figure S9, Table S5) respectively, including regions (<15 Mb) containing known (Ppd, VNR, FDL, WPCL for HD and Rht for PH)19and unknown genes. The current data provide the basis for identifying relevant candidate genes in the previous anonymous
detected loci for functional validation, as exemplified for the major HD association detected on the chromosome
2A where Cry (Cryptochrome) is putative driver (Figure S8). Notably, diversity, selection footprint and GWAS
analyses clearly showed that only a small fraction of homoeologous loci harbour coincident signals, supporting the view that modern hexaploid bread wheats behave genetically as diploids, as previously suggested from the convergent pattern of (also referenced as parallel advantageous) selection shown to be rare between homoeologous regions 14.
Finally, we implemented a network-based phylogenetic approach20-21involving the inference of 1,000 trees from repeated random haplotype samples (RRHS) with maximum likelihood, subsequent graph reconstruction analysis and community clustering to reconstruct the reticulated evolutionary history of modern hexaploid bread wheats from their di- and tetraploid progenitors. The resulting clustered consensus network (Figure 4A) comprises signals of vertical (species relationships) and horizontal (reticulation) events within the Triticum-Aegilops species complex. The intermediate positioning in network of synthetic polyploid wheats (i.e synthetic T. turgidum deriving from T. durum x T. dicoccoides and synthetic T. aestivum deriving from. T. durum x A. tauschii) between their direct progenitors validate the robustness of our phylogenetic inference of the entire wheat panel (Figure 4A, Figure S10). An integrative model of wheat evolution (Figure 4B) was derived from the combined conclusions drawn from the in-depth analysis of the networks’ edges and edge weights20-21(Figure 4A, Figure S10), and
supported through the evaluation of alternative consensus tree topologies22(Figure S11) and gene flow tests using
Patterson's D statistic23 (Figure S12). For example, we were able to reconstruct, at the subgenome level, the
introgressions at the basis of modern synthetic T. turgidum (F7 RIL offsprings) polyploids mentioned earlier and detected as hybrids (Figures S10-S11-S12) by all methods with dominant T. dicoccoides genotypes and multiple independent T. durum introgressions24, illustrating the resolution gained for such combination of complementary approaches.
Our proposed model (Figure 4B) largely refines the widely accepted evolutionary path leading to modern bread wheat with the hybridization of wild diploid AA and SS (close to BB) genotypes leading to wild tetraploid AABB progenitors, which subsequently hybridized with a wild diploid DD genotype resulting in the hexaploid T. aestivum (AADDBB) lineage24. In our analysis, the wheat B genome is confirmed to be derived from the Aegilops section
Sitopsis lineage, which gave rise to A. speltoides (SS), while the progenitors of A. tauschii and T. urartu represent
the established origins of the D and A genome lineages, respectively25. T. araraticum (also referenced as T. araraticum Jakubz) represents the closest wild descendant of the AAGG tetraploid genome ancestor. It appears to have been subsequently domesticated to form T. timopheevii (Zhuk.) Zhuk while also hybridizing with T.
boeoticum leading to the hexaploid T. zhukovshyi (Menabde & Ericzjan) lineage (AAAAGG)26,27. The model
4
subgenomes of all the modern tetraploid AABB and hexaploid AABBDD genotypes. Our data suggest that during the early phase of domestication and cultivation, a pool of wild emmer wheat T. diccocoides (Körn. ex Asch. & Graebner) Schweinf. gave rise to at least two distinct lineages of domesticated tetraploids, T. dicoccum Schrank ex Schübl. (domesticated emmer, also known as T. dicoccon Schrank) and T. durum Desf. (domesticated durum or hard or pasta wheat)28,29. Finally, the model supports T. aestivum as being most likely derived from an ancestral
hybridization event between the previous T. durum30 lineage and a D lineage close to wild A. tauschii31 (Figure 4B, Figure S11). Subsequently, T. spelta emerged from the hybridization between the hexaploid T. aestivum and the tetraploid T. dicoccum, and still harbors evidence of T. dicoccum introgressions today (Figure S12). Additional putative reticulation events (Figure S12), supported only by either of the three analytical approaches (network,
tree, Patterson's D) need further investigation and were not integrated in our evolutionary model (Figure 4B).
Such a reticulated evolutionary scenario would first have led to a founder hexaploid bread wheat gene pool (α community, Figure 4A) that was established during and following domestication. This would likely have consisted of primitive wheat landraces originating in the Fertile Crescent, leading to two (β and γ) derived communities of hexaploids (Figure 4A, Figure S13). While the γ cluster is enriched for modern genotypes from Western Europe (i.e. lines originating from 1986 or later, mostly comprising wheat cultivars and current varieties), the β cluster is
enriched for Eastern Europe countries formerly part of the Warsaw Pact from May 1955, during the Cold War. The clear separation in evolutionary phylogeny between these two modern pools (β and γ) may reflect how human history and resulting socioeconomic consequences have influenced the genetic makeup of modern wheat germplasm, with β genotypes still grown in Hungary and Ukraine today, while γ genotypes still dominate many parts of the European Union.
CONCLUSION
-
Bread wheat derives from a reticulated evolution from its di- and tetraploid progenitors involving massive and recurrent hybridization and gene flow events with the T. durum lineage being the most likely ancestor of today’s bread wheat cultivated germplasm. Such a complex history of hybridizations and gene flows explains the observed partitioning of diversity at the genomic scale (impoverished on the D subgenome) and supports the view that modern hexaploid bread wheats behave genetically as diploids with compartmentalized selective footprints, as well as trait loci, with only a small fraction of homoeologous loci harbouring domestication and/or breeding sweeps or influencing defined phenotypic traits showing coincident signals. Modern bread wheat originated in the Fertile Crescent some 10,000 ybp and the variation observed in the genepool today has been shaped during domestication by human migration, anthropogenic selection and latterly by breeding. Associations identified between diversity and both known and novel genes influencing plant height and flowering time demonstrate the potential value of our panel for both fundamental and applied studies. Importantly, the hallmarks of adaptation to new environments remain highly topical research subjects during a period of accelerated climate change and both our selective sweep analyses and GWAS highlight targets for future gene and/or allele discovery. The combined data and germplasm collection we report here and made available to the broader research community represents a rich source of genetic diversity that should find application in understanding and improving diverse traits, from environmental adaptation to disease resistance and nutrient use efficiency.METHODS -Methods, including statements of data availability and any associated genotype codes and references, are available in the online version of the paper.
ACKNOWLEDGEMENTS -The authors wish to thank the INRA- Biological Resources Center on small grain cereal (https://www6.ara.inra.fr/umr1095_eng/Teams/Research/Biological-Resources-Centre) for providing seeds and passport data, and for establishing wheat biorepository. The authors thank the Federal ex situ Genbank Gatersleben, Germany (IPK), the N. I. Vavilov All-Russian Research Institute of Plant Industry, Russia (VIR), Centre for Genetic Resources, WUR, Netherlands (CGN), Kyoto University - National Bioresource Project, Japan (NBRP), the Australian Winter Cereal Collection Tamworth, Australia (AWCC), the National Plant Germplasm System, USA (USDA-ARS), the International Center for Agriculture Research in the Dry Areas (ICARDA), the Max Planck Institute for Plant Breeding Research Cologne, Germany (MPIPZ), the John Innes Centre, UK (JIC) and the WHEALBI consortium for providing plant material and passport data.
AUTHOR CONTRIBUTION -Panel constitution and distribution - François Balfourier, Benjamin Kilian, Nils
Stein. Exome sequencing - Darren Waite, Sarah Dyer, Joanne Russell, Robbie Waugh. Variant (SNPs, InDels)
calling - Michael Seidel, Manuel Spannagl, Georg Haberer. Variant (SNPs, InDels) analysis: Caroline Pont,
David Armisen, Nadia Goué, Michael Seidel, Daniel Lang. Phylogenetic analysis – Daniel Lang, Wandrille Duchemin, Michael Seidel, Caroline Pont, Nadia Goué, Georg Haberer. Diversity analysis & selection footprints
- Thibault Leroy, Caroline Pont, David Armisen. Field experiments and GWAS - Alessandro Tondelli, Daniela
Bustos-Korts, Caroline Pont, Hakan Özkan, Marta Molnar-Lang, Fred van Eeuwijk, Luigi Cattiveli. Conception,
supervision and preparation of the article - Beat Keller, Joanne Russell, Klaus F.X. Mayer, Robbie Waugh,
5
FUNDING -The research leading to these results has received funding from the European Community's Seventh Framework Programme (FP7/ 2007-2013) under the grant agreement n°FP7- 613556, Whealbi project (http://www.whealbi.eu/project/). RW and JR also acknowledge support from the Scottish Government Research Program and RW from the University of Dundee. HÖ acknowledges support from Çukurova University (FUA-2016-6033). KFXM acknowledges support from the German Federal Ministry of Food and Agriculture (2819103915) and the DFG (SFB924).
REFERENCES
(1) M. Feldman, A. A. Levy, Genome evolution due to allopolyploidization in wheat. Genetics. 192, 763-774 (2012). doi: 10.1534/genetics.112.146316.
(2) K. Tanno, G. Willcox, How fast was wild wheat domesticated? Science. 311, 1886 (2006). doi: 10.1126/science.1124635
(3) T. A. Brown, M. K. Jones, W. Powell, R. G. Allaby, The complex origins of domesticated crops in the Fertile Crescent. Trends Ecol Evol. 24, 103-109 (2009). doi: 10.1016/j.tree.2008.09.008.
(4) J. P. Bocquet-Appel, S. Naji, M. Vander Linden, J. K. Kozlowski, Detection of diffusion and contact zones of early farming in Europe from the space-time distribution of 14C dates. J. Archaeol. Sci. 36, 807–820 (2009). doi: 10.1016/j.jas.2008.11.004.
(5) A. Szécsényi-Nagy, G. Brandt, V. Keerl, J. Jakucs, W. Haak, Tracing the genetic origin of Europe's first farmers reveals insights into their social organization. P. Roy. Soc. B. Biol. Sci. 282, (2015). doi: 10.1098/rspb.2015.0339. (6) A. B. Damania, J. Valkoun, G. Willcox, C. O. Qualset, The origin of agriculture and crop domestication. (Proceedings of the Harlan symposium, 10-14 May 1997), [first edition]. International Center for Agricultural
Research in the Dry Areas, Aleppo, Syria. 345pp.
(7) A. Warr, C. Robert, D. Hume, A. Archibald, N. Deeb, M Watson. Exome Sequencing: Current and Future Perspectives. G3 (Bethesda). 5(8), 1543-50 (2015). doi: 10.1534/g3.115.018564.
(8) The International Wheat Genome Sequencing Consortium (IWGSC) Shifting the limits in wheat research and breeding using a fully annotated reference genome. Science. (2018). doi: 10.1126/science.aar7191.
(9) T.A. Brown, M.K. Jones, W. Powell, R.G. Allaby, The complex origins of domesticated crops in the Fertile Crescent. Trends Ecol Evol. 24(2), 103-9 (2009). doi: 10.1016/j.tree.2008.09.008.
(10) Y. Matsuoka, Evolution of polyploid triticum wheats under cultivation: the role of domestication, natural hybridization and allopolyploid speciation in their diversification. Plant Cell Physiol. 52(5), 750-64 (2011). doi: 10.1093/pcp/pcr018.
(11) L. Gao, G. Zhao, D. Huang, J. Jia, Candidate loci involved in domestication and improvement detected by a published 90K wheat SNP array. Sci Rep. 7, 44530 (2017). doi: 10.1038/srep44530.
(12) S.I. Wright, I.V. Bi, S.G. Schroeder, M. Yamasaki, J.F. Doebley, M.D. McMullen, B.S. Gaut, The effects of artificial selection on the maize genome. Science. 308(5726):1310-4 (2005). doi: 10.1126/science.1107891. (13) K. Luu, E. Bazin, M.G. Blum. pcadapt: an R package to perform genome scans for selection based on principal component analysis. Mol Ecol Resour. 17(1), 67-77 (2017). doi: 10.1111/1755-0998.
(14) K. W. Jordan, S. Wang, Y. Lun, L. J. Gardiner, R. MacLachlan, A haplotype map of allohexaploid wheat reveals distinct patterns of selection on homoeologous genomes. Genome Biol.16 (2015). doi: 10.1186/s13059-015-0606-4.
(15) C.R. Cavanagh, S. Chao, S. Wang, B.E. Huang, S. Stephen, S. Kiani, K. Forrest, C. Saintenac, G.L. Brown-Guedira, A. Akhunova, D. See, G. Bai, M. Pumphrey, L. Tomar, D. Wong, S. Kong, M. Reynolds, M.L. da Silva, H. Bockelman, L. Talbert, J.A. Anderson, S. Dreisigacker, S. Baenziger, A. Carter, V. Korzun, P.L. Morrell, J. Dubcovsky, M.K. Morell, M.E. Sorrells, M.J. Hayden, E. Akhunov, Genome-wide comparative diversity uncovers multiple targets of selection for improvement in hexaploid wheat landraces and cultivars. Proc Natl Acad Sci U S
A. 110(20), 8057-62 (2013). doi: 10.1073/pnas.1217133110.
(16) R. Joukhadar, H.D. Daetwyler, U.K. Bansal, A.R. Gendall, M.J. Hayden, Genetic Diversity, Population Structure and Ancestral Origin of Australian Wheat. Front Plant Sci. 8, 2115 (2017). doi: 10.3389/fpls.2017.02115.
(17) N.H. Nielsen, G. Backes, J. Stougaard, S.U. Andersen, A. Jahoor, Genetic diversity and population structure analysis of European hexaploid bread wheat (Triticum aestivum L.) varieties. PLoS One. 9(4), e94000 (2014). doi: 10.1371/journal.pone.0094000.
(18) K. M. Devos, J. Dubcovsky, J. Dvorak, C. N. Chinoy, M. D. Gale, Structural evolution of wheat chromosomes 4A, 5A, and 7B and its impact on recombination. Theor. Appl. Genet. 91, 282–288 (1995). doi: 10.1007/BF00220890
(19) A. Nadolska-Orczyk, I.K. Rajchel, W. Orczyk, S. Gasparis, Major genes determining yield-related traits in wheat and barley.Theor Appl Genet. 130(6):1081-1098 (2017). doi: 10.1007/s00122-017-2880-x
6
(20) L.J. Gardiner, R. Joynson, J. Omony, R. Rusholme-Pilcher, L. Olohan, D. Lang, C. Bai, M. Hawkesford, D. Salt, M. Spannagl, K.F.X. Mayer, J. Kenny, M. Bevan, N. Hall, A. Hall, Hidden variation in polyploid wheat drives local adaptation. Genome Res. 28(9):1319-1332 (2018). doi: 10.1101/gr.233551
(21) H.E. Lischer, L. Excoffier, G. Heckel, Ignoring heterozygous sites biases phylogenomic estimates of divergence times: implications for the evolutionary history of microtus voles. Mol Biol Evol. 31(4):817-31 (2014). doi: 10.1093/molbev/mst271.
(22) L.T. Nguyen, H.A. Schmidt, A. von Haeseler, B.Q. Minh, IQ-TREE: A Fast and Effective Stochastic Algorithm for Estimating Maximum-Likelihood Phylogenies. Mol Biol Evol. 32(1), 268-74 (2015). doi: 10.1093/molbev/msu300.
(23) S.H. Martin, J.W. Davey, C.D. Jiggins, Evaluating the use of ABBA-BABA statistics to locate introgressed loci. Mol Biol Evol. 32(1):244-57. doi: 10.1093/molbev/msu269.
(24) R. Ben-David, Z. Peleg, W. Xie, A. Dinoor, A.B. Korol, T. Fahima, Dissection of powdery mildew resistance uncovers different resistance types in the T. turgidum L. gene pool. 2008, 11 th Int. wheat genetics symposium. (25) M. El Baidouri, F. Murat, M. Veyssiere, M. Molinier, R. Flores, Reconciling the evolutionary origin of bread wheat (Triticum aestivum). New Phytol. 213, 1477-1486 (2017). doi: 10.1111/nph.14113.
(26) A.F. Balint, G. Kovacs, J. Sutka, Origin and taxonomy of wheat in the light of recent research. Acta
Agronomica Hungarica, 48(3), 301–313 (2000).
(27) M. Nesbitt, D. Samuel, From Staple Crop to Extinction. The Archaeology and History of the Hulled Wheats.
Proceedings of the first international workshop on hulled wheats 21, 41-100 (1996).
(28) P. Civáň, Z. Ivaničová, T.A. Brown, Reticulated origin of domesticated emmer wheat supports a dynamic model for the emergence of agriculture in the fertile crescent. PLoS One. 8(11), e81955 (2013). doi: 10.1371/journal.pone.0081955.
(29) M. C. Luo, Z. L. Yang, F. M. You, T. Kawahara, J. G. Waines, The structure of wild and domesticated emmer wheat populations, gene flow between them, and the site of emmer domestication. Theor. Appl. Genet. 114 947-959 (2007). doi: 10.1007/s00122-006-0474-0.
(30) Y. Matsuoka, S. Nasuda, Durum wheat as a candidate for the unknown female progenitor of bread wheat: an empirical study with a highly fertile F1 hybrid with Aegilops tauschii Coss. Theor Appl Genet. 109(8), 1710-7 (2004). Epub 2004 Sep 22
(31) J. Wang, M. C. Luo, Z. Chen, F. M. You, Y. Wei, Aegilops tauschii single nucleotide polymorphisms shed light on the origins of wheat D-genome genetic diversity and pinpoint the geographic origin of hexaploid wheat.
7
Figure 1: Wheat genome diversity map. Genome heat maps illustrating (from outer to inner circles) the density
in genes (), SNPs (), InDels (), genome scan for improvement among European genotypes (), reduction of diversity during the domestication between wild tetraploids vs domesticated hexaploids for subgenomes A and B and between wild diploids vs domesticated hexaploids for subgenome D (), as well as GWAS for heading date (HD, ), plant height (PH, ) on the 21 chromosomes (from 1A to 7D) illustrated in circles, with the three subgenomes (A, B and D). Homoeologous genes are joined with colored lines between chromosomes in the center (). The three outer circles show centromeres (grey blocks) and telomeres (blue blocks).
8
Figure 2: Geographical components of the panel structure. A- Phylogenetic tree of the hexaploid bread wheat
genotypes with a color code (right) in pie charts illuminating their geographical origins (see the associated map in panel B), historical groups (I to IV) and growth habit (winter, spring, alternative, and facultative) for each of the 11 major tree clades. B- Phylogenetic relationships between geographical origins (see color legend in panel A) are shown with colored connecting lines illustrating tree edges corresponding to a mean of at least 1 transition per simulation and illuminating the known historical routes of wheat migration, out of the Fertile Crescent (green connecting lines), west through inland () and coastal () paths, and north-east () and along the Inner Asian Mountain Corridor () followed by further colonization (black connecting lines) of American (), African (), Oceanian () territories. A B
9
Figure 3: Temporal evolution of wheat diversity. A- Nucleotide diversity (y-axis) from the hexaploid wheat
genotypes (x-axis) between subgenomes (A, B and D) and historical groups (landraces, old cultivars, cultivars and modern varieties) covering the last centuries of breeding (cf timescale legend in the white box). B- Chromosomal distribution of nucleotide diversity between landraces (group I) and modern wheats (group IV, dots) with bars illustrating the range of variation in diversity between these two groups (colored in red for ROD≥80%). Large regions of reduced diversity are shown in grey boxes.
A B Tajima’s π Group IV ROD >= 0.8 Subgenome A, B and D (ROD < 0.8)
10
Figure 4: Model of reticulated evolution. A- Clustered phylogenetic consensus genotype network of 1000
maximum likelihood tree topologies inferred from repeated random haplotype samples (RRHS). Nodes represent individual genotypes and are color-coded by taxon. Node size is proportional to the number of connections (i.e. node degree). Edges represent minimal evolutionary distances in the RRHS trees deduced by the minimal spanning tree (MST) algorithm and are color-coded by the respective subgenome (green: A; purple: B; orange: D). Edge transparency is proportional to the relative number of RRHS trees were the edge was an MST edge (i.e. edge weight). B- Hexaploid bread wheat evolutionary scenario based on the stronger edges of the subgenomes phylogenetic networks (extracted using a minimum spanning tree available in Figure S11) with green, purple and yellow brown columns illustrating respectively the path from the A, B and D subgenomes with the species-centered color-code used in panel A. Arrow colors illustrate the phylogenetic relatedness between subgenomes (plain arrows are indicative of the main, vertical signal; and dashed arrows show alternative path well supported by the inferred topologies and indicative of introgression or gene flow). Circles illuminate putative extinct ancestor intermediates. Additional Sitopsis species (white framed grey boxes) were not part of this study, but are included for completeness.
A
11
ONLINE METHODS
Plant material - The wheat panel consists of 487 genotypes comprising 13 diploid, 38 (including 25 AABB)
tetraploid and 436 (including 435 AABBDD) hexaploid genotypes including landraces, cultivars and currently grown varieties from 68 countries. For a detailed description of all lines/varieties used in this study see Table S1
and passport information available at
https://urgi.versailles.inra.fr/download/iwgsc/IWGSC_RefSeq_Annotations/v1.0/iwgsc_refseqv1.0_Whealbi_G WAS.zip. The genotypes were structured into four historical groups: landraces (group I, <1935), old cultivars (group II from 1936 to 1965), cultivars (group III, from 1966 to 1985) and modern varieties (group IV, >1986). The genotypes have been grouped according to their country of origins with Tk: Turkmenia; Af: Afghanistan; Ar: Armenia; Az: Azerbaijan; Ch: China; Ko: Korea; In: India; Ir: Iran; Is: Israel; Ja: Japan; Le: Lebanon; Ne: Nepal; Pa: Pakistan; Sy: Syria; Ta: Tajikistan; Tu: Turkey; Ru: Russia; Au: Australia; Nz: New Zealand; Al: Albania; As: Austria; Be: Belgium; Bu: Bulgaria; Cr: Croatia; Cz: Czech republic; Dn: Denmark; Fi: Finland; Fr: France; Go: Georgia; Ge: Germany; Gr: Greece; Hu: Hungary; It: Italy; La: Latvia; Po: Poland; Pr: Portugal; Ro: Romania; Sp: Spain; Sw: Sweden; Sz: Switzerland; Nt: Netherlands; Ur: Ukraine; Uk: United Kingdom; Fyrm: Former Yugoslav Republic of Macedonia; Al: Algeria; Eg: Egypt; Et: Ethiopia; Ke: Kenia; Mo: Morocco; Ni: Niger; Sa: South Africa; Tn: Tunisia; Zi: Zimbabwe; Ag: Argentina; Br: Brazil; Ca: Canada; Co: Colombia; Me: Mexico; Ur: Uruguay; Usa: United States of America. The genotypes have been finally grouped according to their region/continent of origins with Fertile Crescent (Ir, Is, Le, Sy, Tu), Central Asia (Af, Ar, Az, Go, Pa, Ta, Tk), Eastern Asia (Ch, Ja, Ko), Northern Asia (Ru), Central Europe (Al, Bu, Cr, Cz, Fi, Hu, La, Po, Ro, Ur, Fyrm), Southern Europe (Gr, It, Pr, Sp), Western Europe (As, Be, Dn, Fr, Ge, Sw, Sz, Nt, Uk), Indian Peninsula (In, Ne), Northern Africa (Al, Eg, Mo, Tn), Sub-Saharan Africa (Et, Ke, Ni, Sa, Zi), South America (Ag, Br, Co, Ur), North America (Ca, Me, Usa), Oceania (Au, Nz).
Exome sequencing - As the large wheat genome consists of >80% mobile and repeated elements, whole-genome
resequencing is a cost-intensive and likely highly error-prone approach to comprehensively catalogue genetic diversity. To circumvent this limitation, we used a wheat exome-based target enrichment sequencing assay to capture variation in and around the gene-containing regions of 487 wheat genotypes. We selected Roche’s Nimblegen SeqCap EZ wheat exome design (120426_Wheat_WEC_D02), https://sequencing.roche.com/en/products-solutions/by-category/target-enrichment/shareddesigns.html. This is a design comprising 106.9Mb of low copy regions of the wheat genome developed by the Wheat Exome consortium7,14. To optimize the cost, we used a multiplex of six individually barcoded accession DNAs, combined prior to capture. Captured DNA were sequenced as paired ends (2x125bp) on Illumina HiSeq instruments using HiSeq2500 high output mode. Genomic DNA (gDNA) samples were checked using the PerkinElmer DropSense in order to verify gDNA integrity. Samples were quantified by Picogreen assay and normalized to 20 ng/ul in 10 nM Tris-Hcl (pH 8.0) as suggested in the NimbleGen SeCap EZ Library SR protocol. The gDNA was fragmented at the mean fragment size of 350 bp and whole genome libraries were prepared according to the Kapa Library Preparation protocol and quantified by Nanodrop. Six libraries were pooled and used for the hybridization with the SeqCap Ez oligo pool (Design Name: 120426_Wheat_WEC_D02) in a thermocycler at 47°C for 72 h. Capture beads were used to pull down the complex of capture oligos and genomic DNA fragments and unbound fragments were removed by washing. Enriched fragments were amplified by PCR and the final library was quantified by qPCR and visualized by Agilent Bioanalyser. Sequencing libraries were normalized to 2nM, NaOH denatured and used for cluster amplification on the cBot. The clustered flow cells were sequenced on Illumina HiSeq2500 high output mode with a 6-plex strategy (i.e. 6 samples per HiSeq lane) with a 125 bp paired-end run module. Exome capture (Nimblegen) and next generation sequencing (Illumina) delivered on average 34 million read pairs per genotype.
Variant (SNPs, InDels) calling – Raw reads were mapped to the hexaploid Chinese Spring reference sequence
v1.0 using the 'mem' subcommand of BWA (version 0.7.12, http://bio-bwa.sourceforge.net/). Samtools (version 1.3, http://samtools.sourceforge.net/; http://www.htslib.org/) was used to mark duplicate reads. Variants were called using samtools/bcftools (version 1.3) and filtered for overlap to exonic regions (+/- 1 Kbp) based on the current IWGSC genome annotation v1.0. Genotypes were subsequently filtered for a minimum sequencing depth (DP) of 3 and a genotype quality (GQ) of at least 10. Two sets of genotype calls from experiments with Axiom 35k and iSelect 80k SNP arrays (details from CerealsDB, http://www.cerealsdb.uk.net/) with a total of 38 genotypes in common between either of those sets and the exome capture were used to approximate optimal filter criteria leading to the lowest false discovery rate (FDR). Variant positions were removed if the total count of samples with defined genotype (e.g. not missing) was below 10 or the minor allele frequency was below 1% to derive the initial set of variants. This set was further subjected to imputation using beagle (default parameters) and the output was again analyzed for false discovery rate by comparison to iSelect genotype information. Based on this evaluation, the optimal trade-off between FDR, number of variants and missing values was considered to be 0.6 for genotype probability (GP, estimated by beagle) and 4% minor allele frequency (MAF, after imputation) and the final imputed variant dataset was generated applying these criteria. We detected 620,158 small-scale
12
variant positions on to the IWGSC Refseqv1.0 wheat genome assembly (targeting 41,032 of the 110,790 high confidence HC genes). The variants comprised 56,163 Indels (9%) and 563,995 SNPs (91%). 595,939 of the variants (96%) were found in the 435 AABBDD hexaploid genotypes (Table S2).
Phylogenetic analysis - Hexaploids phylogeny- The analysis of phylogeny for the 435 hexaploid bread wheat was
inferred on an alignment of 91,554 SNPs (for a total of 65,467 distinct alignment patterns) found on triplets (2,855) of orthologous genes conserved in all three subgenomes A, B and D. The data was analyzed with iqtreeX20 (GTR+GAMMA(4) model), with 1,000 ultrafast bootstraps32. Geographical regions for ancestral nodes were reconstructed using the following protocol: 10,000 simulations were performed using the stochastic mapping algorithm of the R phytools package33 (using the equal rates model), the region of a node was then chosen as the one with maximum sampled frequency. Eleven major tree clades were identified based on criterion of size, representativeness and statistical support to offer a good coverage of the tree, while taking into account sampling
bias for European individuals. Di-Tetra-Hexaploids phylogeny- To account for ambiguities and possible biases in
phylogenetic inference from SNP data arising from varying levels of heterozygosity, linkage disequilibrium (LD), incomplete lineage sorting and reticulate evolution, we implemented a network-based approach to reconstruct the species history and community structure in the sampled Triticeae genotypes. To this end, we stringently filtered biallelic, polymorphic SNPs present in >90% of the genotypes from non-imputed data accounting for LD (delivering 15,490 filtered SNPs) and implemented a repeated random haplotype sampling procedure including heterozygous sites (RRHS21) to infer 1,000 maximum likelihood tree topologies with the ASC_GTRGAMMA model and JC69 distances in RAxML (asc-corr=felsenstein). While these RRHS trees were analyzed also in the form of conventional consensus topologies and densitree visualizations, to infer taxonomic clades, we analyzed the evolutionary distances among the tips of the 1,000 trees using the minimum spanning tree (MST) algorithm in Python. The MST graphs were subsequently combined into a weighted, phylogenetic consensus network whose nodes were clustered into clades using the Newman-Girvan Edge-Betweenness algorithm in Cytoscape 3.634. The clustered network topology was plotted considering edge-betweeness in Cytoscape and taxonomic clades were inferred by intersection of community clusters with taxon information which was annotated using the AutoAnnotate plugin34. The relative number of RRHS trees where a respective edge was selected by the MST algorithm were used as edge weights and were interpreted similar to bootstrap support values in the consensus tree
topologies. The composition, geographical and historical origins of the identified wheat communities were
analyzed using χ2tests and barplots in R. Gene flow in subgenomes A and B was investigated with the Patterson's
D statistic (or ABBA-BABA statistic) using ANGSD35 with a threshold of Z statistic > 436. An integrative model (Figure 4B) of wheat evolution was built by manual consolidation of the support values of the edges in the phylogenetic consensus network (Figure S10 and table S7), the various consensus and IUPAC tree topologies (Figure S11), the ABBA-BABBA results (Figure S12) as well as the literature. Where species relationships remained ambiguous on the sole basis of the network approach, i.e. when similar phylogenetic relatedness between
groups of genotypes defines several possible evolutionary paths between putative progenitors and descendants, we
then consideredthe results of the ABBA-BABA statistical test (Figure S12 as well as Table S6), and the existing
literature when available.The Figure 4B only reports the reticulation events identified on the basis of phylogenetic consensus networks supported by the ABBA-BABA analysis in both the A and B subgenomes.
Diversity analysis & selection footprints – Improvement- Genome scans for selection among the hexaploid
samples were performed under PCAdapt13, an individual-based method of genome scan able to handle massive NGS data. Given that PCAdapt is based on principal components, this method does not require any partitioning of the dataset in different groups and can therefore be applied on continuous pattern of population structure. This method is therefore conceptually robust to any source of errors associated with the boundaries of these groups and can take into account the gradual variation among all individuals of the improvement continuum (i.e. time series-like data). For each dataset, selection of the best number of principal components (K) was performed after a first assessment of the percentage of variance explained by 20 principal components. Analyses were performed assuming K=4 for the whole dataset and K=3 for both European and Asian datasets. Computations were run under R version 3.4.3. Candidate genes for improvement are either associated with highly significant p-values or considered in close vicinity (0 to 5 Mb) to loci with domestication signatures (Table S3). Tajima’s π and D was computed over 1 Mb non-overlapping sliding windows using seq-stat on European genotypes to take into account the strong signal of intercontinental genetic signatures. To perform this analysis, we took into account the number of sites covered by reads aligned to the reference. All sites with a total depth of coverage greater than 1,461 (i.e. at least 3 reads per individual on average) were considered as covered. A ROD (reduction of diversity) index was then estimated for each 1 Mb window by comparing diversity of each group (II, III or IV) to “Landraces” (Group I) as following: 1 – (π Group / π Landraces). To further explore population structure, principal Component Analysis (PCA) was performed with the R package FactoMineR37. Signatures of improvement were detected for loci associated with a pvalue < 0.0001, i.e. a -log10-transformed p-value >4. Domestication- Similarly, domestication
signatures were identified using differences in Tajima’s π between diploid, tetraploid and hexaploid genotypes by computing the ROD index over 1Mb windows. Signatures of domestication were detected for regions associated with ROD >0.8. Candidate genes for domestication were considered in close vicinity (0 to 5 Mb) to loci with
13
domestication signature (Table S3). Visualization were performed with R38 packages such as graphics, stats, circlize and edextend39-42. To further explore population structure, principal Component Analysis (PCA) was performed with the R package FactoMineR43.
Field experiments and GWAS - These analyses focused on 435 hexaploid wheat genotypes evaluated for heading
date and plant height in four common garden experiments in France (INRA, Clermont-Ferrand), Hungary (ATK, Martonvasar), Turkey (University of Çukurova, Adana) and United Kingdom (KWS, Cambridge). Trials were grown under an augmented partially-replicated design with 20% of the genotypes replicated twice and two check cultivars assigned uniformly to eight plots. Raw data were corrected for spatial heterogeneity using replicated controls and the SpATS package in R44. After filtering out SNPs with Call Rate <0.80 and Minor Allele Frequency (MAF) <0.05, a final set of 390,657 SNPs were used for subsequent analysis. Finally, circular genome maps were drawn under the R package circlize45. A chromosome-specific kinship matrix was calculated using 1,000 SNPs sampled at random from each chromosome. In this chromosome-specific kinship, 𝐴𝐴𝐵, is the realized additive genetic relationship matrix calculated from all molecular markers along the whole genome, except those in the chromosome being tested46. For example, to test SNPs in chromosome 1A, 𝐴𝐴𝐵 was calculated with SNPs sampled from all chromosomes, except those from 1A. 𝐴𝐴𝐵 was calculated following the equation proposed by Astle and Balding47, with as typical entry for the relationship between genotypes i and j:
𝐴𝑖𝑗𝐴𝐵 =𝐾1∑
(𝑥𝑖𝑘−2𝑝𝑘)(𝑥𝑗𝑘−2𝑝𝑘)
2𝑝𝑘(1−𝑝𝑘)
𝐾
𝑘=1 (1)
where 𝑥𝑖𝑘 is a marker score indicating the allele count for the minor frequency allele (2, 1, 0) for genotype i at marker k, and 𝑝𝑘 is the corresponding allele frequency. The matrix above was calculated using the “realizedAB” option in the “kin” function of the Synbreed package48.
A multi-environment mixed model GWAS analysis was performed analogous to the method described by Millet et al.49 and Thoen et al.50. Correction for population structure and kinship was done on the basis of eigen vectors (“principal components”) extracted from the chromosome specific Astle and Balding kinship matrices, 𝐴𝐴𝐵. The number of significant principal components was calculated following Patterson51. We scanned the genome with the following single locus model:
𝑦𝑖𝑗= 𝜇 + 𝐸𝑗+ ∑𝑃𝑝=1(𝑥𝑖𝑝𝑃𝐶 𝛽𝑝𝐺) + 𝐺𝑖+ ∑𝑝=1𝑃 (𝑥𝑖𝑝𝑃𝐶 𝛽𝑗𝑝𝐺𝐸) + 𝑥𝑖𝑆𝑁𝑃𝛽𝑗𝑆𝑁𝑃+ 𝐺𝐸𝑖𝑗+ 𝜀𝑖𝑗 (2)
In Equation (2), 𝜇 is an intercept term, 𝐸𝑗 the fixed environmental main effect 𝑥𝑖𝑝𝑃𝐶 stands for the genotype specific scores on the p-th kinship principal component, with p=1...P, and 𝛽𝑝𝐺 and 𝛽𝑗𝑝𝐺𝐸 are the corresponding fixed regression coefficients for these principal components correcting for population structure with respect to the genotype main effect and the GxE interaction, respectively. 𝛽𝑗𝑆𝑁𝑃 is a term for the fixed SNP effect, while 𝑥𝑖𝑆𝑁𝑃 contains the marker information. This means that fitted QTLs are allowed to have an environment specific effect, or, that at each marker position, QTLs model main effect and a QTLxE term simultaneously. The test for 𝛽𝑗𝑆𝑁𝑃 being zero in all environments or being non zero in at least one environment was a Wald test52,53. 𝐺
𝑖 is a random genotypic main effect, 𝐺𝐸𝑖𝑗 is a random genotype by environment interaction. The random terms for 𝐺𝑖 and 𝐺𝐸𝑖𝑗 have variances 𝑉𝐺 and 𝑉𝐺𝐸, that were restricted to be positive. The error term 𝜀𝑖𝑗 is environment-specific and was confounded with the 𝐺𝐸𝑖𝑗 term. The model was fitted in ASREML-R (VSN-International, 2016). Genomic control was applied a posteriori to correct for inflation54.
The genome-wide significance threshold with multiple testing correction was calculated following the method proposed55. For each chromosome, the correlation matrix for the SNPs was calculated. Then, the effective number of independent tests per chromosome was estimated from the eigenvalues of the correlation matrix. The effective number of independent tests was summed across chromosomes (𝑀𝑒𝑓𝑓) and the significance threshold for individual markers was calculated as 𝛼𝑝= 1 − (1 − 𝛼𝑒)1/𝑀𝑒𝑓𝑓, where the genome wide test level was 𝛼𝑒= 0.05.
Data availability. All data analyzed and generated during this study are included in this published article and its
supplementary information files (6 tables and 13 figures) and are available online at https://urgi.versailles.inra.fr/download/iwgsc/IWGSC_RefSeq_Annotations/v1.0/iwgsc_refseqv1.0_Whealbi_G WAS.zip (Catalog of imputed and non-imputed variants as vcf file and passport information for the 487 genotypes as .xls file). The Whealbi SNPs data can be displayed in open access on the IWGSC reference genome browser56 at https://urgi.versailles.inra.fr/jbrowseiwgsc/gmod_jbrowse/?data=myData%2FIWGSC_RefSeq_v1.0.
Software. Relevant source codes, workflow and analysis septs used to conduct the results presented in the different section of the MS (structural variant detection, phylogenetic analysis, selective sweeps characterization, GWAS
investigation), were deposited in a public github repository and are made available at
https://github.com/dandaman/whealbiCode:
14
-Code and data for the permutation tests to test the grouping of three character: continent of origin, growth habit, and historical group (Figure S4).
-Seqstat code source used for selection footprint analysis are available at
https://figshare.com/s/122efbec2e3632188674#/articles/7484705 (Figure 3, Figures S6-S7).
- Source code, documentation and results in form of Python and R Jupyter Notebooks and Snakemake workflows to perform RRHS, phylogenetic inference using the RRHS and IUPAC alignments as well as calculation and analysis of the MST-weighted phylogenetic consensus network (Figure 4A, Figure S10-S13).
(32) B.Q. Minh, M.A. Nguyen, A. von Haeseler, Ultrafast Approximation for Phylogenetic Bootstrap. Mol Biol
Evol. 30(5):1188-95 (2013). doi: 10.1093/molbev/mst024.
(33) L.J. Revell, phytools: an R package for phylogenetic comparative biology (and other things). Methods Ecol.
Evol., 3, 217-223 (2012). doi.org/10.1111/j.2041-210X.2011.00169.x
(34) M. Kucera, R. Isserlin, A. Arkhangorodsky, G.D. Bader, AutoAnnotate: A Cytoscape app for summarizing networks with semantic annotations. F1000Res. 5, 1717 (2016). eCollection 2016.
(35) Thorfinn Sand Korneliussen, Anders Albrechtsen and Rasmus Nielsen. ANGSD: Analysis of Next Generation Sequencing Data. BMC Bioinformatics 15:356 (2014) doi.org/10.1186/s12859-014-0356-4
(36) E.Y. Durand, N. Patterson, D. Reich, M. Slatkin, Testing for ancient admixture between closely related populations. Mol Biol Evol. 28(8):2239-52 (2011). doi: 10.1093/molbev/msr048.
(37) S. Lê, J. Josse, F. Husson, FactoMineR: An R Package for Multivariate Analysis. Journal of Statistical Software, 25(1):1-18 (2008). 10.18637/jss.v025.i01
(38) R Core Team (2014) R: A language and environment for statistical computing. R Foundation for Statistical Computing, Vienna, Austria URL http://www.R-project.org
(39) H. Chipman, R. Tibshirani, Hybrid hierarchical clustering with applications to microarray data. Biostatistics.
7, 286–301 (2006). doi: 10.1093/biostatistics/kxj007
(40) S. Schmidtlein, L. Tichy, F. Hannes, F. Ulrike, A brute-force approach to vegetation classification. J. Veg.
Sci. 21, 1162–1171 (2010). doi: 10.1111/j.1654-1103.2010.01221.x
(41) D.M. Witten, R. Tibshirani, A framework for feature selection in clustering. J. Am. Stat. Assoc. 105, 713–726 (2010). doi: 10.1198/jasa.2010.tm09415
(42) T. Galili, dendextend: an R package for visualizing, adjusting and comparing trees of hierarchical clustering. Bioinformatics. 31(22), 3718-20 (2015). doi: 10.1093/bioinformatics/btv428
(43) S. Lê, J. Josse, F. Husson, FactoMineR: an R package for multivariate analysis. Journal of Statistical Software.
25, 1–18 (2008). doi: 10.18637/jss.v025.i01.
(44) M.X. Rodríguez-Álvarez, M.P. Boer, F.A. van Eeuwijk, P.H. Eilers, Correcting for spatial heterogeneity in plant breeding experiments with P-splines. Spatial Statistics. 23, 52-71 (2017). doi: 10.1016/j.spasta.2017.10.003 (45) Z. Gu, L. Gu, R. Eils, M. Schlesner, B. Brors, circlize Implements and enhances circular visualization in R.
Bioinformatics. 30(19), 2811-2 (2014). doi: 10.1093/bioinformatics/btu393.
(46) R. Rincent, L. Moreau, H. Monod, E. Kuhn, A.E. Melchinger, R.A. Malvar, J. Moreno-Gonzalez, S. Nicolas, D. Madur, V. Combes, F. Dumas, T. Altmann, D. Brunel, M. Ouzunova, P. Flament, P. Dubreuil, A. Charcosset, T. Mary-Huard, Recovering power in association mapping panels with variable levels of linkage disequilibrium.
Genetics. 197(1), 375-87 (2014). doi: 10.1534/genetics.113.159731.
(47) W. Astle, D.J. Balding, Population structure and cryptic relatedness in genetic association studies. Stat Sci.
24, 451–471 (2009). doi: 10.1214/09-STS307.
(48) V. Wimmer, T. Albrecht, H.J. Auinger, C.C. Schön, synbreed: a framework for the analysis of genomic prediction data using R. Bioinformatics. 28(15), 2086–2087 (2012). doi: 10.1093/bioinformatics/bts335.
(49) E.J. Millet, C. Welcker, W. Kruijer, S. Negro, A. Coupel-Ledru, S.D. Nicolas, J. Laborde, C. Bauland, S. Praud, N. Ranc, T. Presterl T, Genome-wide analysis of yield in Europe: allelic effects vary with drought and heat scenarios. Plant physiology. 172(2), 749-64 (2016). doi: 10.1104/pp.16.00621.
(50) M.P. Thoen, N.H. Davila Olivas, K.J. Kloth, S. Coolen, P.P. Huang, M.G. Aarts, J.A. Bac‐Molenaar, J. Bakker, H.J. Bouwmeester, C. Broekgaarden, J. Bucher, Genetic architecture of plant stress resistance: multi‐trait genome‐wide association mapping. New Phytologist. 213(3), 1346-62 (2017). doi: 10.1111/nph.14220.
(51) N. Patterson, A.L. Price, D. Reich D, Population Structure and Eigenanalysis. PLoS Genet. 2(12), e190 (2006). doi: 10.1371/journal.pgen.0020190.
(52) S.J. Welham, R. Thompson, Likelihood Ratio Tests for Fixed Model Terms using Residual Maximum Likelihood. J. R. Statist. Soc. 59(3), 701-714 (1997). doi: 10.1111/1467-9868.00092.
(53) M.P. Boer, D. Wright, L. Feng, D.W. Podlich, L. Luo, M. Cooper, F.A. van Eeuwijk, A mixed-model quantitative trait loci (QTL) analysis for multiple-environment trial data using environmental covariables for QTL-by-environment interactions, with an example in maize. Genetics. 177(3), 1801-13 (2007). Doi: 10.1534/genetics.107.071068.
(54) B. Devlin, K. Roeder K, Genomic control for association studies. Biometrics 55, 997–1004 (1999). Doi: 10.1111/j.0006-341X.1999.00997.x
15
(55) J. Li, L. Ji, Adjusting multiple testing in multilocus analyses using the eigenvalues of a correlation matrix.
Heredity (Edinb). 95(3), 221–227 (2005). doi:10.1038/sj.hdy.6800717.
(56) M. Alaux, J. Rogers, T. Letellier, R. Flores, F. Alfama, C. Pommier, N. Mohellibi, S. Durand, E. Kimmel, C. Michotey, C. Guerche, M. Loaec, M. Lainé, D. Steinbach, F. Choulet, H. Rimbert, P. Leroy, N. Guilhot, J. Salse, C. Feuillet; International Wheat Genome Sequencing Consortium, E. Paux, K. Eversole, A.F. Adam-Blondon, H. Quesneville, Linking the International Wheat Genome Sequencing Consortium bread wheat reference genome sequence to wheat genetic and phenomic data. Genome Biol. 19(1):111 (2018). doi: 10.1186/s13059-018-1491-4.
1
SUPPLEMENTARY ONLINE MATERIAL
TABLE OF CONTENT
SECTIONS
PAGES
Table S1: Wheat genotype panel.
2
Table S2: Wheat structural variants.
3
Table S3: Genes/loci with selection signatures.
4
Table S4: Genes/loci of GWAS for heading date (HD).
5
Table S5: Genes/loci of GWAS for plant height (PH).
7
Table S6: Inference of gene flow using Patterson's D.
9
Table S7: Edge support of the minimum spanning trees of the phylogenetic network.
11
Figure S1: Sequence coverage at the genome scale.
13
Figure S2: Chromosomal distribution of structural variants.
15
Figure S3: Distribution of structural (SNPs, InDels) variants.
16
Figure S4: Wheat genotypes relatedness and components of the panel structuration.
17
Figure S5: Geographical component of the panel structuration.
21
Figure S6: Selection (domestication) signatures.
22
Figure S7: Selection (breeding) signatures.
23
Figure S8: GWAS for heading date (HD).
34
Figure S9: GWAS for plant height (PH).
35
Figure S10: Inference of reticulated evolutionary scenario with phylogenetic networks.
36
Figure S11: Wheat phylogenetic relationships.
37
Figure S12: Inference of reticulated evolutionary scenario with ABBA-BABA test.
39
2
Table S1: Wheat genotype panel. The wheat diversity panel consisting of 487 genotypes is detailed in the current
table with the number of genotypes separated by ploidy level (di-, tetra- and hexaploid), the historical categories (landraces, old cultivars, cultivars and modern varieties for the 435 hexaploid genotypes) as well as the continents of origin (Africa, America, Asia, Europe and Oceania).
Africa America Asia Europe Oceania NA TOTAL
Ploidy levels Diploid 0 0 12 1 0 0 13 Tetraploid AB 1 1 18 5 0 0 25 Tetraploid AG 0 0 13 0 0 0 13 Hexaploid ABD 18 28 123 255 6 5 435 Hexaploid GAA 0 0 0 1 0 0 1 TOTAL 19 29 166 262 6 5 487 Hexaploids ABD Group I (Landraces) 5 5 52 31 2 0 95 Group II (Old cultivars) 5 12 24 56 2 0 99
Group III (Cultivars) 8 11 34 70 2 5 130
Group IV (Current
varieties) 0 0 7 92 0 0 99
NA 0 0 6 6 0 0 12
TOTAL 18 28 123 255 6 5
435
Note: Detailed passport information for the 487 genotypes are made available at
https://urgi.versailles.inra.fr/download/iwgsc/IWGSC_RefSeq_Annotations/v1.0/iwgsc_refseqv1.0_Whealbi_G WAS.zip
3
Table S2: Wheat structural variants. Exome sequencing of the 435 AABBDD hexaploid genotypes delivered
595,939 variants detailed in the current table with the number of variants (SNPs and InDels), the number of genic and non-genic variants and associated ratio (genic/non-genic) with the number of targeted genes per chromosomes.
Chr SNPs InDels Variants Genic variants Non-genic variants Ratio genic/non-genic Genes 1A 29526 3213 32739 17855 14884 1,20 2334 1B 37125 3719 40844 23640 17204 1,37 2476 1D 11451 1158 12609 8019 4590 1,75 984 2A 36398 3792 40190 23415 16775 1,40 2923 2B 52083 4959 57042 35326 21716 1,63 3184 2D 20377 1695 22072 15956 6116 2,61 1344 3A 27116 2964 30080 17350 12730 1,36 2280 3B 40405 4223 44628 25419 19209 1,32 2874 3D 10732 805 11537 7921 3616 2,19 867 4A 25807 2707 28514 16683 11831 1,41 2268 4B 18760 2063 20823 12141 8682 1,40 1840 4D 2133 208 2341 1407 934 1,51 408 5A 28917 3197 32114 17763 14351 1,24 2461 5B 37473 3875 41348 24626 16722 1,47 2716 5D 6557 668 7225 4866 2359 2,06 759 6A 29338 2914 32252 19854 12398 1,60 1991 6B 39341 3744 43085 24441 18644 1,31 2412 6D 8760 718 9478 6486 2992 2,17 757 7A 36616 3748 40364 22729 17635 1,29 2815 7B 33348 3296 36644 20792 15852 1,31 2331 7D 9203 807 10010 6603 3407 1,94 1008 Total 541466 54473 595939 353292 242647 1,46 41032 Chr = Chromosomes
SNPs = Single Nucleotide Polymorphism InDels = Insertions / Deletions
Note: Detailed information for the 595939 variants are made available at
https://urgi.versailles.inra.fr/download/iwgsc/IWGSC_RefSeq_Annotations/v1.0/iwgsc_refseqv1.0_Whealbi_G WAS.zip. ‘SNPs/InDels/Variants’ columns count include those associated with ‘NA’ high confidence annotation
(ANNHC==NA), ‘Genes’ column does not count genes with only ‘Upstream’ and ‘Downstream’ variants despite they might have an associated ANNHC. ‘Non-genic’ variants include both ‘Upstream’ and ‘Downstream’ variants as well as variants without associated ANNHC. In any case, a variant is only considered if we have at least a non-imputed REF and an ALT variant amongst the 435 genotypes.