HAL Id: hal-01425031
https://hal.archives-ouvertes.fr/hal-01425031
Submitted on 3 Jan 2017HAL is a multi-disciplinary open access archive for the deposit and dissemination of sci-entific research documents, whether they are pub-lished or not. The documents may come from teaching and research institutions in France or abroad, or from public or private research centers.
L’archive ouverte pluridisciplinaire HAL, est destinée au dépôt et à la diffusion de documents scientifiques de niveau recherche, publiés ou non, émanant des établissements d’enseignement et de recherche français ou étrangers, des laboratoires publics ou privés.
Contribution of cellulose to the moisture-dependent
elastic behaviour of wood
Tancrède Almeras, Arthur Gronvold, Arie van der Lee, Bruno Clair, Cédric
Montero
To cite this version:
Tancrède Almeras, Arthur Gronvold, Arie van der Lee, Bruno Clair, Cédric Montero. Contribution of cellulose to the moisture-dependent elastic behaviour of wood. Composites Science and Technology, Elsevier, 2017, 138, pp.151-160. �10.1016/j.compscitech.2016.11.025�. �hal-01425031�
Contribution of cellulose to the moisture-dependent elastic behaviour of
wood
Composites Science and Technology ALMERAS Tancrède1,*
GRONVOLD Arthur1 VAN DER LEE Arie2 CLAIR Bruno1,3 MONTERO Cédric1
1: LMGC, Univ. Montpellier, CNRS, Montpellier, France 2: IEM, Univ. Montpellier, CNRS, ENSCM, Montpellier, France
3: CNRS, UMR Ecologie de Forêts de Guyane (EcoFoG), AgroParisTech, Cirad, INRA, Université des Antilles, Université de Guyane, Kourou, France
* Author for correspondence
Abstract
Wood has a hierarchical structure involving several levels of organisation. The
stiffness of wood relies on its capacity to transfer mechanical stress to its stiffest
element at the lowest scale, namely crystalline cellulose. This study aims at
quantifying to what extend crystalline cellulose contributes to wood stiffness
depending on its moisture content. The crystal strains of cellulose were
measured using X-ray diffraction on wet and dry specimens of spruce, based on
a previously published methodology. The comparison between crystal strain
and macroscopic strain shows that, during elastic loading, cellulose strain is
lower than macroscopic strain. The means ratio of crystal/macroscopic strain
amounts 0.85 for dry specimens and 0.64 for wet specimens. This strain ratio
cannot be explained just by the projection effect due to the difference in
orientation between cellulose microfibrils and cell wall, but results from
deformation mechanisms in series with cellulose. Analysis shows that this series
contribution represents a non-negligible contribution to wood compliance and
is strongly moisture-dependent. This contribution amounts 9% for dry
specimens and 33% for wet specimens, corresponding to a 4-fold increase in
compliance for the series contribution. The origin of these strains is ascribed to
mechanisms involving bending or shear strain at different scales, due to the fact
that reinforcing element are neither perfectly straight nor infinitely long.
keywords
wood; cellulose; X-ray diffraction; micromechanics; crystal strain
1
5
10
15
20
25
30
35
40
Introduction
Wood has a hierarchical structure, with several levels of organisation. Wood tissue at the sub-millimetric scale is made of different kinds of cells, namely fibres (or tracheids) and rays, and sometimes vessels and axial parenchyma. Among these cells, fibres are from far the most abundant and stiff. Fibres are long hollow cells, with cell walls glued to adjacent cell walls, that form a honeycomb structure. The cell wall is made of several concentric layers, and forms a multilayer structure. Each wall layer is a fibre composite layout where the matrix phase is a mixture of lignin and hemicellulose, and the fibres (called microfibrils) are made of cellulose. The cellulose microfibrils are arranged helically in the cell, with a characteristic angle for each layer, termed microfibrils angle. Cellulose is present in a partly crystalline form, where amorphous cellulose is organised in serie and in parallel with cellulose crystallites. Crystalline cellulose is from far the stiffest constituent of wood. Its extraordinary large stiffness (approx. 135 GPa [1-3] ) provides the good properties of wood in the axial direction.
The mechanical behaviour of wood depends on the organisation of the material at all levels. The link between structure and properties is therefore the key to predict the variability of the wood material and understand its origin. Structure and properties can be linked through multiscale modelling. The principle of this modelling is using hierarchical models, where each model predicts the behaviour at one scale, based on the structure and behaviour at lower scales. Such schemes have been developed for wood to model different kinds of behaviour, such as drying shrinkage, elastic and viscoelastic behaviours [4; 5]. Another key element of the models is the assumption used for the kinematics of elements, i.e. how they deform relatively to each other. Most of the time, these assumptions are based on an idealization of wood structure [5] and are particularly difficult to assess.
In material science, different methods are used to evaluate the stress transfer between the fibre and the matrix phase in fibre-reinforced composites. These methods are based on the measurement of strain at the molecular scale, using Raman spectroscopy, infrared spectroscopy or X-ray diffraction. They have been used to assess the performance and characterize the kinematics of composite materials [3; 6].
X-ray diffraction methods have been used for wood to evaluate how the cellulose crystal strains in response to different loading, such as elastic [7-12], viscoelastic [13; 14] or mechanosorptive [13] strains, hygro-thermal treatments [15-17] , chemical treatments [17], drying [17; 18], stress release [17; 18] or stress induced by biological transformations [19]. Montero et al. [12] probed the behaviour of crystalline cellulose during elastic deformations of poplar wood. The results showed that the deformation of crystalline cellulose is lower than the macroscopic wood strain, and that this difference could not be explained by the projection effect of microfibril angle alone, but originated in one or more elements associated in series with crystalline cellulose. Hypotheses for the localization of these contributions are related to the “non-ideal” nature of wood structures, where elements at different scales may not be completely straight and have a finite length, leading to bending or shear-lag effects for which strain happen without straining the cellulose crystal. Understanding the origin and behaviour of these localized strain is essential for understanding how the wood structure ensures a good transmission of mechanical stress from the macroscopic scale to its stiffest constituent at a molecular scale. Here we aim at analysing the moisture-dependant behaviour of wood. The ratio between crystal and macroscopic strain is measured during elastic loading using an improved methodology based on Montero [11], and this ratio is compared between wood in wet and dry states, to probe the contribution of cellulose to wood strain and its change with moisture content.
45
50
55
60
65
70
75
80
85
Material and methods
Wood material and macroscopic measurements
Experiments were performed on wood specimens taken in the same area of a board of European spruce (Picea abies). Wood was first air-dried, then earlywood specimens of 50 x 3.2 x 1.8 mm (LxTxR) were cut far enough of the pith to neglect the annual ring curvature, and consider the R and T directions as uniform over the specimen. Specimens were polished with a precision motorized sander to make sure that their dimensions were uniform and that surfaces were parallel. The basic density of the specimens was 364 kg/m3(± 16 S.D.). The mean microfibril angle (MFA) of each specimen was measured by X-ray diffraction following the methodology described by Cave [20]. A total of 18 specimens with similar MFA (11.8° ±0.6 S.D.) were selected for this experiment. Nine of them were stabilized at ambient air-dry conditions (approx. 40% RH), and will hereafter be referred to as “dry specimens”. Their average moisture content was 6.0% (± 0.4 S.D.). The other 9 specimens were water-saturated by immersion in water in a chamber submitted to vacuum cycles during 7 days, and will hereafter be referred to as “wet specimens”. The modulus of elasticity (MOE) of the specimens was measured using a dedicated 4 point bending apparatus placed into a conventional testing machine. The specific modulus (E/d) was computed as the ratio of MOE to basic density.
Bending set-up and measurement of macroscopic strain
The specimens were used to perform in situ four-point bending tests while measuring axial lattice distance of crystalline cellulose. The set-up used is similar to that used by Montero et al. [12].
Figure 1. Design of the bending device and specimen geometry (dimensions in mm).
The bending device is illustrated in Fig. 1. Wood macroscopic strain were measured with 5 mm-long strain gages (Kyowa KFG-5-120-C1-11-L1M3R) glued with cyanoacrylate, in the middle of the top and bottom LxR surfaces of the specimen. The gages were connected to a data-logger (Vishay Model P3) recording the strain level. Four small pieces of steel were pasted on the upper and lower surfaces at the position of the loading points (Fig. 1) to minimize the effect of indentation of cylinders on wood during the test. A screw on the top of the bending device enabled the control of the displacement of the upper spans in the T direction, while the lower spans were fixed. The displacement was increased with the screw, until the desired strain level (average of the two strain gages = 0.15% and 0.24% for wet and dry specimens respectively) was reached. Temperature and relative humidity (RH) in the testing chamber were continuously measured during the tests, and ranged between 35-45% RH and 24-26°C.
X-ray diffraction set-up for measuring cellulose strain
The change in lattice distance of crystalline cellulose was calculated from the shift of the 004 cellulose crystal plane during bending. The bending device was placed in an X-ray goniometer (Agilent Technologies Gemini S), using a CuK source (wavelength =0.154 nm, energy E=8.05 keV) monitored at 40 kV and 40 mA. The spot size was 800 µm in diameter. In order to optimise the intensity of the (004)cellulose diffraction signal, the specimen was rotated at an angle =17° to the X-rays (corresponding 3
90
95
100
105
110
115
120
125
5
to the Bragg angle of the cellulose 004 plane with this wavelength), and the detector of an angle 2=34° (Fig. 2). Also, to maximize the resolution of the recorded pattern, the CCD detector (2048x2048; 31µm/pixel; bin1) was placed at a distance D=135 mm of the specimen (Fig. 2), acquisition focusing on the 004 cellulose peak.
Figure 2. Schematics of the X-ray beam path through the wood specimen to the detector. The loading mode
(4-point bending) is not represented on the figure.
Gold powder (with particles of 5 µm diameter) was placed on the back LxT surface of the specimen, to calibrate the distance between the specimen surface and the CCD detector, by detection of the angle of the (111)reflection of gold on each image. Dry specimens were exposed to X-rays during 60 seconds. Wet specimens, yielding lower signal intensity due to water absorption, were exposed during 90 seconds. To avoid any drying during the test of wet specimens, the bending device was enveloped in a cellophane film with water-saturated absorbent paper, ensuring a water-saturated atmosphere surrounding the specimen.
The specimens were scanned at 30 positions along the Z-axis (Fig. 2) from top to bottom, by moving up the device between two scans. The Z-position of the bending device was measured using a displacement sensor (Mitutoyo Absolute Digimatic Indicator; 1 µm accuracy). Steps of 100 µm were used for the 10 first scans, then 200 µm for the 10 following scans, and then 100 µm for the 10 last scans. This procedure was chosen to maximize the precision near the upper and lower surfaces of the specimen, where the strain is the largest. Given the size of the steps and that of the spot, successive probed wood areas partly overlap. At each step, the scan produced a pattern of X-ray diffraction including reflection peaks of cellulose (004)cellulose and gold (111)gold as illustrated on Fig. 2.
Signal integration and processing
Each pattern was integrated in the azimuthal direction (from = -20° to = +20° and from 2 = to 24°), yielding a one-dimensional signal expressing intensity variations as a function of the diffraction angle . The diffraction angle is related to the lattice distance via Bragg’s law:
d=n/(2sin) (Eq. 1)
(with d=lattice distance, =wavelength of the X-ray, = diffraction angle; and n=1). Figure 3 shows a typical raw pattern of intensity versus lattice distance. On this curve, two peaks are clearly distinct: one due to the diffraction of X-rays on the (004)cellulose crystal planes, and the other due to the diffraction of X-rays on (111)gold crystal planes. In order to remove the baseline of the background signal (due to the scattering of air, water and amorphous material), the curve was fitted by a 2nd order polynomial in domains far enough from the peaks (Fig. 3-a). The corrected curve is computed as the difference between the raw curve and the fitted baseline (Fig. 3-b). Peaks of (004)cellulose and (111)gold on the corrected curve are then fitted to a 4nd order polynomial in a central area of the peak including
130
135
140
145
150
155
160
inflexion points of the peaks (Fig. 3-b). This polynomial order yielded very stable fits, accounting for the possible asymmetry and kurtosis of the real peaks. The lattice distance at maximum intensity of the two peaks (d(004)cellulose and d(111)gold) was determined analytically from the fitted polynomial coefficients.
Figure 3. (a) typical raw curve of intensity versus lattice distance (dots), baseline (2nd order polynomial fitted far
from the peaks; red solid line) and boundaries used for baseline determination (vertical dotted line); (b) Typical corrected curve of intensity versus lattice distance (dots) after removing the baseline signal and 4th order
polynomial fit of gold and cellulose peaks (red solid lines) determining the lattice at maximal intensity (arrows) of gold and cellulose.
As the beam has a diameter of 800 µm, the d(004)cellulose represents the average of the (004) lattice distance of all the cellulose crystallites contained in the volume of wood crossed by the X-rays (~1.1 mm3). Taking into account wood density, assuming that wood roughly contains a mass fraction of 30% crystalline cellulose, and that cellulose crystallites are roughly 3 nm in width and 30 nm in length, the order of magnitude of the number of crystallites contained in the wood volume cross by X-rays is larger than 1014. This large number of crystallites enable to consider changes in lattice distance as representative of an average behaviour of crystalline cellulose.
Evaluation of cellulose crystal strain
Complete sets of 30 exposures were recorded at the initial state for each specimen, producing the initial lattice distance (d(004)cellulose_initial) at each position in the beam height. The same series of measurements was performed after bending, producing the final lattice distance (d(004)cellulose_final) at each position. The total time of a set of scan is approximately 45 minutes for dry specimens and 60 minutes for wet specimens. The final (bent) state is reached after having imposed a displacement inducing the desired macroscopic strain and then blocked with the screw to avoid any possible creep. As the specimen moves along Z during this operation, the position of each scan is not exactly the same between initial and final states, and therefore an interpolation procedure was necessary to match data along specimen height (see Appendix). Slight out-of-plane movements of the specimen may also happen during the bending. These movements directly affect the position of the peak on the CCD camera, and thus induce a possible bias on the estimation of lattice distance. The evaluation of crystal strain is very sensitive to this possible artefact and the gold signal was used to correct for it (see Appendix).
The average axial strain of the cellulose crystal was then calculated at each of the positions as: cellulose = [(d(004)cellulose_final d(004)cellulose_initial) (111)gold] / d(004)cellulose_initial (Eq. 2)
where (111)gold represents bias evaluated from the displacement of gold peak between initial and final
state (see Appendix).
5
165
170
175
180
185
190
195
10
During the numerical data processing, points with a too low diffracted signal (extreme points where the X-ray beam is tangent to the specimen and thus contains a minor amount of wood, 2 or 3 points on each side for the dry and wet specimens, respectively) were ignored and are not presented in the results.
Projection of the cellulose axial strain along in the wood fibre axis
The raw ratio of cellulose crystal strain to macroscopic strain (raw=cellulose/macro) was evaluated as the slope of their relationship, after removing outliers at the top and bottom of the profile. The longitudinal direction of cellulose differs from the longitudinal direction of the specimen by the MFA. Considering this, in order to compare strain in the same direction, the cellulose axial strain was projected along the longitudinal direction of the specimen. The same correction as the one used by Montero et al. (2012), has been used:
proj = cellulose / (cos²(µ)LT sin²(µ)) (Eq. 3)
Where µ is the MFA of the specimen, andLT,the Poisson’s ratio of the cell wall, is evaluated with a
micromechanical model (similar to that used in Alméras et al. [21]) under the assumption of shear restraint and thin cell wall(yielding LT~0.7 for µ=12°). This projection yields a slightly larger strain
than the original crystal strain, and would represent the cell wall strain in the limit case where its shearing is entirely restrained by adjacent cell walls, and cellulose microfibrils are entirely crystalline, perfectly straight, of infinite length and perfectly cohesive with the cell wall matrix material. The projected strain ratio (proj) was computed as proj/micro.
Results
Elastic modulus
The MOE of the dry specimens ranged between 13 and 17 GPa, with a mean of 15.4 GPa (± 1.1 S.D.) (Table 1). Their specific modulus ranged between 36 and 46 GPa.m3/kg, with a mean of 42.1 GPa.m3/kg (± 3.2 S.D.) (Table 1). The MOE for the wet specimens ranged from 9 to 11 GPa with a mean of 10.0 GPa (± 0.5 S.D.). Their specific modulus ranged between 21 and 26 GPa.m3/kg with a mean of 28.7 GPa.m3/kg (± 1.8 S.D.) (Table 2). The two sets of specimens are well matched presenting a similar range of MFA and density levels.
Sample MFA dB w E E/d Max. raw proj. R²
1 11.6 378 6.7% 14.5 38.4 0.22% 0.78 0.84 0.996 2 11.4 378 5.2% 16.3 43.1 0.20% 0.93 1.00 0.997 3 11.3 359 5.9% 13.1 36.5 0.26% 0.86 0.93 0.997 4 11.2 370 6.3% 17 45.9 0.20% 0.90 0.96 0.981 5 12.4 356 6.0% 15.7 44.1 0.22% 0.79 0.85 0.999 6 12.6 342 5.8% 15.7 45.9 0.25% 0.92 1.00 0.997 7 11 362 5.9% 15.3 42.3 0.28% 0.83 0.88 0.996 8 12.7 355 6.2% 14.9 42.0 0.27% 0.80 0.87 0.997 9 11.6 396 6.0% 16.1 40.7 0.26% 0.80 0.86 0.998 Mean 11.8 366 6.0% 15.4 42.1 0.24% 0.85 0.91 0.995 SD 0.6 16 0.4% 1.1 3.2 0.03% 0.06 0.06 0.005
Table 1. Dry specimen characteristics and bending test results. MFA: microfibril angle (°), dB: basic density
(kg/m3), w: moisture content (%), E: elastic modulus (GPa), E/d specific modulus (GPa.m3/kg), Max. : maximal
strain during the test (µstrain), raw: raw strain ratio, proj.: projected strain ratio, R²: coefficient of determination
of the relationship between strains, SD standard deviation.
Sample MFA dB w E E/d Max. raw proj. R²
200
205
210
215
220
225
230
11 11.7 352 Sat. 10.2 29.0 0.09% 0.81 0.87 0.991 12 11.6 355 Sat. 10.5 29.6 0.10% 0.63 0.68 0.965 13 11.4 356 Sat. 9.2 25.8 0.10% 0.56 0.60 0.980 14 12.4 331 Sat. 10.7 32.3 0.18% 0.76 0.82 0.975 15 12.5 344 Sat. 9.7 28.2 0.20% 0.59 0.65 0.987 16 11.1 359 Sat. 9.9 27.6 0.19% 0.66 0.70 0.981 17 12.7 359 Sat. 10.2 28.4 0.17% 0.55 0.60 0.967 18 12 338 Sat. 9.4 27.8 0.16% 0.65 0.71 0.985 19 11.5 344 Sat. 10.3 29.9 0.18% 0.59 0.63 0.998 Mean 11.9 349 Sat. 10.0 28.7 0.15% 0.64 0.69 0.981 SD 0.6 10 0.5 1.8 0.04% 0.09 0.10 0.011
Table 2. Wet specimen characteristics and bending test results. MFA: microfibril angle (°), dB: basic density
(kg/m3), w: moisture content is saturated (above fibre saturation point), E: elastic modulus (GPa), E/d specific
modulus (GPa.m3/kg), Max. : maximal strain during the test (µstrain),
raw: raw strain ratio, proj.: projected strain
ratio, R²: coefficient of determination of the relationship between strains, SD standard deviation.
Relationship between macroscopic strain and cellulose crystal strain: dry specimens
Figure 4 shows a typical profile of strain along the height of the specimens. Macroscopic strains, measured with strain gages on both sides, were linearly interpolated between the upper and lower side of the specimen, according to Benoulli hypothesis. At each point, the projected crystal strain is slightly larger than the crystal strain, and slightly lower than macroscopic strain. Overall, the relation between the strain and the position in the specimen are approximately linear, except for 1 to 3 points located near the border.
Figure 4. Typical profile of crystal strain (specimen 1). Each dot is a measurement point located along the height
of the specimen. Black line represents macroscopic strain, linearly interpolated between the upper and the lower sides of the specimen.
Relationships between projected crystal strain and macroscopic strain are shown in Fig 5. This relation is most of the time approximately linear (mean R²=0.995), except for the points located near the border. The ratio of crystal strain to macroscopic strain are shown in Table 1, for both raw and projected crystal strains. The raw ratio (raw) range between 0.78 and 0.93, with a mean of 0.85 (±0.06 S.D.). The projected (proj) ratio ranges between 0.84 and 1.00 (mean 0.91 ±0.06 S.D.).
7
235
240
245
Figure 5. Relationship between macroscopic strain and projected crystal strain for dry specimens. Black line:
linear regression of the points. Only closed symbols are used for the regression (open symbols are ignored)
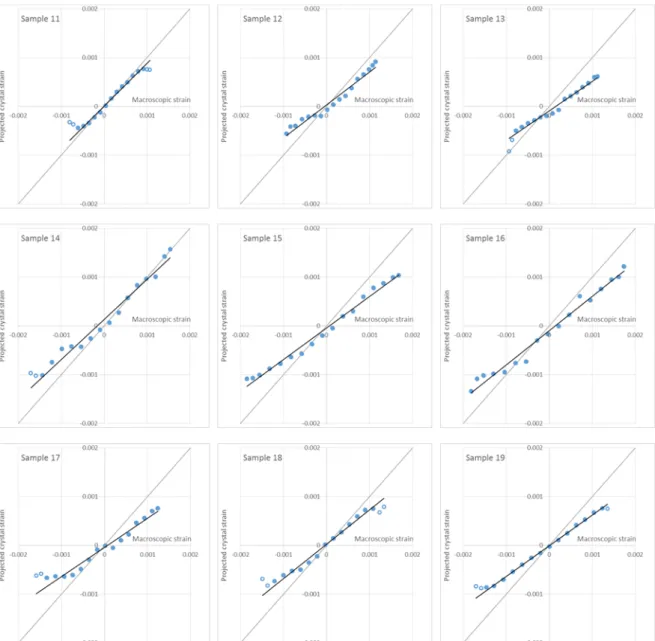
Relationship between macroscopic strain and cellulose crystals strain: wet specimens
Results for wet specimens are shown in Figure 6 and Table 2. The degree of linearity is lower than for dry specimens, but the quality of the regressions are satisfying anyway when border points are avoided (R² ranging between 0.975 and 0.998). The strain ratios were lower than in the dry case: raw ratios range between 0.55 and 0.81 (mean 0.64 ±0.09 S.D.), and projected ratios between 0.60 and 0.87 (mean 0.69 ±0.10 S.D.).
255
260
Figure 6. Relationship between macroscopic strain and projected crystal strain for wet specimens. Black line:
linear regression of the points. Only data points represented by closed symbols are used for the regression (open symbols are ignored).
Discussion
Linearity between macroscopic and crystal strain in the stress-strain linear domain
The slight deviation from linearity in the stress-strain linear domain can be ascribed to material heterogeneity and also to the cumulated errors due to the data processing. Montero et al. (2012) had similar results on poplar at dry state and during an elastic bending test. The degree of linearity of the relationship between macroscopic and crystal strain has been improved in the present study due to an improved procedure of data processing. The main improvements are: a higher order polynomial fit to determine the position of the peak, enabling to take into account more points and having a much more stable fit; an improved method of spatial interpolation to take into account the change in impacted area between initial and final states; a more stable correction of out-of-plane movements obtained by fitting the profile of position of the gold peaks as a rigid body movement (see Material and Methods and Appendix for details).
The calculated ratio for the dry specimens are smaller than 1, even after considering the projection effect of MFA. This result is consistent with several studies comparing cellulose crystal strain to 9
265
270
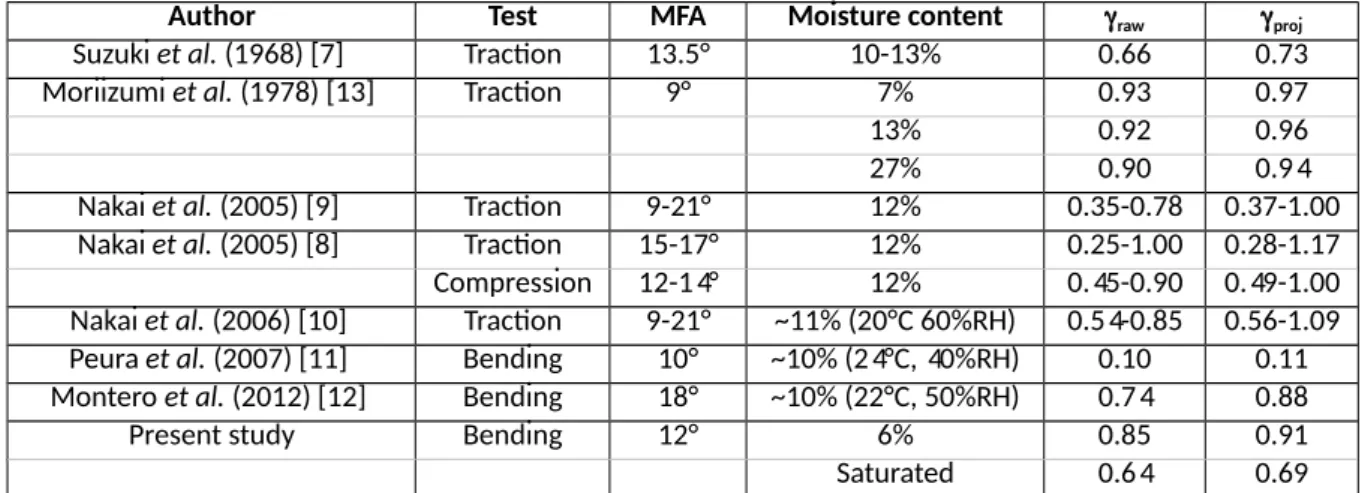
macroscopic strain for small macroscopic strain values. Using a similar procedure on dry poplar wood, Montero et al. (2012) reported a ratio of 0.85 after taking into account the projection effect of the MFA, in a bending experiment in the linear domain. Other studies involving tensile tests [7-10; 14] report ratios ranging from 0.3 to 0.93, for different wood species, MFA, moisture content and strain level. Our results strongly confirm the hypothesis that a source of strain add is additive to the projected cellulose crystal strain proj in the wood media. This additive strain increases linearly with macroscopic strain: add = (1-)macro.
Author Test MFA Moisture content raw proj
Suzuki et al. (1968) [7] Traction 13.5° 10-13% 0.66 0.73 Moriizumi et al. (1978) [13] Traction 9° 7% 0.93 0.97 13% 0.92 0.96 27% 0.90 0.94 Nakai et al. (2005) [9] Traction 9-21° 12% 0.35-0.78 0.37-1.00 Nakai et al. (2005) [8] Traction 15-17° 12% 0.25-1.00 0.28-1.17 Compression 12-14° 12% 0.45-0.90 0.49-1.00 Nakai et al. (2006) [10] Traction 9-21° ~11% (20°C 60%RH) 0.54-0.85 0.56-1.09 Peura et al. (2007) [11] Bending 10° ~10% (24°C, 40%RH) 0.10 0.11 Montero et al. (2012) [12] Bending 18° ~10% (22°C, 50%RH) 0.74 0.88 Present study Bending 12° 6% 0.85 0.91 Saturated 0.64 0.69
Table 3. Strain ratio obtained in different literature sources. MFA: microfibril angle of the specimens. Moisture
content of the specimens. raw: raw strain ratio. proj: projected strain ratio computed using MFA and raw
Results show that the ratio proj. varies considerably with the moisture content (proj.dry=0.91 vs. proj.wet=0.67). This implies that, at a given level of macroscopic strain, the contribution of crystalline cellulose to the total strain is lower when wood is wet than dry. Conversely, the contribution of the additive strain increases with moisture content. It represents 9% and 33% of the total strain for dry and wet specimens, respectively. Moriizumi (1978) did similar measurements of the crystal strains as a function of wood moisture content (see Table 3). A decrease in strain ratio with increasing moisture content was observed, consistently with present study. This decrease was however lower than observed in the present study.
Modelling the sources of moisture-dependent compliance
The compliance of wood (inverse of the modulus of elasticity) can be modelled as the sum of a contribution of two elements. The first contribution originates from the strain that occurs simultaneously with cellulose strain and the second for the source of additional strain Cadd. This first contribution is equivalent to the strain of an “ideal” cell wall (i.e. a cell wall where cellulose microfibrils are entirely crystalline, perfectly straight, of infinite length and perfectly cohesive with the cell wall matrix material), and will therefore be termed Cideal. Then we can write:
Ctot = Cideal + Cadd
As these two contributions can be modeled in series, the stress is the same in each of them, so that the compliances can be computed as:
Cideal = proj. / E Cadd = (1proj.)/ E
Table 4 indicates the compliances for dry and wet specimens, as well as the change between wet and dry states. Results indicate that, although wood compliance increased by 46%, the compliance associated to crystalline material only increased by 12%. The additional compartment was much more sensitive to water, since its compliance increased 4-fold between the dry and wet state. Most of the increase in compliance with moisture content (77%) was actually located in this additional compartment. 10
280
285
290
295
300
305
310
315
20
Wet Dry Wet-Dry Increase
Ctot 0.0348 0.0238 0.0110 46%
Cideal 0.0242 0.0216 0.0025 12%
Cadd 0.0106 0.0021 0.0085 398%
Cadd /Ctot 31% 9% 77%
Table 4. Sources of compliance in wet and dry state. Ctot: total compliance [GPa-1]. Cideal: compliance of the
compartment associated in parallel with crystalline cellulose [GPa-1]. C
add: compliance of the additional
compartment [GPa-1].
This analysis enables the calculation of the specific MOE of the “ideal” compartment, given by the inverse of its compliance, i.e. 46.2 and 41.4 GPa for the dry and wet states respectively. A cell wall model similar to that developed by Alméras et al. [21] was used to assess the effect of moisture on cell wall stiffness. This model is based on the assumption that cellulose microfibrils are perfectly parallel to each other, mostly crystalline and of infinite length. It does not take into account additional sources of deformations located within the wall or at higher levels of organisation, and is therefore suitable to model the “ideal” cell wall. Assuming that cellulose represents 50% of wood dry mass and accounts for the MFA of 12°, the modulus of elasticity of dry and wet cell walls can be modelled by fitting the variations of modulus of elasticity of the matrix material with moisture content. Using 17 GPa and 3 GPa for the MOE of the matrix, specific MOE of the cell wall of 46.4 and 41.5 GPa were obtained for dry and wet states respectively, which yields a decrease in MOE of 12% between dry and wet states. These values fit well with the data, and are realistic compared to the measured values for these parameters [22; 23], showing that the measured values of specific MOE and its decrease with moisture content found for the behaviour of the “ideal” cell wall compartment are consistent with their mechanical modelling.
Hypotheses about the source of additive strain in the linear domain
Several hypotheses can be formulated to explain the origin of this additive strain in wood media. Montero et al. [12] listed the different reasonable origins, involving the contribution of constituent physically associated in series, or the contribution of bending and shear strain at different length-scales. The present study proves that this additive source of compliance is also strongly moisture-dependent.
Results of the present study strongly support the hypothesis of an involvement of non-negligible shear strains. The shear strain would increase the macroscopic strain without increasing the cellulose strain, and is thus a possible candidate for the source of additive strain. These may be in-plane shear at the level of the cell wall (incomplete shear restraint between walls of adjacent cells) or localized shear effects due to the discontinuity of crystalline material at different scales (shear lag effect near the end of microfibrils within the wall, normal-longitudinal shear between cell wall layers, shear-lag effect near the end of fibres). Other hypotheses formulated by Montero et al. [12] involve bending effects at different scales (at the microfibril scale assuming that microfibrils are not completely straight at initial states and may straighten during cell wall extension, at the fibre scale due to the slight curvature of the cell wall in the longitudinal plane, or at the tissue scale due to fibre bending around rays).
Hypotheses involving global shear, localized shear or microfibril bending are all consistent with the increase of this additive strain with moisture content, since in all cases the strain of non-crystalline material (middle lamella or cell wall matrix) is involved in the proposed deformation mechanism. These components are made of pectins, lignins and hemicelluloses, which are all known to have moisture-dependant compliance. The change in stiffness of these constituents between the wet and dry states was reported to be 2 fold for lignin, and almost 100 fold for hemicellulose [22; 23]. The 4-fold increase in compliance of the additive compartment between wet and dry state therefore seems compatible with these values.
A hypothesis formulated by several previous authors is that this additive strain represents the contribution of amorphous domains of cellulose located in the microfibrils [8-12] . The presence of 11
320
325
330
335
340
345
350
355
360
such domains associated in series with crystalline cellulose is supported by several studies [2; 24; 25] , although a recent work [26] showed that the “equal strain” model (parallel association between crystalline and amorphous cellulose), was more realistic than the “equal stress” model (series association). Contrary to crystalline cellulose, amorphous cellulose is hydrophilic and could then exhibit a moisture-dependent behaviour. This source of strain could also have a non-negligible contribution to additional strains.
Consequences for mechanical models of wood behaviour
Mechanical models usually consider only a simplified representation of wood structure. Regarding the behaviour in the grain direction, many of such models as based on the assumption that wood behaviour can be modelled at the cell and cell wall scales [27-32]. The main parameters of wood behaviour are then accounted for through the cell wall relative thickness and the orientation of microfibrils. These models are based on many implicit assumptions about wood structure, considering straight elements (microfibrils and/or wood fibres) of infinite length. More complex models are based on a multiscale representation ranging from the polymer scale to the macroscopic scale and account for finite length of crystalline microfibrils, but not for other factors possibly influencing the ratio of crystal strain to macroscopic strain [5]. The present study shows that these assumptions may neglect important determinants of wood compliance related to the ‘non-ideal’ structure of wood, in particular when moisture-dependant behaviour is considered [28; 30; 33; 34]. These simplifications may also have important consequences for the modelling of other behaviours, and in particular visco-elastic behaviour [4], because its main determinants are non-crystalline domains, similar to those identified as a source of additive strain in the present study. We suggest that the strain ratio could be used for the validation for mechanical models, by comparing the modelled ratio to its real values.
Conclusion
We measured strain in the cellulose crystal, compared it to the macroscopic strain through the strain ratio, and showed that crystal strains are lower than macroscopic strains. This difference could not be explained only by the difference between cell wall and cellulose orientations, but involves other sources of compliance associated in series with crystalline cellulose. This source of compliance amounts approximately to 9% of the wood total compliance for dry wood, and dramatically increases with moisture content, raising to a value of 31%. Our analysis shows that the compliance of the non-crystalline sources of strain increased 4-fold between air-dry and water-saturated conditions. Different possible localisations of this source of strain were proposed, and it is suggested that current models of wood elastic behaviour could use the strain ratio as a validation parameter.
365
370
375
380
385
390
395
400
Appendix: re-positioning of the scans between initial and deformed states
Between initial and final measurements, the zone of specimen impacted by X-rays can move in two directions: z in the height of the beam, due to deflection, and r in the perpendicular direction, due slight to out-of-plane movement of the specimen (see Fig. 2). The r movement affects the precision of lattice distance measurements, and the z movement is problematic for the calculation of cellulose crystal strain.Correction of specimen movement in the Z direction
In our set-up, the deflection of the beam at the level of the X-ray scans cannot be precisely determined and monitored. Therefore, the scans made at initial and final states are not exactly impacting the same wood area. The position of the first scanned area relative to the specimen border differs by z between the initial and final states. Because of the natural variability of wood, the mean cellulose lattice distance at initial state is not uniform in the wood specimen. Therefore, to take into account this variability during the computation of strain between initial and loaded states, it is important to consider the change in impacted area. For this, an interpolation procedure was used, consisting in two steps: (1) determination of the position of a given scan in initial state relative to the position of scans made in final state; (2) determination of the lattice distance at this position in the final state by linear interpolation between lattice distances measured on neighbouring positions in the final state. For the first step, the profile of maximal intensity of the diffraction patterns is used. Indeed, because of the variability of wood material, the density of wood is not uniform in the wood specimen, and thus the signal intensity has a profile that depends on this non-uniformity, but not on the state of strain. The profiles of signal intensity in initial and final states are matched by fitting a linear transformation (translation + dilatation of the profile). The fitted parameters are used to determine the relative positions of initial and final scans.
Correction of specimen movement in the R direction
The accuracy of the (004)cellulose lattice measurement using X-ray diffraction strongly depends on the precision of the position of the specimen in the device, and, more precisely, the distance D between the centre of mass of the impacted area and the camera (see Fig. 2). This distance is used to determine accurately the angle, from which the lattice distance d004 is computed. Even a slight out-of-plane movement (r) of the specimen has an important consequence on this estimation, especially when small crystal strains (lower than 0.1%) are to be detected. Increasing the distance D between the specimen and the detector is a first solution to minimize the relative effect of this out-of-plane movement. This distance D was set to the maximal value possible in our X-ray diffraction apparatus. To achieve higher accuracy, the calibration with gold powder was used. Gold powder does not strain during the bending of the specimen, so that the change in position of its peak on the diffraction pattern enables the computation of the out-of-plane displacement r, and use it for correcting raw data. To improve the stability of this correction, we assumed that the movement of each gold particle between initial and final state was a linear function of its position relative to the specimen border (i.e. the layer of gold displaces as a rigid body, being characterized by a translation and a rotation). This enables to calculate, at each scan position, the bias (111)gold in the estimation of d(004)cellulose at final state. 13
405
410
415
420
425
430
435
440
25
References
[1] Eichhorn, S. and Davies, G. (2006). Modelling the crystalline deformation of native and
regenerated cellulose, Cellulose 13 : 291-307.
[2] Young, R. and Eichhorn, S. (2007). Deformation mechanisms in polymer fibres and
nanocomposites, Polymer 48 : 2 - 18.
[3] Sakurada, I.; Nukushina, Y. and Ito, T. (1962). Experimental determination of the elastic modulus
of crystalline regions in oriented polymers, Journal of Polymer Science, Part A: Polymer Chemistry 57 :
651-660.
[4] Eitelberger, J.; Bader, T.; de Borst, K. and Jäger, A. (2012). Multiscale prediction of viscoelastic
properties of softwood under constant climatic conditions, Computational Materials Science 55 : 303–
312.
[5] de Borst, K. and Bader, T. (2014). Structure-function relationships in hardwood-insight from
micromechanical modelling, Journal of theoretical biology 345 : 78–91.
[6] Young, R. J.; Eichhorn, S. J.; Shyng, Y.-T.; Riekel, C. and Davies, R. J. (2004). Analysis of stress
transfer in two-phase polymer systems using synchrotron microfocus X-ray diffraction,
Macromolecules 37 : 9503-9509.
[7] Suzuki, M. (1968). Mechanical deformation of crystal lattice of cellulose in Hinoki wood, Mokuzai Gakkaishi 14 : 268–275.
[8] Nakai, T.; Yamamoto, H. and Nakao, T. (2005). The relationship between macroscopic strain and
crystal lattice strain in wood under uniaxial stress in the fiber direction, Journal of Wood Science 51 :
193–194.
[9] Nakai, T.; Yamamoto, H.; Nakao, T. and Hamatake, M. (2005). Mechanical behavior of the
crystalline region of wood and the piezoelectric response of wood in tension tests, Wood Science and
Technology 39 : 163-168.
[10] Nakai, T.; Yamamoto, H.; Nakao, T. and Hamatake, M. (2006). Mechanical behavior of the
crystal lattice of natural cellulose in wood under repeated uniaxial tension stress in the fiber direction,
Wood Science and Technology 40 : 683–695.
[11] Peura, M.; Kölln, K.; Grotkopp, I.; Saranpää, P.; Müller, M. and Serimaa, R. (2007). The effect of
axial strain on crystalline cellulose in Norway spruce, Wood Science and Technology 41 : 565–583.
[12] Montero, C.; Clair, B.; Alméras, T.; van der Lee, A. and Gril, J. (2012). Relationship between
wood elastic strain under bending and cellulose crystal strain, Composites Science and Technology
72 : 175–181.
[13] Moriizumi, S. and Okano, T. (1978). Viscoelasticity and structure of wood. IV: Behavior of crystal
lattice strain depended on moisture content an time, Mokuzai Gakkaishi 24 : 1–6.
445
450
455
460
465
470
475
[14] Suzuki, M. (1984). Creep of the crystal lattice of cellulose in wood, : 97-99.
[15] Toba, K.; Yamamoto, H. and Yoshida, M. (2012). Mechanical interaction between cellulose
microfibrils and matrix substances in wood cell walls induced by repeated wet-and-dry treatment,
Cellulose .
[16] Toba, K.; Yamamoto, H. and Yoshida, M. (2013). Crystallization of cellulose microfibrils in wood
cell wall by repeated dry-and-wet treatment, using X-ray diffraction technique, Cellulose 20 : 633-643.
[17] Toba, K.; Yamamoto, H. and Yoshida, M. (2013). On the mechanical interaction between
cellulose microfibrils and matrix substances in wood cell walls: effects of chemical pretreatment and subsequent repeated dry-and-wet treatment, Journal of Wood Science : 1–8.
[18] Clair, B.; Alméras, T.; Yamamoto, H.; Okuyama, T. and Sugiyama, J. (2006). Mechanical behavior
of cellulose microfibrils in tension wood, in relation with maturation stress generation., Biophysical
journal 91 : 1128–35.
[19] Clair, B.; Alméras, T.; Pilate, G.; Jullien, D.; Sugiyama, J. and Riekel, C. (2011). Maturation stress
generation in poplar tension wood studied by synchrotron radiation microdiffraction., Plant
physiology 155 : 562–70.
[20] Cave, I. D. (1966). Theory of X-ray measurement of microfibril angle in wood, Forest Products Journal 16 : 37–42.
[21] Alméras, T.; Gril, J. and Yamamoto, H. (2005). Modelling anisotropic maturation strains in wood
in relation to fibre boundary conditions,microstructure and maturation kinetics, Holzforschung 59 :
347–353.
[22] Cousins, W. J. (1976). Elastic modulus of lignin as related to moisture content, Wood Science and Technology 10 : 9–17.
[23] Cousins, W. J. (1978). Young's modulus of hemicellulose as related to moisture content, Wood Science and Technology 167 : 161–167.
[24] Nishiyama, Y. (2009). Structure and properties of the cellulose microfibril, Journal of Wood Science 55 : 241-249.
[25] Salmén, L. and Burgert, I. (2009). Cell wall features with regard to mechanical performance. A
review COST Action E35 2004–2008 : Wood machining–micromechanics and fracture, Holzforschung
63 : 121–129.
[26] Salmén, L. (2015). Wood morphology and properties from molecular perspectives, Annals of Forest Science 72 : 679-684.
[27] Cave, I. D. (1968). The anisotropic elasticity of the plant cell wall, Wood Science and Technology 2 : 268–278.
[28] Cave, I. D. (1978). Modelling moisture-related mechanical properties of wood Part I: Properties of
the wood constituents, Wood Science and Technology 12 : 75–86.
15
480
485
490
495
500
505
510
30
[29] Harrington, J. J.; Booker, R. and Astley, R. J. (1998). Modelling the elastic properties of
softwood-Part I: The cell-wall lamellae, Holz als Roh- und Werkstoff 56 : 37–41.
[30] Yamamoto, H.; Kojima, Y.; Okuyama, T.; Abasolo, W. P. and Gril, J. (2002). Origin of the
biomechanical properties of wood related to the fine structure of the multi-layered cell wall, Journal
of Biomechanical Engineering 124 : 432.
[31] Xu, P. and Liu, H. (2004). Models of microfibril elastic modulus parallel to the cell axis, Wood Science and Technology 38 : 363-374.
[32] Qing, H. and Mishnaevsky, L. (2009). Moisture-related mechanical properties of softwood: 3D
micromechanical modeling, Computational Materials Science 46 : 310 - 320.
[33] Koponen, S.; Toratti, T. and Kanerva, P. (1991). Modelling elastic and shrinkage properties of
wood based on cell structure, Wood Science and Technology 25 : 25–32.
[34] Kojima, Y. and Yamamoto, H. (2004). Properties of the cell wall constituents in relation to the
longitudinal elasticity of wood. Part 2: Origin of the moisture dependency of the longitudinal eleasticity of wood, Wood Science and Technology 37 : 427–434.


![Table 4. Sources of compliance in wet and dry state. C tot : total compliance [GPa -1 ]](https://thumb-eu.123doks.com/thumbv2/123doknet/13929699.450562/12.892.106.573.105.209/table-sources-compliance-wet-state-total-compliance-gpa.webp)
