A Dynamic-induced Direct-shear Model for Dynamic
Triggering of Frictional Slip on Simulated Granular Gouges
W. Wu&J. ZhaoReceived: 23 May 2013 / Accepted: 28 October 2013 / Published online: 15 November 2013 # Society for Experimental Mechanics 2013
Abstract This study presents a dynamic-induced direct-shear model to investigate the dynamic triggering of frictional slip on simulated granular gouges. An incident P-wave is gener-ated as a shear load and a normal stress is constantly applied on the gouge layer. The shear stress accumulates in the inci-dent stage and the frictional slip occurs in the slip stage without the effect of the reflected wave. The experimental results show a non-uniform shear stress distribution along the gouge layer, which may be induced by a shear load induced torque and by normal stress vibration along the layer. The shear stress at the trailing edge strongly affects the fric-tional slip along the P-wave loading direction, while the rebound stress at the leading edge propagates along the oppo-site direction. The frictional slip is triggered when the maxi-mum shear stress at the trailing edge reaches a critical value. The normal stress influences the maximum shear stress at the trailing edge, the maximum slip displacement and the slip velocity. The advantages and the limitations of this model are discussed at the end.
Keywords Seismic wave . Dynamic triggering . Frictional slip . Rock discontinuities . Granular gouges
Introduction
Rock mass instability, such as a seismic-induced landslide and a blast-induced collapse, is usually associated with frictional slip on discontinuities in rock masses. Rock discontinuities are structural breaks in geological media, such as faults, bedding
planes, joints and microcracks. The connection between rock discontinuities and seismic activities has been recognized as a central issue of dynamic triggering of frictional slip [1, 2], nevertheless, remains enigmatic. The dynamic triggering of frictional slip may take place close to or far from a main shock and depends on incident wave energy and stored strain energy at a discontinuous plane. If the stored strain energy released from the frictional slip is sufficiently large, it can radiate in the form of seismic waves and may further induce aftershocks in close proximity.
A simplified and controllable laboratory fault is thought to be mechanically similar to a real fault and to provide possible application to faulting [3]. Several laboratory experiments have been conducted to explore the mechanism of frictional slip at a range of slip rates, with and without gouges and under the effects of temperature, normal and pore pressures [2,4–6]. The experimental configurations include uniaxial compres-sion [7,8], biaxial compression [4,9], triaxial compression [10–12], direct-shear [5,13–15], double direct-shear [16–18] and rotary shear [6, 19]. These studies have made great progress to explain the mechanism of the static triggering of frictional slip. However, the frictional slip can be triggered by either static or dynamic stress change [20]. Seismic waves always induce the dynamic triggering of frictional slip, which is subjected to less attention in laboratory experiments. There are a few challenges in laboratory investigation on the dynam-ic triggering of frdynam-ictional slip, for instance, initiation of dy-namic triggering, observation of wave radiation and visuali-zation of contact evolution.
In this study, the direct-shear model is selected to perform the dynamic triggering of frictional slip on a layer of filling gouges. The traditional direct-shear model assumes that the friction is uniform along the interface and the edge effect can be neglected. The loads and displacements in the normal and shear directions are recorded in the test. However, the shear stress in filling gouges is developed locally, owing to W. Wu (*)
:
J. ZhaoEcole Polytechnique Fédérale de Lausanne (EPFL), School of Architecture, Civil and Environmental Engineering, Laboratory of Rock Mechanics (LMR), 1015 Lausanne, Switzerland
numerous gouge particle contacts with random distribution, and non-uniformly affects the global stability of the gouge layer. The frictional slip is defined as local motions along parts of the interface, rather than motion of the entire interface, which is defined as the frictional sliding [21]. Additionally, for a rock discontinuity with a finite length subjected to a limited normal load and a dynamic shear load, the shear stresses at the edge parts may be different from that at the center part. The dynamic triggering of frictional slip thus depends on shear stress distribution along the gouge layer, which is necessary to be observed before and during the slip. Rock discontinuities are found to be ubiquitous in rock masses. Some discontinuities are non-welded contacts and some contain weak media sandwiched between country rock walls. The weak media are also known as gouges and are formed during fracture developments and weathering process-es. The filling gouges exist in all scales of rock discontinuities, not only influencing seismic wave attenuation [22], but con-trolling frictional slip [23]. The frictional slip on rock discon-tinuities filled with gouges is induced by shear stress accumu-lation in the gouge layer under quasi-static conditions, how-ever, that under dynamic triggering is still not well under-stood. Johnson and Jia [24] found that the dynamic triggering either further weakens a layer of filling gouges or induces the frictional slip when the gouge layer is near failure. The fric-tional slip is also related to the nonlinear dynamic response of filling gouges [2]. Furthermore, the dynamic triggering of frictional slip is a complex process that may be also associated with other factors, for instance, tectonic pressure, initial state of filling gouges and wave transmission and reflection from adjacent rock discontinuities. Hence, a simplified and control-lable laboratory experiment is necessary to investigate the dynamic triggering of frictional slip on filling gouges. There are three basic factors to be considered in the experiment: a pre-existing rock discontinuity with a layer of filling gouges, a controllable dynamic loading system and suitable measuring techniques for strain, load and displacement measurements.
The static and dynamic coefficients of friction have been commonly used to describe a frictional motion between two elastic half-spaces. The frictional motion occurs when the coefficient of friction at the frictional interface reaches the static coefficient of friction. The frictional sliding along the entire interface is then controlled by the dynamic coefficient of friction, which is not larger than the static coefficient of friction. The onset of frictional motion on the interface can be viewed based on an energy budget, which is proposed by the dynamic fracture mechanics [25]. A balance of the frictional system energy between the decrease in elastic strain energy and the increase in surface energy determines crack extension. When the strain energy being released exceeds the surface energy that required for crack extension (also called the frac-ture energy), a crack is introduced and expanded accompanied by strain energy relaxation. The crack length increases with
increasing system energy until a critical crack length is ob-tained. After that, the strain energy dominates the system energy and results in the decrease of the system energy. The crack is arrested when the strain energy becomes smaller than the surface energy.
The objective of this study is to present a dynamic-induced direct-shear (DIDS) model for the dynamic triggering of fric-tional slip on simulated granular gouges sandwiched in a rock discontinuity. The experimental setup includes a direct-shear configuration with a real rock discontinuity with a layer of granular gouges, a well-controlled plane P-wave loading sys-tem and strain gauge groups (SGGs), a load cell and a dis-placement meter for strain, load and disdis-placement measure-ments, respectively. An incident P-wave is generated from the impact event between the striker bar and the front end of the incident plate. When the incident wave propagates in the incident plate, dynamic shear stress is radiated from the gouge layer. The dynamic triggering of frictional slip then occurs along the gouge layer. A series of experimental tests is per-formed on a layer of granular gouges with the same thickness and under different normal loads. To the end, the advantages and the limitations of this model are presented.
Experimental Setup Direct-shear Model
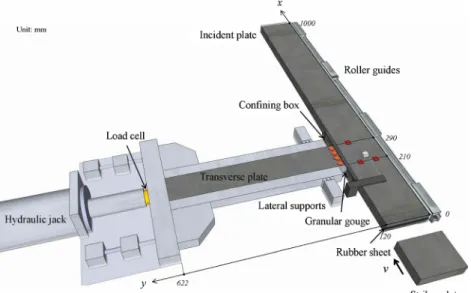
A direct-shear configuration is a classic effort to simulate interface friction in laboratory experiments. The DIDS model, as shown in Fig.1, consists of two thin rock plates with a thickness of 30 mm, namely, the incident plate (1,000 mm in length and 120 mm in width) and the transverse plate (500 mm in length and 80 mm in width). One short side of the trans-verse plate connects to one long side of the incident plate through a layer of granular gouges as a frictional interface. A normal load is applied to the other short side of the transverse plate at the beginning of the test and is kept a constant value during the test. The other long side of the incident plate is connected to a fixed frame through four NSK linear roller guides. The maximum frictional load of each roller guide is kept 8 N for a normal load up to 10 kN. The frictional load is much smaller than that generated in the gouge layer during the test, and thus the friction from the roller guides can be neglected. A 2 mm quartz sand layer is filled in the interface. As shown in the rectangular coordinate plane, the trailing edge of the gouge layer (x =210 mm, y =122 mm) is close to the impact end of the incident plate. There is a 710 mm distance from the leading edge of the gouge layer (x =290 mm, y = 122 mm) to the end of the incident plate, which is designed to avoid the P-wave reflected from the incident plate end that may disturb the frictional slip. For the same consideration, the transverse plate is 500 mm long to avoid the shear stress
reflected from the transverse plate end. The sides of the transverse plate are supported by two lateral supports to elim-inate the plate bending and to achieve a direct-shear event along the gouge layer. The lateral support includes a steel frame and a fixed support (see Fig.2). The 480 mm long steel frames are arranged from the transverse plate end close to the load cell. There is a 20 mm gap from the end of the steel frame to the gouge layer. The fixed support restricts the lateral movement of the transverse plate and allows the plate to move along the direction of the normal load.
The high-quality Dark Impala norite material is an ideal rock medium to study fault mechanism due to a high density (i.e., 2,900 kg/m3), a high compressive strength (i.e., 284 MPa), homogenous grain sizes and few visible cracks. The Young’s modulus of the norite material is 63.6 GPa, and the shear modulus is 26.5 GPa. The saw-cut unpolished rock surface (approximately 5 μm r.m.s. surface roughness) is used as the frictional interface. The striker plate, the incident plate and the transverse plate are carefully screened under an ultrasonic device before the test, in order to ensure the lowest defects that may influ-ence wave propagation.
Fault structure may be viewed as a granular framework, which is discrete and strongly heterogeneous [26]. A layer of dry quartz sand is used to simulate filling gouges. The reasons include: (a) the mineral composition of the quartz sand can be treated as a constant value in the test; (b) the water content can be neglected at the room temperature and the associated viscosity is zero. The quartz sand sieved in a size range of 1–2 mm is used in the test. The quartz sand is initially filled in a pre-set gap (i.e., 2 mm) between the incident and transverse plates and is held by a steel confin-ing box (Fig. 3). The upper and lower sides of the gouge layer are confined by the confining box before and during the test. A small grease layer is filled in the gap between the plate surface and the box inner surface to reduce undesired friction. The left and right sides of the gouge layer are first confined by two supports with the screws connected to two sides of the confining box before the test. The normal load is applied on the gouge layer and increases to a desired value. During the process, the quartz sand is compacted to form a contact network under the confinement. The sup-ports are then removed by releasing the connecting screws. During the test, the frictional slip on the gouge layer in the plate plane is considered and the movement of the gouge layer perpendicular to the plate plane is neglected. Fig. 1 Schematic view of the
dy-namic-induced direct-shear model
Fig. 2 Arrangements of strain gauge groups, a displacement meter and a
Triggering Mechanism
The dynamic loading system is demonstrated in Fig.4. The impact event between the striker plate and the front end of the incident plate generates a low-rate plane P-wave. The incident wave has a plane front perpendicular to the P-wave loading direction. Wave reflection from two sides of the incident plate is thus unnecessary to be considered. The incident wave propagates in the incident plate and drives the movement of the incident plate, resulting in shear stress accumulation in the gouge layer. The triggering mechanism is similar to that of the split Hopkinson rock bar [27]. The striker plate has the same cross-section as the incident plate and a length of 100 mm. Two identical springs with a stiffness coefficient of 7.02 N/ mm are parallel compressed for a distance of 47 mm as the energy source. The compressed springs are instantaneously released by a control handle to launch the striker plate. The striker plate is supported by a moving box with wheels, moves along a pair of guides and impacts the front end of the incident plate. It is required that the loading system can well control the full face contact of the striker and incident plates for a plane P-wave generation. A rubber sheet with dimensions of 5 mm× 120 mm×1 mm is placed at the impact end of the incident plate to generate a non-dispersive loading pulse and to protect the contacting ends of the striker and incident plates. The low loading rate impact need maintain the elastic deformation of the striker and incident plates during the test. In the trial test, when the loading rate is larger than 200 GPa/s, the incident plate tends to be broken.
Measurement and Data Analysis
Figure2 shows the arrangements of strain gauge groups, a displacement meter and a load cell. The incident wave prop-agating in the incident plate is recorded by three strain gauge groups (P1, P2 and P3), which are connected in the Wheat-stone full-bridge to reduce the signal noise. The SGG P1 and
the SGG P2 are located 210 mm away from the impact end of the incident plate and near the trailing edge of the gouge layer. The SGG P3 is located near the leading edge of the gouge layer. The dynamic shear stress in the transverse plate is recorded by four strain gauge groups (S1, S2, S3 and S4), which are connected in the full shear bridge [28]. The strain gauge groups for the shear stress measurement are arranged with the same distance of 5 mm from the gouge layer and with the same distance of 5 mm from the supporting frame end of the transverse plate. The relative displacement of two sides of the gouge layer is measured by a displacement meter. A Philtec fiberoptic sensor is used as the displacement meter based on the intensity of the reflected signal that varies with the gap between the sensor tip and the laser target. The displacement meter is fixed on the basement and records the movement of the incident plate along the slip direction. The recorded movement of the incident plate is thus relative to the fixed transverse plate. The normal load is measured by a load cell and is kept a constant value during the test. The load cell is inserted between the transverse plate and the hydraulic jack. The strain gauge groups, the displacement meter and the load cell are connected to a LabVIEW data acquisition unit and are synchronously measured with a sampling rate of 100 kHz.
Results and Discussion
P-wave Generation and Propagation
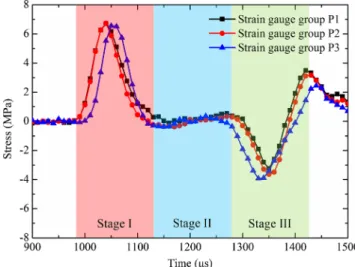
Figure5shows that an incident P-wave is generated from the impact event between the striker plate and the front end of the incident plate, propagates in the incident plate and is reflected back at the plate rear end. The nearly identical stress-time responses recorded by the SGG P1 and the SGG P2 indicate that a plane P-wave is successfully generated during the
Fig. 4 Side view of the loading system before the test
Fig. 5 An incident wave propagates in three stages, the incident stage (I), the slip stage (II) and the reflected stage (III)
impact event. The stress-time response recorded by the SGG P3 is similar to that recorded by the SGG P1 and indicates that the P-wave attenuation between the leading edge and the trailing edge can be neglected. The P-wave velocity is 5, 000 m/s. The loading rate of the P-wave is defined as the gradient of the tangent of the pre-peak portion of the stress-time response, which is kept a constant value of 180 GPa/s in this study.
The stress-time response is divided into three stages, name-ly, the incident stage (I), the slip stage (II) and the reflected stage (III). In the incident stage, a sinusoidal P-wave with a frequency of 3.3 kHz and a half-wavelength of 0.75 m is generated. The duration of this stage is about 150μs. The test result is valid when the P-wave recorded by the SGG P1 and the SGG P2 is nearly coincident. In the slip stage, no signal is recorded by the strain gauge groups until the arrival of the reflected wave from the rear end of the incident plate. In order to neglect the effect of the reflected wave, the frictional slip shall occur during the slip stage. The duration of the slip stage is also about 150μs. During the reflected stage, the P-wave reaches the layer of granular gouges again. The shear stress in the gouge layer becomes complicated and is not taken into account.
Dynamic Shear Stress
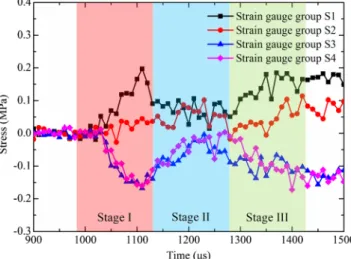
Figure6shows the shear stress-time responses recorded by the SGG S1, the SGG S2, the SGG S3 and the SGG S4. The four shear stress-time responses show a non-uniform dynamic shear stress distribution along the layer of granular gouges. The shear stress recorded by a strain gauge group shows the density of locally stored strain energy in granular gouges before rupture. The shear stress recorded by the SGG S1 generates at the trailing edge of the gouge layer. The shear stress at the trailing edge initiates later than the incident
P-wave and continuously accumulates in the incident stage. Before an obvious stress increase, the shear stress irregularly fluctuates at a low stress level. The stress fluctuations at the beginning may be due to: (a) detachment occurs at weak sand contacts; (b) the incident P-wave partially spreads across the gouge layer. The shear stress then increases with small fluc-tuations and reaches the maximum value near the end of the incident stage. The small fluctuations may also be due to the damage of sand contacts during the shear stress accumulation. The shear stress decreases after the maximum value accom-panied by the frictional slip.
The shear stress-time response recorded by the SGG S1 shows that the shear stress at the trailing edge affects the frictional slip along the P-wave loading direction, while those recorded by the SGG S3 and the SGG S4 show that the shear stress at the leading edge propagates along the opposite direc-tion. The reverse shear stress distribution can be attributed to a shear load induced torque and normal stress vibration across the gouge layer.
First, the gouge layer at the trailing edge has a dense compaction state, which induces strong normal stress vibra-tion and high shear stress radiavibra-tion. It has been found that large-amplitude and short-period vibration of normal stress result in reduction of frictional strength and destabilization of fault zones [29]. The incident P-wave can induce a non-uniform distribution of normal stress vibration across the gouge layer, which is due to strain energy radiation from granular gouges. There is more released strain energy at the trailing edge than that at the leading edge, because a few sand particles at the leading edge fly out along the slip direction and partially take strain energy away. Hence, the gouge layer has a denser compaction state at the trailing edge, resulting in more released strain energy and stronger normal stress vibration. The local vibration also facilitates the frictional slip, owing to normal strength reduction and dynamic weakening of granular gouges [30].
Second, the gouge layer at the leading edge has a loose compaction state, which can cause elastic rebound at the leading edge. Rubinstein et al. [21] reported that the appear-ance of rebound stress is initiated at the leading edge, which is due to a small torque induced by a shear load. In this study, there is a 20 mm distance from the supporting frame end of the transverse plate to the gouge layer. The shear stress along the gouge layer causes a small torque and induces a rebound stress at the leading edge. However, owing to the low shear stress in the gouge layer and the high shear modulus of the norite material, the small torque is limited to affect the frictional slip. The rebound stress can also be induced by the detachment of sand contacts at the leading edge, which is due to normal stress vibration and flying-out sand particles. The normal stress vibration in the loosely compacted gouges may be weak, but it is unclear the contributions of normal stress vibration and flying-out sand particles to the detachment of Fig. 6 Dynamic shear stresses in three stages under a normal stress of
sand contacts. We also observe that the rebound stress has a higher loading rate, which is the slope of the pre-peak portion of the stress-time response, than the shear stress at the trailing edge. The rising parts of the rebound stresses recorded from the SGG S3 and the SGG S4 contain less fluctuation than that of the shear stress recorded from the SGG S1. These phenom-ena show that the gouge layer is loosely compacted at the leading edge.
The shear stress-time response recorded by the SGG S2 is superposed by the shear stress from the trailing edge and the rebound stress from the leading edge. At the beginning, the shear stress tends to increase along the P-wave loading direc-tion. The rebound stress then increases faster and becomes larger than the shear stress at the trailing edge, because the velocity of the rebound stress at the leading edge is faster than that of the shear stress at the trailing edge [21]. Hence, the shear stress recorded by the SGG S2 changes to the direction of the rebound stress. When the rebound stress reaches the maximum value and starts to decrease, the shear stress at the trailing edge is still increasing and dominates the shear stress recorded by the SGG S2 again. The effective shear stress recorded by the SGG S2 oscillates relying on the superposi-tion of the shear stress from the trailing edge and the rebound stress from the leading edge. The shear stress is kept a small value in the incident stage and has a limited effect on the frictional slip.
The dynamic shear stress recorded by the strain gauge groups is not a pure shear wave. The recorded shear stress includes the shear stress components of the stresses generated at the trailing and leading edges and the shear stress compo-nents of the stresses generated from sand motion in the gouge layer. This study tends to observe the shear stress before and during the frictional slip, thus the strain gauge groups are arranged in the full shear bridge and record the shear stress along the slip direction.
Frictional Slip
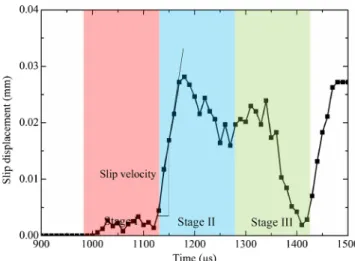
Figure 7 shows the slip displacement-time response of the incident plate relative to the fixed transverse plate. The fric-tional slip initiates when the shear stress at the trailing edge reaches the maximum value near the end of the incident stage. During the frictional slip, the shear stress decreases until the arrival of the reflected wave. The frictional slip increases to the maximum slip displacement in the slip stage without the effect of the reflected wave. The increasing part of the slip displacement-time response reflects the opening of sand con-tacts and the decreasing part of this time response means the closing of sand contacts. During the opening of sand contacts, the sand contacts are damaged along the gouge layer and the frictional slip is triggered along the P-wave loading direction. During the closing of sand contacts, the sand particles tend to come back in closer contact [14] and to re-form new contacts
for supporting decreasing shear stress. Some small fluctua-tions in the decreasing part of the slip displacement-time response is observed, indicating re-form of sand contacts and re-damage of new contacts during the closing of sand contacts. This study only observes the first slip event under the dynamic triggering. Many slip events follows the first one, as shown in the reflected stage in Fig.7, and frictional sliding may occur later, which are, however, out of the scope of this study. The slope of the pre-peak portion of the first slip event is defined as the slip velocity.
Effect of Normal Stress
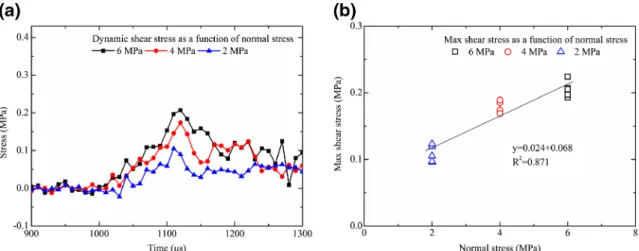
The shear stress-time response at the trailing edge is plotted to show the effect of normal stress on the dynamic triggering of frictional slip on simulated granular gouges (Fig. 8(a)), be-cause the granular gouges at the trailing edge have a denser compaction state than those at the leading edge and strongly affect the frictional slip. Figure 8(b) shows the maximum shear stress increases with increasing normal stress. The inci-dent P-wave induces a larger growth rate of released strain energy under a higher normal stress, which is reflected by the slope of the pre-peak portion of the shear stress-time response. When the released strain energy exceeds the fracture energy of sand contacts [25], ruptures at sand contacts gradually occur over the gouge layer and stored strain energy radiates as dynamic stresses. The more strain energy released from sand contacts under a higher normal stress, which is due to a larger growth rate of released strain energy, results in a larger max-imum shear stress.
Figure 9(a)shows the slip displacement as a function of normal stress. Both the maximum slip displacement and the slip velocity slightly decrease with increasing normal stress (Fig.9(b)). The released strain energy is mainly used for the detachment of sand contacts in the incident stage and the frictional slip in the slip stage. When the more strain energy is released for the detachment of sand contacts under a higher Fig. 7 Frictional slip in three stages under a normal stress of 6 MPa
normal stress and under the same energy input, the less re-leased strain energy remains for the frictional slip. The strain energy released for the frictional slip thus decreases under a higher normal stress, so the maximum slip displacement be-comes smaller. The opening of sand contacts under different normal stress exhibits an approximately identical duration, as shown in Fig. 9(a), the change of the slip velocity is thus proportional to the maximum slip displacement under increas-ing normal stress.
The effect of normal stress on the dynamic triggering of frictional slip is related to the compaction state of granular gouges. A higher normal stress induces a denser compaction state of granular gouges, resulting in larger released strain energy under external perturbations. This observation is sim-ilar to the previous results from the static triggering of fric-tional slip on filling gouges, such as the maximum shear stress of a fault zone under a static shear load increases with increas-ing normal stress [31]. The compaction state of filling gouges is thus importantly related to fault stability [2,32]. Addition-ally, we can observe that the frictional slip is partially recov-ered after a P-wave incidence (Fig.9(a)). It indicates that the
gouge layer is not completely failed and the maximum slip displacement does not reach the critical slip distance for seismic faulting [33].
Advantages and Limitations
The DIDS model performs a dynamic-induced frictional slip on a real rock discontinuity with a layer of granular gouges. The advantage of this technique includes: (a) characterization of dynamic shear stress radiation before and during the fric-tional slip; (b) observation the fricfric-tional slip on a layer of granular gouges under dynamic triggering without the effect of reflected waves.
One limitation is the inherent disadvantage of the direct-shear configuration. A small torque caused by a direct-shear load is unable to be eliminated. But the effect of non-uniformly distributed shear stresses on the dynamic triggering of fric-tional slip is interesting and useful to be considered when a rock discontinuity with a finite length is subjected to a limited normal load and a dynamic shear load. Additionally, the time duration of the slip stage is too short to observe the following
Fig. 9 Effect of normal stress on (a) dynamic shear stress-time response and (b) maximum slip displacement and slip velocity
Fig. 8 Dynamic shear stresses at the trailing edge under different normal stresses, (a) shear stress-time response and (b) maximum shear stress as a function of normal stress
frictional slip. A longer incident plate may be used to extend the duration of the slip stage in the future study. Furthermore, the low tensile strength of rock materials limits the loading rate of the incident P-wave.
Concluding Remarks
This study introduces a dynamic-induced direct-shear model to investigate the dynamic triggering of frictional slip on simulated granular gouges and to observe the dynamic shear stress radiation before and during the frictional slip. An inci-dent P-wave is generated from an impact event between the striker plate and the incident plate, propagates in the incident plate and induces the shear stress along a layer of granular gouges. The shear stress accumulates in the incident stage and the frictional slip occurs at the slip stage without the effect of the reflected wave. The experimental results show a non-uniform shear stress distribution along the layer of granular gouges, which may be caused by a shear load induced torque and normal stress vibration along the layer. The shear stress at the trailing edge influences the frictional slip along the P-wave loading direction, while the rebound stress at the leading edge propagates along the opposite direction. The frictional slip is initiated when the shear stress at the trailing edge reaches the maximum value.
The dynamic-induced direct-shear model provides a possi-ble solution to investigate the dynamic triggering of frictional slip on simulated granular gouges. Although there are some limitations to be improved, the dynamic triggering of friction-al slip can be clearly observed under a single wave triggering and without multiple wave incidences. The diagnostic methods could be improved in the future study to obtain more information during the triggering process, such as measuring normal stress vibration along the gouge layer by a group of load cells or by a high-speed camera.
Acknowledgments This work is sponsored by the Swiss National Science Foundation (200021_147176). The authors would like to thank Mr. J.-F. Mathier, Mr. L. Gastaldo and Mr. L.F. Morier of EPFL-LMR, for their assistance in the equipment set-up. The authors also would like to thank Mr. G. Gilles of EPFL-IBETON, for his assistance in the LabVIEW programming.
References
1. Gomberg J, Bodin P, Larson K, Dragert H (2004) Earthquake nucle-ation by transient deformnucle-ations caused by the M = 7.9 Denali, Alaska, earthquake. Nature 427:621–624
2. Johnson PA, Carpenter B, Knuth M, Kaproth BM, Le Bas PY, Daub EG, Marone C (2012) Nonlinear dynamic triggering of slow slip on simulated earthquake faults with implications to Earth. J Geophys Res 117, B04310
3. Dieterich JH (1979) Modeling of rock friction: 1. Experimetnal results and constitutive equations. J Geophys Res 84:2161–2168 4. Lockner DA, Okubo PG (1983) Measurements of frictional heating
in granite. J Geophys Res 88:4313–4320
5. Ben-David O, Cohen G, Fineburg J (2010) The dynamics of the onset of frictional slip. Science 330:211–214
6. Noda H, Kanagawa K, Hirose T, Inoue A (2011) Frictional experiments of dolerite at intermediate slip rates with controlled temperature: rate weakening or temperature weakening? J Geophys Res 116, B07306 7. Nielsen S, Taddeucci J, Vinciguerra S (2010) Experimental
observa-tion of stick–slip instability fronts. Geophys J Int 180:697–702 8. Xia K, Rosakis AJ, Kanamori H (2004) Laboratory earthquakes: the
sub-rayleigh-to-supershear rupture transition. Science 303:1859–1861 9. Dieterich JH (1981) Potential for geophysical experiments in large
scale tests. Geophys Res Lett 8:653–656
10. Byerlee J, Mjachkin V, Summers R, Voevoda O (1978) Structures developed in fault gouge during stable sliding and stick–slip. Tectonophysics 44:161–171
11. Shimamoto T, Logan JM (1981) Effects of simulated fault gouge on the sliding behavior of Tennessee sandstone: nonclay gouges. J Geophys Res 86:2902–2914
12. Gu Y, Wong TF (1994) Development of shear localization in simu-lated quartz gouge: effect of cumulative slip and gouge particle size. Pure Appl Geophys 146:387–423
13. Dieterich JM, Kilgore BD (1994) Direct observation of frictional contacts: new insights for state-dependent properties. Pure Appl Geophys 143:283–302
14. Bouissou S, Petit JP, Barquins M (1998) Experimental evidence of contact loss during stick–slip: possible implications for seismic be-havior. Tectonophysics 295:341–350
15. Mutlu O, Bobet A (2005) Slip initiation on frictional fractures. Eng Fract Mech 72:729–747
16. Linker MF, Dieterich JH (1992) Effects of variable normal stress on rock friction: observations and constitutive equations. J Geophys Res 97:4923–4940
17. Scott DR, Marone C, Sammis CG (1994) The apparent friction of granular fault gouge in sheared layers. J Geophys Res 99:7231–7246 18. Ohnaka M, Shen LF (1999) Scaling of the shear rupture process from nucleation to dynamic propagation: implications of geometric irreg-ularity of the rupturing surfaces. J Geophys Res 104:817–844 19. Rajagopalan S, Parkash V (1999) A modified torsional kolsky bar for
investigating dynamic friction. Exp Mech 39:295–303
20. Voisin C, Campillo M, Ionescu IR, Cotton F, Scotti O (2000) Dynamic versus static stress triggering and friction parameters: Interface from the November 23, 1980, Irpinia earthquake. J Geophys Res 105:21647–21659
21. Rubinstein SM, Cohen G, Fineburg J (2010) Detachment fronts and the onset of dynamic friction. Nature 430:1005–1009
22. Wu W, Zhu JB, Zhao J (2013) A further study on seismic response of a set of parallel rock fractures filled with soils. Geophys J Int 192:671–675 23. Johnson PA, Savage H, Knuth M, Gomberg J, Marone C (2008) Effects of acoustic waves on stick–slip in granular media and impli-cations for earthquakes. Nature 451:57–60
24. Johnson PA, Jia XP (2005) Nonlinear dynamics, granular media and dynamic earthquake triggering. Nature 437:871–874
25. Freund LB (1990) Dynamic fracture mechanics. Cambridge University Press, Cambridge
26. Ben-Zion Y, Sammis CG (2003) Characterization of fault zones. Pure Appl Geophys 160:677–715
27. Wu W, Zhu JB, Zhao J (2013) Dynamic response of a rock fracture filled with viscoelastic materials. Eng Geol 160:1–7
28. Perry CC (1969) Plane-shear measurement with strain gauges. Exp Mech 9:19N–22N
29. Boettcher MS, Marone C (2004) Effects of normal stress variation on the strength and stability of creeping faults. J Geophys Res 109, B03406
30. Xia K, Huang S, Marone C (2013) Laboratory observation of acoustic fluidization in granular fault gouge and implication for dynamic weak-ening of earthquake faults. Geochem Geophys Geosyst 14:1012–1022 31. Collettini C, Niemeijer A, Viti C, Smith SAF, Macone C (2011) Fault
structure, frictional properties and mixed-mode fault slip behavior. Earth Planet Sci Lett 311:316–327
32. van der Elst NJ, Brodsky EE, Le Bas PV, Johnson PA (2012) Auto-acoustic compaction in steady shear flow: experimental evidence for suppression of shear dilatancy by internal acoustic vibration. J Geophys Res 117, B09314
33. Marcon C, Kilgore B (1993) Scaling of the critical slip distance for seismic faulting with shear strain in fault zones. Nature 362:618–621