HAL Id: hal-03216354
https://hal.univ-lorraine.fr/hal-03216354
Submitted on 4 May 2021HAL is a multi-disciplinary open access
archive for the deposit and dissemination of sci-entific research documents, whether they are pub-lished or not. The documents may come from teaching and research institutions in France or abroad, or from public or private research centers.
L’archive ouverte pluridisciplinaire HAL, est destinée au dépôt et à la diffusion de documents scientifiques de niveau recherche, publiés ou non, émanant des établissements d’enseignement et de recherche français ou étrangers, des laboratoires publics ou privés.
Distributed under a Creative Commons Attribution| 4.0 International License
Novel Multi-isotope Tracer Approach To Test ZnO
Nanoparticle and Soluble Zn Bioavailability in Joint Soil
Exposures
Adam Laycock, Ana Romero-Freire, Jens Najorka, Claus Svendsen, Cornelis
van Gestel, Mark Rehkämper
To cite this version:
Adam Laycock, Ana Romero-Freire, Jens Najorka, Claus Svendsen, Cornelis van Gestel, et al.. Novel Multi-isotope Tracer Approach To Test ZnO Nanoparticle and Soluble Zn Bioavailability in Joint Soil Exposures. Environmental Science and Technology, American Chemical Society, 2017, 51 (21), pp.12756-12763. �10.1021/acs.est.7b02944�. �hal-03216354�
Novel Multi-isotope Tracer Approach To Test ZnO Nanoparticle and
Soluble Zn Bioavailability in Joint Soil Exposures
Adam Laycock,
*
,†,‡Ana Romero-Freire,
§,∥Jens Najorka,
⊥Claus Svendsen,
○Cornelis A. M. van Gestel,
#and Mark Rehkämper
††Department of Earth Science & Engineering, Imperial College London, London SW7 2AZ, United Kingdom ‡Department of Environmental Geosciences, University of Vienna, Vienna 1090, Austria
§Department of Soil Science, University of Granada, Avd. Fuente Nueva, 18002 Granada, Spain
∥Laboratoire Interdisciplinaire des Environnements Continentaux, UMR 7360 CNRS, Université de Lorraine, Campus Bridoux, Bâtiment IBISE, 8 rue du Général Delestraint, 57070 Metz, France
⊥Core Research Laboratories, Natural History Museum, Cromwell Road, London SW7 5BD, United Kingdom ○Centre for Ecology and Hydrology, Benson Lane, Wallingford, Oxford OX10 8BB, United Kingdom
#Department of Ecological Science, Faculty of Science, Vrije Universiteit, De Boelelaan 1085, 1081 HV Amsterdam, The Netherlands
*
S Supporting InformationABSTRACT: Here we use two enriched stable isotopes,68Znenand 64Zn
en (>99%), to prepare68ZnO nanoparticles (NPs) and soluble 64ZnCl
2. The standard LUFA 2.2 test soil was dosed with68ZnO NPs
and soluble64ZnCl
2to 5 mg kg−1each, plus between 0 and 95 mg
kg−1of soluble ZnCl2with a natural isotope composition. After 0, 1,
3, 6, and 12 months of soil incubation, earthworms (Eisenia andrei) were introduced for 72 h exposures. Analyses of soils, pore waters, and earthworm tissues using multiple collector inductively coupled plasma mass spectrometry allowed the simultaneous measurement of the diagnostic 68Zn/66Zn, 64Zn/66Zn, and 68Zn/64Zn ratios, from
which the three different isotopic forms of Zn were quantified. Eisenia andrei was able to regulate Zn body concentrations with no
difference observed between the different total dosing concentrations. The accumulation of labeled Zn by the earthworms showed a direct relationship with the proportion of labeled to total Zn in the pore water, which increased with longer soil incubation times and decreasing soil pH. The68Znen/64Znenratios determined for earthworms (1.09± 0.04), soils (1.09 ± 0.02),
and pore waters (1.08± 0.02) indicate indistinguishable environmental distribution and uptake of the Zn forms, most likely due to rapid dissolution of the ZnO NPs.
1. INTRODUCTION
The incorporation of engineered nanomaterials (ENMs) in commercial and industrial products and applications is associated with a wealth of benefits. The increasing prevalence of ENMs, and the assertion of several life-cycle assessments that these materials will enter natural systems,1,2 has prompted investigations into their environmental behavior, transport, and fate.3−5 Despite this, it is still unclear if any long-term implications associated with the use of ENMs exist, and there are still many knowledge gaps between nanotoxicity and nanosafety.6 For example, is observed nanospecific toxicity a relevant consideration at low and environmentally relevant levels and durations, and if so, what are the mechanisms of toxicity?6 Such understanding is necessary in order to use and dispose of ENMs responsibly and to inform their safe and effective design. To fill these gaps, it is necessary to perform investigations into the transformation and effects of ENMs in complex environmental systems using relevant dosing levels
and time spans. However, distinguishing and detecting ENMs once they have been introduced into complex natural matrices at environmentally relevant levels poses an analytical challenge.7 This has prompted the development of novel approaches to enable the investigation of ENMs and provide insights into potential nanospecific behavior.2,8−10
Investigations into the stable isotope compositions of commercially available ENMs have shown that they are isotopically indistinct from natural sources, and this approach therefore cannot be used for such materials.11,12 However, synthesizing ENMs from reagents enriched in a single stable isotope will result in them carrying a strong and distinct isotopic signature. Materials that are labeled in such a way can Received: June 8, 2017 Revised: September 7, 2017 Accepted: October 10, 2017 Published: October 10, 2017 Article pubs.acs.org/est
License, which permits unrestricted use, distribution and reproduction in any medium, provided the author and source are cited.
Downloaded via 88.127.95.218 on May 4, 2021 at 04:14:09 (UTC).
be easily identified using isotope ratio measurements, even when the background levels of the naturally occurring element are high.11 Laycock et al.13 have previously shown that the detection of isotopically enriched68Zn is possible even when it
contributes as little as 0.03‰ to the total Zn concentration of a sample. This is lower than the concentration increase anticipated in real-world scenarios based on the predicted environmental concentrations from modeling studies and typical natural background levels. For example, and of relevance to this study, Boxall et al.14estimate that if ZnO nanoparticles (NPs) used in sunscreens achieve 10% market penetration, then Zn concentrations of up to 3.2 mg kg−1originating from ENMs may be found in soils. Gottschalk et al.15proposed more conservative annualfluxes to sludge-treated soils of 3.25 μg of Zn kg−1y−1. This was revised down to 0.01μg of Zn kg−1y−1 by Sun et al.16based on recent work that provides an improved understanding of the pathways and transformations of ZnO NPs in the environment. In comparison, natural background levels of Zn in soils are typically much higher than this. For example, a British soil survey for a range of land types in the U.K. found Zn levels in the range of 2.5−2120 mg kg−1.17The approach of stable isotope labeling and tracing is therefore currently one of the few techniques capable of detecting the low contributions of NP-derived Zn estimated by probabilistic modeling studies.
Previous investigations using isotopically labeled nanoma-terials typically involved several parallel exposures, where each exposure introduced the isotope label in a different form (e.g., as NPs, bulk particles, dissolved ions, etc.).8,10,13,18 Any nanospecific behavior can then be elucidated by comparing pathways, partitioning, and bioavailabilities of the various forms of labeled material.
There has been a call for more chronic low-concentration studies to test and validate the nanospecific behavior observed in numerous acute studies performed at elevated concen-trations.16,19The work performed here builds on the protocols previously developed for the tracing of isotopically labeled material and presents data from an NP exposure performed at environmentally relevant levels and with long soil incubation times.8,13,18 The importance of performing more long-term studies at environmentally realistic levels is being recognized, and this is reflected in the number of studies being performed at environmentally relevant levels. This can present analytical challenges, especially for ubiquitous elements such as Zn, which have high and highly variable concentrations in natural materials. In this study two sources of isotopically distinct Zn were applied within a single exposure to trace multiple forms of the element in the earthworm Eisenia andrei exposed for 72 h to dosed soils that had been aged for up to 12 months.
2. MATERIALS AND METHODS
2.1. Materials and Reagents. The natural standard test soil LUFA 2.2 (Speyer, Germany) was selected as the exposure media. Two lots of Zn metal powder, isotopically enriched to >99% in68Zn and64Zn from their natural abundances of 18.5%
and 49.2%, respectively, were purchased from Isoflex, U.S.A.; these are hereafter referred to as 68Znen and 64Znen. Zinc
chloride,≥98% pure, with a natural isotope composition, was purchased from Merck. AnalaR grade 14.5 M HNO3and 6 M
HCl were purified by sub-boiling distillation in quartz stills. Milli-Q water of >18 MΩ cm quality (Millipore, U.K.) and 30% Suprapur H2O2(VWR, U.K.) were used throughout.
2.2. Synthesis and Characterization of68ZnO NPs and 64ZnCl
2. The68Znenmetal powder wasfirst converted to68Zn
acetate by dissolving in acetic acid followed by evaporation to dryness. A solution was prepared by dissolving 100 mg of the
68Zn acetate in 50 mL of diethylene glycol (DEG) and heating
to 180°C, upon which 100 μL of Milli-Q was added to the solution to force hydrolysis and precipitate 68ZnO NPs.8,13,20
The 64Zn2+ solution was prepared by dissolving the 64Zn en
metal in HCl before evaporating to dryness to leave a64ZnCl2
salt, which was then dissolved in 0.01 M HNO3to produce a
stable solution. A Zn2+ solution with a natural isotope
composition was prepared by dissolving the ZnCl2 salt purchased from Merck in Milli-Q water.
The size and morphology of the 68ZnO NPs were determined using transmission electron microscopy (TEM) image analysis and dynamic light scattering (DLS), while X-ray diffraction (XRD) was applied to confirm the crystal structure of the particles. The final solution and suspension concen-trations and isotope compositions of the isotopically labeled materials were confirmed using a Nu Plasma Multi-collector (MC-ICP-MS).
2.3. Soil Spiking. For the dosing of test soils, 2.1 kg of LUFA 2.2 soil was sequentially spiked to dry soil Zn concentrations of 5 mg kg−1for both68ZnO NPs and64Zn2+, and hence a target68Zn
en/64Znen soil ratio of 1. To achieve a
homogeneous distribution, the soil was intensively mixed with a spoon for 5 min after dosing. Once mixed, the soil was divided into 6 splits of 350 g of dry soil equivalent. Tofive of the six splits, different amounts of the Zn2+ solution with a natural isotope composition were added. This resulted in six test soils with ratios of added ionic Zn to NP Zn (Zn2+/NP-Zn) of 1, 1.5,
2, 3, 6, and 13. Soils were then brought to a moisture content of 22% (w/w), equal to 50% of the soil water holding capacity (WHC), and thoroughly mixed. Control soil, taken from the same batch of LUFA 2.2 soil, with added water only and solvent control soil spiked with an amount of DEG and 0.01 M HNO3 equivalent to the Zn treatments were also included.
The soils were transferred into 850 mL glass jars, loosely covered with a lid, and incubated in a climate room at 20± 1 °C, 75% relative humidity, and a 12/12 h dark/light cycle. Once every 2−3 weeks, soil moisture content was adjusted by replenishing water loss (by weighing the containers).
2.4. Earthworm Exposures. After 1 day, and 1, 3, 6, and 12 months of soil incubation, earthworms of the species Eisenia andrei were exposed in triplicate to each of the test soils. A 72 h exposure period was used because this provides enough time to permit sufficient uptake with minimal disruption to the soil by the earthworms. Adult earthworms with a well-developed clitellum were taken from the age-synchronized culture of the Department of Ecological Science of the Vrije Universiteit Amsterdam and acclimatized in clean LUFA 2.2 soil for 6−8 h before being introduced into the test soils. The earthworms were rinsed with demineralized water, blotted dry on filter paper, and individually weighed before being randomly assigned to a treatment. Hence, a group of 30 earthworms were selected for exposure after each period of soil incubation, with 5 groups of 30 used during the whole study. The average weight and standard deviation of these groups ranged between 427± 89 mg and 598 ± 86 mg. After exposure, the earthworms were collected from the test soils, washed, blotted dry, weighed, incubated on moist filter paper for 24 h, based on OECD guideline 317,21to void their gut contents, and weighed again.
Environmental Science & Technology Article
DOI:10.1021/acs.est.7b02944
Environ. Sci. Technol. 2017, 51, 12756−12763 12757
The worms were then frozen and freeze-dried before being prepared for analysis.
2.5. Pore Water and Soil Sampling. Pore waters were extracted from 30 g soil portions that were taken from the treatments immediately after dosing and after 1, 3, 6, and 12 months of incubation. The soil portions were moistened to 100% WHC (saturation) and equilibrated for 4 days at 20°C in the dark. Pore water was collected by centrifuging the soils for 50 min at 2000g over a 0.45μm membrane filter (Whatman NC45 Ø 47 mm) in between two roundfilters (Whatman no. 1; Ø 47 mm, pore size 11 μm), following the procedure of Hobbelen et al.22 To obtain a particulate-free pore water fraction, half the pore water sample was then centrifuged in a 3 kDa ultrafiltration device (Amicon Ultra-15 Filters, Millipore) for 45 min at 3000g. The pH of the pore waters was measured after extraction. Soil samples were collected for each treatment and control soil immediately after dosing by removing 2−3 g of the test soil and freeze-drying.
2.6. Sample Preparation. The soil, earthworm, and pore water samples were prepared for analysis by first obtaining sample solutions using microwave digestion using a previously established method.8,13 For the soil and pore water samples, ∼500 mg aliquots were used; for the earthworms, whole freeze-dried individuals were processed (42−100 mg; average freeze-dried weight 68 mg). Once weighed, 7 mL of 14.5 M HNO3 and 3 mL of H2O2were added to the vessels and left at room
temperature overnight before digestion in an Analytix Ethos Microwave unit. After digestion, samples were centrifuged to remove any undissolved silicate material. The sample solutions were subsequently processed by anion-exchange chromatog-raphy to isolate the Zn from the other matrix elements and obtain a pure Zn fraction (full details provided in the
Supporting Information), which was suitable for high-precision isotope analysis by MC-ICP-MS.23
2.7. Isotope Analysis and Data Reduction. The diagnostic isotope ratios 68Zn/66Zn, 68Zn/64Zn, and
68Zn/64Zn were determined with a Nu Instruments Nu Plasma
HR MC-ICP-MS using a previously outlined approach.18The measured Zn isotope ratios in a given sample are the result of the relative contributions of the three Zn end members: natural Zn, 68Znen, and 64Zen. This is demonstrated for the measured 68Zn/66Zn ratio (68/66R) ineq 1:
= × + × + × × + × + × R (fr Ab ) (fr Ab ) (fr Ab )
(fr Ab ) (fr Ab ) (fr Ab )
68/66 nat 68 nat 68en 68 68en 64en 68 64en
nat nat 66 68en 68en 66 64en 64en 66 (1) Here, frxxxx and xxAb
xxxx correspond to the fractional molar
abundance of the corresponding isotopic form of Zn relative to total Zn in the sample, and the relative isotopic abundance of the corresponding isotope in the isotopic form of Zn, respectively. The superscript before the relative isotopic abundance refers to the Zn isotope, while the subscript after each component identifies the isotopic form, whereby XXnat, XX68en, and XX64en correspond to Zn with an isotope
composition of natural Zn, 68Zn
en, and 64Znen, respectively.
For example,68Ab64enrefers to the isotopic abundance of68Zn
in64Zn
enand fr64enrefers to the fractional molar abundance of 64Zn
enrelative to the total Zn of the sample.Equation 1can be
recast for any of the other diagnostic isotope ratios.
The relative contributions of the three isotopic forms of Zn in a sample may be found by first assuming that frnat is 1.
Equation 1may then be recast with fr68enand fr64en, the molar fractions of the two enriched forms of Zn, being exchanged for
xfr
68en and xfr64en to represent the relative contributions of 68Zn
en and64Znenwhen frnatis 1.
× − = − × + − × (( R Ab ) Ab ) f r ( Ab ( R Ab )) f r ( Ab ( R Ab )) x x 68/66 nat 66 nat 68 68en 68en 68 68/66 68en 66
64en68 64en 68/66 66 64en (2) The right-hand side of eq 2 has two unknown parameters,
xfr
68enandxfr64en. These same two unknown parameters can be
represented in this way for each of the diagnostic isotope ratios. Using the solver add-in for Microsoft Excel, it is possible to determine the only solution forxfr
68enandxfr64enthat can satisfy
all equations. Once xfr
68en and xfr64en have been determined, the relative
proportions of each isotopic form in a sample can be readily calculated usingeqs 3−5:
= + + fr 1 1 xf r xf r nat 68en 64en (3) = + + fr f r 1 f r f r x x x 68en 68en 68en 64en (4) = + + fr f r 1 f r f r x x x 64en 64en 68en 64en (5)
Once the relative contributions of the three Zn end members are known, the abundance of each Zn isotope in a sample can be calculated and the isotope composition determined. The abundance of each isotope may be calculated as demonstrated in eq 6 for the isotopic abundance of 66Zn in a sample (66Ab sam): = × + × + × Ab (fr Ab ) (fr Ab ) (fr Ab ) sam 66 nat nat 66 68en 68en 66 64en 66 64en (6)
When the Zn isotope composition of a sample has been established, it is possible to quantify the absolute amount of each form of isotopically distinct Zn present in that sample. First, the absolute molar amount of the 66Zn isotope in a sample is determined using conventional methods for quantification that employ elemental standards to define a calibration curve. The absolute molar amount of Zn in the sample is then established by multiplying by the relative abundance of66Zn in the sample as found ineq 6. The molar
amount of each isotopically distinct Zn form can then be found by multiplying the total molar amount of Zn in the sample by the fractional contribution of the corresponding isotopic form of Zn. This molar amount can then be divided by the molar mass of the isotopic form of Zn to give the total mass, from which the concentration is determined by dividing by the weight of the sample measured before digestion. The Zn isotope compositions of the controls were analyzed as an internal reference material against the standard reference material “London Zn”, and the expected natural values were obtained in all measurements.23A summary of the measured diagnostic Zn ratios and the derived concentrations for the different forms of isotopically distinct Zn is given inTable S1.
3. RESULTS
3.1. Labeled Materials. The TEM images of the 68ZnO
NPs show the particles were highly uniform in size and shape
with a typical particle size in the range of 5−15 nm (Figure S1). The DLS analysis was in good agreement, showing an average hydrodynamic diameter of 18.4 nm and a polydispersity index of 0.06 (Figure S1). The 68ZnO NPs were thereby fully consistent with particles synthesized using the same method in previous studies.8,13,18,20 The XRD analysis confirmed the presence of ZnO particles with a hexagonal crystal structure (space group P63mc). The large broad peak at 23.5°2Theta, on
which the ZnO pattern is superimposed, is from the DEG medium, as confirmed by analysis of DEG only (Figure S1).
3.2. Soil. The measured total Zn, natural Zn, 68Zn en, and 64Zn
en concentrations of the soils sampled after dosing are
presented inTable S1. The target concentration of 5 mg kg−1 for both isotope labels was sufficiently matched, with an average enriched Zn concentration of 6.3± 1.4 mg kg−1(sd, n = 12) and measured levels of between 4.86 and 8.54 mg kg−1(Table S1). The 68Zn
en/64Znen ratio of the test soils is much more
consistent, with all values in the range of 1.05−1.11 (Figure 1B). To enable a direct comparison of the test soil concentrations, biasing introduced by soil heterogeneity was removed through normalization. This was achieved by assuming that the two isotopically enriched Zn forms were mixed equally within the 2.1 kg of test soil. To this end, the measured68Znenconcentrations of all soils were normalized to
the value determined for test soil 1 (5.58 mg kg−1;Table S1), and the same correction factor was then applied to the measured concentrations of64Zn
enand natural Zn (Figure 2).
As no natural Zn was added to test soil 1, the measured natural Zn in this soil was assumed to be representative for the background Zn concentration of the test soil. Therefore, the natural ionic Zn added to the remaining test soils was determined by subtracting the natural Zn concentration found in test soil 1 from the total normalized natural Zn concentration in each of the other test soils (Figure 2,Table S1). As a consequence of soil sampling, the initial wet soil mass of 397 g was reduced to 277 g for the final exposure, but considering the low biomass that was added to these soils (3 earthworms), this is not expected to have an impact on earthworm behavior or Zn uptake.
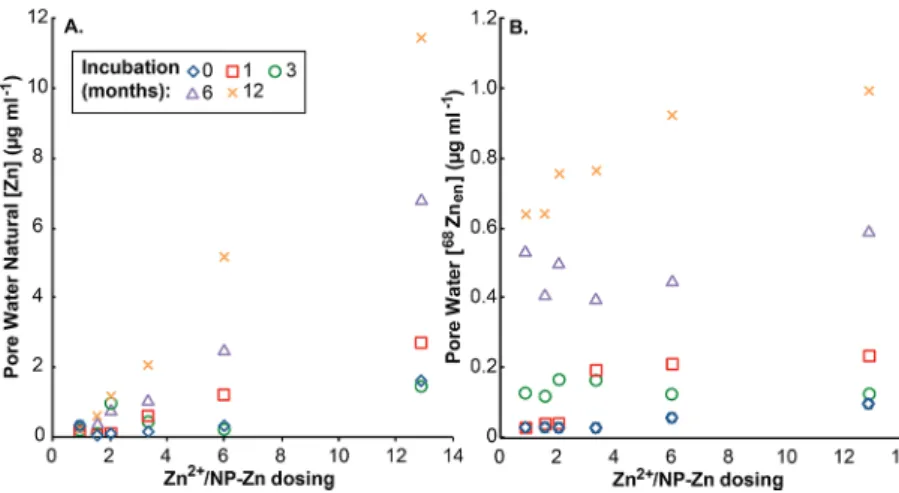
3.3. Pore Waters. Figure 3 shows the concentrations of natural Zn and68Zn
enmeasured for the pore waters; these data
reveal direct correlations between Zn concentrations and total
dosing levels and incubation times. For example, the pore water with the highest Zn concentration of 11.5 μg mL−1 was obtained for the soil with the highest Zn2+/Zn-NP ratio of 13, and that was incubated for 12 months (Figure 3a) (Table S1). Essentially identical concentrations of the three Zn forms were determined for thefiltered and unfiltered pore water samples. The average 68Znen/64Znen ratio for all pore water samples is
1.08± 0.02 (sd, n = 46) (Figure 1B).
After 3 and 6 months, the pore water pH was slightly higher for all treatments that received DEG than in the water control, but after 12 months the difference was negligible (Table S3). Pore water pH showed a gradual decrease with time, which was most pronounced at the highest Zn treatment level (almost one unit).
3.4. Earthworms. The exposure performed after 1 day of soil incubation was the only occasion during this study when the earthworms displayed abnormal behavior by avoiding burrowing in soils dosed with DEG. The earthworms exposed to these soils also showed the largest mass loss and increased their weight when incubated on filter paper to void their gut content. The earthworms exposed to the water-only control test soil and all earthworms exposed to test soils incubated for a month or more lost a normal amount of weight, considering that they came from a rich culture with abundant food and were exposed in a sandy soil without any food added (Figure S2). Figure 1.68Zn
en/64Znenratio of earthworms (Eisenia andrei) after 72 h exposures (error bars are the standard deviation of three individuals) (A), as well as pore water samples collected after different soil incubation periods and soils (B). For the experiment, the LUFA 2.2 soil was dosed with 68ZnO NPs,64ZnCl
2, and natural ZnCl2at variable Zn2+/ZnO NP (Zn2+/NP-Zn) ratios. The incubation time after dosing of the soils varied between 1 day (0 months) and 12 months. The soil samples were collected immediately after dosing and mixing.
Figure 2.Normalized concentrations of added 68Zn
en (from 68ZnO NPs),64Zn
en(from64Zn2+), and natural Zn (from Zn2+) in LUFA 2.2 test soils.
Environmental Science & Technology Article
DOI:10.1021/acs.est.7b02944
Environ. Sci. Technol. 2017, 51, 12756−12763 12759
The abnormal burrowing behavior of earthworms in the exposure performed after 1 day of soil incubation is reflected in the accumulated concentrations of the isotopically enriched forms of Zn, which are much lower, in the range of 0.4−3.8 μg g−1, in comparison to subsequent exposures where the accumulated concentrations are in the range of 2.9−18.4 μg g−1(Figure 4B). The earthworms from thisfirst exposure are also the only samples from the study to show slightly elevated, and variable,68Zn
en/64Znenratios of 1.02−1.27 (Figure 1A). In
contrast, the earthworms collected from the exposures after longer incubation periods display very similar trends.
The total Zn levels for the earthworms remained consistent for all exposures and incubation times (Figure 4A) at between 81 and 143 μg g−1. The 68Zn
en/64Znen ratio observed for all
earthworms, except those exposed to test soils after only 1 day of incubation, were also very consistent with values of 1.03− 1.15 (Figure 1A). The highest accumulation of68Znen(and by
inference64Znen) is shown by earthworms exposed to test soils
for which the enriched Zn forms contributed the largest proportion to the total added Zn pool of the soil (Figure 4B).
Figure 4B furthermore reveals that the amount of labeled Zn accumulated by the earthworms increased slightly for longer
incubation periods, and this is particularly apparent for exposures where only little natural Zn2+was added.
4. DISCUSSION
4.1. Soil and Pore Water. The increasing levels of added natural Zn observed in the test soils correspond with increases in the targeted Zn2+/NP-Zn ratio, suggesting that the overall
dosing was achieved as intended (Table S1, Figure 2). The observed variability in the absolute labeled Zn concentrations of the soils is hence not thought to result from inappropriate or erroneous dosing but is most likely a consequence of (i) the low dosing levels, (ii) the inherent heterogeneity of the soil, and (iii) the small aliquots taken for sampling (∼0.5 g). This is a reasonable conclusion, considering that the whole test soil batch was initially dosed with the two forms of enriched Zn and thoroughly mixed before being divided into separate splits. The
68Zn
en/64Znen ratio measured for all individual soil splits was
nearly constant with an average value of 1.09± 0.02 (sd, n = 6) (Figure 1B,Table S1), which indicates that the absolute dosing was marginally higher for the 68Zn
en than for the 64Znen.
Although soil samples were only taken at the start of the Figure 3.Concentrations of natural Zn (A) and68Zn
en(B) of pore waters extracted from the LUFA 2.2 test soils following spiking of the soils with 68ZnO NPs,64ZnCl2, and natural ZnCl2at variable Zn2+/ZnO NP ratios. The incubation time after dosing of the soils varied between 1 day (0 months) and 12 months. Note that the 64Znen data (not shown) display the same trend as the68Znen concentrationsthis follows from the essentially constant68Znen/64Znenratios of the pore waters (Figure 1B).
Figure 4.Total Zn (A) and68Znen(B) concentrations of earthworms (Eisenia andrei) exposed for 72 h in LUFA 2.2 soils following spiking of the soils with68ZnO NPs,64ZnCl2, and natural ZnCl2at variable Zn2+/ZnO NP ratios. The incubation time after dosing of the soils varied between 1 day (0 months) and 12 months. Error bars denote the standard deviation for analyses of three individuals. Note that the64Znendata (not shown) display the same trend as the68Znenconcentrationsthis follows from the essentially constant68Znen/64Znenratios of the earthworms (Figure 1A).
experiment, removal of Zn from the soils was only by the sampling of exposed earthworms, which showed the same
68Zn
en/64Znen ratio of 1.09 ± 0.04 (sd, n = 90). An identical 68Zn
en/64Znen ratio of 1.08 ± 0.02 (sd, n = 46) was also
determined for the pore water samples. It is therefore reasonable to assume that the overall isotope composition of the soil did not change with increasing soil incubation time and that the employed procedure of normalizing the measured soil Zn concentrations (Figure 2) is appropriate for removing bias introduced by the soil heterogeneity.
The increasing Zn concentrations of extracted pore waters with incubation time can be explained by the slow and continuous release of Zn from soil surfaces (Figure 3), due to the decreasing soil pH (Table S3). The latter, in turn, may be related to the repeated activation of microbial activity in the soils due to the earthworm exposure events. The observation that the pH in the control soil was consistently lower than the pH of the test soils that received DEG suggests that the presence of the latter may have also had an impact on the microbial community, which in turn influenced the pH. The difference in pH between the control soil and DEG-treated soils decreased with increasing incubation time, and this indicates that the DEG degraded in the soil. After the initial dosing, all forms of Zn were probably highly reactive, leading to bonding with soil particles and organic matter in the test soil. Following this, all isotopic forms of Zn will have exchanged between the pore water and soil. The observation that a stable Zn concentration was not achieved in the extracted pore waters thereby suggests that the exchange did not attain a stable equilibrium state in the 12-month duration of the study (Figure 3A).
The highest concentrations of isotopically enriched Zn were observed in the pore waters extracted from test soils for which the total Zn dosing was highest (Figure 3B). This suggests that all isotopic forms of Zn competed equally for reactive binding sites in the soil. Consequently, a lower proportion of the isotopically labeled Zn interacted with surfaces and a higher proportion was associated with the pore water in the test soils where the total Zn loading was greater (Figure 3B). This conclusion is supported by the relatively invariable
68Zn
en/64Znen ratios seen across all samples, in accord with
no distinguishable difference in the environmental or partitioning behavior of the 68ZnO NPs and ionic 64Zn2+
(Figure 1). The observation that no differences in Zn concentrations were observed for filtered pore water relative to unfiltered samples suggests that all Zn associated with the pore waters was present in dissolved form. This, in turn, implies that at these low concentrations the68ZnO NPs undergo rapid
dissolution shortly after dosing, thereby releasing 68Zn2+ions, which display identical behavior to the other isotopic forms introduced as ionic Zn2+. The susceptibility of ZnO NPs to
dissolution has been demonstrated in other studies, and such transformations will limit the persistence of ZnO NPs.24,25 Under conditions where dissolution is likely to be rapid and not limited, it may hence be reasonable to focus on the toxicity of Zn2+ ions for risk and hazard assessments, especially when
considering long-term effects.
4.2. Earthworms. The abnormal burrowing behavior observed for earthworms exposed to the test soils 1 day after dosing is likely due to the presence of DEG, which was introduced into the soil at a concentration of∼7.5 g kg−1. A Canadian soil-quality guideline determined a mortality of 25%
for the earthworm Eisenia fetida when exposed to 20 g kg−1of ethylene glycol, which has a very similar molecular structure to DEG. This supports the suggestion that the presence of DEG had an impact on earthworm behavior but did not result in mortalities.26In contrast, the pH of the soil (Table S3) is not anticipated to have impacted the earthworms or caused the abnormal burrowing behavior. This is supported by the work of van Gestel et al.,27who showed that Eisenia andrei can tolerate relatively low pH values, whereby reproduction was signifi-cantly reduced only at a pH of 4.2 relative to the control pH of 6.0.
The earthworms exposed after 1 day of soil incubation had an average 68Znen/64Znen ratio of 1.14 ± 0.06 (sd, n = 18),
which is identical within uncertainty to the average
68Zn
en/64Znen ratio of 1.07 ± 0.03 (sd, n = 72) for all the
other earthworm samples (Figure 1A). The larger uncertainty for the68Zn
en/64Znen ratio of the earthworms exposed after 1
day of soil incubation is thereby likely a consequence of the lower total enriched Zn concentrations accumulated in the earthworms (Figure 4B).
The earthworms exposed to soils incubated for a month or more did not show unusual weight loss or burrowing behavior (Figure S2), most likely because the added DEG, which was responsible for the deterrent effects, had degraded over this time period. The 68Zn
en/64Znen ratios of the exposed
earth-worms, 1.09± 0.04 (sd, n = 90), are thereby fully consistent with the results for the soils, 1.09± 0.02 (sd, n = 6), and pore waters, 1.08± 0.02 (sd, n = 46) (Figure 1). This indicates that the partitioning behavior and bioavailability of the 68Zn
en and 64Zn
enare indistinguishable over these longer time periods. For
each set of exposures performed, the highest accumulation of
68Zn
en and64Znen was always observed in the test soil dosed
with the lowest total amount of Zn (Figure 4B). This is because all three isotopic forms of Zn were equally bioavailable to the earthworms. As a consequence, earthworms from test soils where the enriched forms of Zn made up a larger proportion of the total Zn budget accumulated more isotopically enriched Zn. Similarly, the lowest levels of accumulated 68Zn
en and 64Znen
were seen in earthworms exposed to test soils dosed with the highest total amount of Zn, where the added68Znenand64Znen
contributed a much smaller proportion to the total Zn available to the earthworms (Figure 4B). The total Zn concentrations of the earthworms was highly consistent in this study, 104± 20 μg g−1(sd, n = 90), which is in the expected range when incubated in LUFA 2.2 soil.28,29These observations, and thefinding that the total Zn concentrations of earthworms from all exposures were highly consistent (Figure 4A,Table S1), indicate that the earthworms were able to regulate their Zn body burden to normal levels and both forms of added Zn were handled similarly.
Slightly higher levels of accumulated68Zn
enand64Znenwere
observed in earthworms exposed to test soils that had been incubated for longer periods of time (Figure 4B). This suggests that the Zn added to the soils became more bioavailable to the earthworms with increased incubation time. Thisfinding is in agreement with the pore water results, which reveal higher Zn concentrations with increasing incubation time (Figure 3).
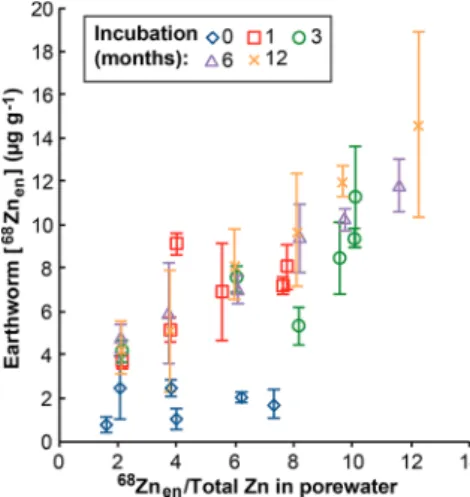
Figure 5 furthermore demonstrates that earthworms showed greater accumulation of68Znenwhen exposed to test soils with
larger proportions of68Zn
enin the total Zn pool of pore waters.
This suggests that, with longer incubation periods and associated soil aging and enhanced by the decreasing soil pH,
Environmental Science & Technology Article
DOI:10.1021/acs.est.7b02944
Environ. Sci. Technol. 2017, 51, 12756−12763 12761
more Zn was released to the pore waters from soil surfaces. The dissolved Zn in the pore water was subsequently more readily available to the earthworms than soil-adsorbed Zn, resulting in slightly higher uptake.
The use of multiple enriched isotopes of a common element is shown to be an extremely powerful tool for tracing different forms of the same element within a single experimental system at low and environmentally relevant concentrations. The ability to trace multiple forms of the same element in a single sample offers clear advantages. In particular, the number of analyzed samples can be effectively doubled, as parallel exposures for different forms of Zn are not required. Furthermore, the tracing of multiple Zn forms in a single system or organism provides results that are directly comparable, without complications that may arise from biological variability between different individuals or systems. The results of our exposures demonstrate that the environmental behavior and availability of ionic and nanoparticulate Zn introduced to test soils at environmentally relevant levels is indistinguishable over a 12-month period. The most likely explanation for thesefindings is the rapid dissolution of the ZnO NPs, resulting in behavior that is essentially equivalent to ionic Zn. This conclusion suggests that risk assessments should consider that ZnO NPs provide readily available Zn2+ ions.
■
ASSOCIATED CONTENT*
S Supporting InformationThe Supporting Information is available free of charge on the
ACS Publications websiteat DOI:10.1021/acs.est.7b02944. Summary of the measured diagnostic Zn ratios and derived concentrations for the three different isotopically distinct forms of Zn; outline of the anion-exchange chromatography procedure used to isolate Zn from the matrix elements; XRD, DLS, and TEM image character-ization graphs and images used for the charactercharacter-ization of the ZnO NPs; plotted weight changes of the earthworms used in this study; summary of the pore water pH data (PDF)
■
AUTHOR INFORMATION Corresponding Author *E-mail:adam.laycock@univie.ac.at. ORCID Adam Laycock:0000-0001-9480-5149 NotesThe authors declare no competingfinancial interest.
■
ACKNOWLEDGMENTSKatharina Kreissig and Barry Coles of the Imperial College MAGIC Laboratories and Rudo Verweij at the Vrije Universiteit are thanked for their technical assistance. The authors would also like to thank the three anonymous reviewers for their constructive comments. The work was in part supported by NERC grant NE/L004968/1, the EU FP7 project GUIDEnano (EU-CP-FP7604387), and the EU H2020 project NanoFASE under Grant Agreement no. 646002 (2015−2019) (H2020-NMP-2014).
■
REFERENCES(1) Caballero-Guzman, A.; Sun, T.; Nowack, B. Flows of engineered nanomaterials through the recycling process in Switzerland. Waste Manage. 2015, 36, 33−43.
(2) Mitrano, D. M.; Motellier, S.; Clavaguera, S.; Nowack, B. Review of nanomaterial aging and transformations through the life cycle of nano-enhanced products. Environ. Int. 2015, 77, 132−147.
(3) Handy, R. D.; Owen, R.; Valsami-Jones, E. The ecotoxicology of nanoparticles and nanomaterials: current status, knowledge gaps, challenges, and future needs. Ecotoxicology 2008, 17 (5), 315−325.
(4) Valsami-Jones, E.; Lynch, I. How safe are nanomaterials? Science 2015, 350 (6259), 388−389.
(5) Wagner, S.; Gondikas, A.; Neubauer, E.; Hofmann, T.; von der Kammer, F. Spot the difference: engineered and natural nanoparticles in the environment–release, behavior, and fate. Angew. Chem., Int. Ed. Engl. 2014, 53 (46), 12398−12419.
(6) Hu, X. G.; Li, D. D.; Gao, Y.; Mu, L.; Zhou, Q. X. Knowledge gaps between nanotoxicological research and nanomaterial safety. Environ. Int. 2016, 94, 8−23.
(7) Nowack, B.; Baalousha, M.; Bornhoft, N.; Chaudhry, Q.; Cornelis, G.; Cotterill, J.; Gondikas, A.; Hassellov, M.; Lead, J.; Mitrano, D. M.; von der Kammer, F.; Wontner-Smith, T. Progress towards the validation of modeled environmental concentrations of engineered nanomaterials by analytical measurements. Environ. Sci.: Nano 2015, 2 (5), 421−428.
(8) Khan, F. R.; Laycock, A.; Dybowska, A.; Larner, F.; Smith, B. D.; Rainbow, P. S.; Luoma, S. N.; Rehkämper, M.; Valsami-Jones, E. Stable isotope tracer to determine uptake and efflux dynamics of ZnO Nano-and bulk particles Nano-and dissolved Zn to an estuarine snail. Environ. Sci. Technol. 2013, 47 (15), 8532−9.
(9) Montano, M. D.; Lowry, G. V.; von der Kammer, F.; Blue, J.; Ranville, J. F. Current status and future direction for examining engineered nanoparticles in natural systems. Environ. Chem. 2014, 11 (4), 351−366.
(10) Yin, Y.; Tan, Z.; Hu, L.; Yu, S.; Liu, J.; Jiang, G. Isotope tracers to study the environmental fate and bioaccumulation of metal-containing engineered nanoparticles: techniques and applications. Chem. Rev. 2017, 117 (5), 4462−4487.
(11) Larner, F.; Rehkämper, M. Evaluation of stable isotope tracing for ZnO nanomaterials - new constraints from high precision isotope analyses and modeling. Environ. Sci. Technol. 2012, 46 (7), 4149−58. (12) Laycock, A.; Coles, B.; Kreissig, K.; Rehkämper, M. High precision 142Ce/140Ce stable isotope measurements of purified materials with a focus on CeO2 nanoparticles. J. Anal. At. Spectrom. 2016, 31 (1), 297−302.
(13) Laycock, A.; Diez-Ortiz, M.; Larner, F.; Dybowska, A.; Spurgeon, D.; Valsami-Jones, E.; Rehkämper, M.; Svendsen, C. Figure 5. Concentration of 68Znen for earthworms (Eisenia andrei)
exposed for 72 h in LUFA 2.2 soils following spiking of the soils with 68ZnO NPs, 64ZnCl2, and natural ZnCl2 at variable Zn2+/ZnO NP ratios. The incubation time after dosing of the soils varied between 1 day (0 months) and 12 months. The68Zn
endata are plotted versus the proportion of68Zn
enrelative to total Zn measured in the pore waters extracted from the test soils. Error bars denote the standard deviation for analyses of three individuals.
Earthworm uptake routes and rates of ionic Zn and ZnO nanoparticles at realistic concentrations, traced using stable isotope labeling. Environ. Sci. Technol. 2016, 50 (1), 412−419.
(14) Boxall, A.; Chaudhry, Q.; Sinclair, C.; Jones, A.; Aitken, R.; Jefferson, B.; Watts, C. Current and future predicted environmental exposure to engineered nanoparticles; Central Science Laboratory, Department of the Environment and Rural Affairs: London, U.K., 2007; http://randd.defra.gov.uk/Document.aspx?Document= CB01098_6270_FRP.pdf.
(15) Gottschalk, F.; Sonderer, T.; Scholz, R. W.; Nowack, B. Modeled environmental concentrations of engineered nanomaterials (TiO(2), ZnO, Ag, CNT, Fullerenes) for different regions. Environ. Sci. Technol. 2009, 43 (24), 9216−22.
(16) Sun, T. Y.; Gottschalk, F.; Hungerbuhler, K.; Nowack, B. Comprehensive probabilistic modelling of environmental emissions of engineered nanomaterials. Environ. Pollut. 2014, 185, 69−76.
(17) Spurgeon, D. J.; Rowland, P.; Ainsworth, G.; Rothery, P.; Long, S.; Black, H. I. Geographical and pedological drivers of distribution and risks to soil fauna of seven metals (Cd, Cu, Cr, Ni, Pb, V and Zn) in British soils. Environ. Pollut. 2008, 153 (2), 273−83.
(18) Larner, F.; Dogra, Y.; Dybowska, A.; Fabrega, J.; Stolpe, B.; Bridgestock, L. J.; Goodhead, R.; Weiss, D. J.; Moger, J.; Lead, J. R.; Valsami-Jones, E.; Tyler, C. R.; Galloway, T. S.; Rehkämper, M. Tracing bioavailability of ZnO nanoparticles using stable isotope labeling. Environ. Sci. Technol. 2012, 46 (21), 12137−45.
(19) Ma, H.; Williams, P. L.; Diamond, S. A. Ecotoxicity of manufactured ZnO nanoparticles–a review. Environ. Pollut. 2013, 172, 76−85.
(20) Dybowska, A. D.; Croteau, M. N.; Misra, S. K.; Berhanu, D.; Luoma, S. N.; Christian, P.; O’Brien, P.; Valsami-Jones, E. Synthesis of isotopically modified ZnO nanoparticles and their potential as nanotoxicity tracers. Environ. Pollut. 2011, 159 (1), 266−73.
(21) OECD. Test No. 317: Bioaccumulation in Terrestrial Oligochaetes; Organization for Economic Co-operation and Development: Paris, 2010.
(22) Hobbelen, P. H.; Koolhaas, J. E.; Van Gestel, C. A. Risk assessment of heavy metal pollution for detritivores in floodplain soils in the Biesbosch, The Netherlands, taking bioavailability into account. Environ. Pollut. 2004, 129 (3), 409−19.
(23) Arnold, T.; Schönbächler, M.; Rehkämper, M.; Dong, S.; Zhao, F. J.; Kirk, G. J.; Coles, B. J.; Weiss, D. J. Measurement of zinc stable isotope ratios in biogeochemical matrices by double-spike MC-ICPMS and determination of the isotope ratio pool available for plants from soil. Anal. Bioanal. Chem. 2010, 398 (7−8), 3115−25.
(24) Bian, S. W.; Mudunkotuwa, I. A.; Rupasinghe, T.; Grassian, V. H. Aggregation and dissolution of 4 nm ZnO nanoparticles in aqueous environments: influence of pH, ionic strength, size, and adsorption of humic acid. Langmuir 2011, 27 (10), 6059−68.
(25) Lowry, G. V.; Gregory, K. B.; Apte, S. C.; Lead, J. R. Transformations of Nanomaterials in the Environment. Environ. Sci. Technol. 2012, 46 (13), 6893−6899.
(26) Canadian soil quality guidelines for the protection of environmental and human health: Ethylene glycol; Canadian soil quality guidelines; Canadian Council of Ministers of the Environment: Winnipeg, Canada, 1999;http://ceqg-rcqe.ccme.ca/download/en/268.
(27) van Gestel, C. A. M.; Dirven-van Breemen, E. M.; Baerselman, R. Influence of environmental-conditions on the growth and reproduction of the earthworm Eisenia andrei in an artificial soil substrate. Pedobiologia 1992, 36 (2), 109−120.
(28) Romero-Freire, A.; Lofts, S.; Martin Peinado, F. J.; van Gestel, C. A. M. Effects of aging and soil properties on zinc oxide nanoparticle availability and its ecotoxicological effects to the earthworm Eisenia andrei. Environ. Toxicol. Chem. 2017, 36 (1), 137−146.
(29) Swiatek, Z. M.; van Gestel, C. A. M.; Bednarska, A. J. Toxicokinetics of zinc-oxide nanoparticles and zinc ions in the earthworm Eisenia andrei. Ecotoxicol. Environ. Saf. 2017, 143, 151−158.
Environmental Science & Technology Article
DOI:10.1021/acs.est.7b02944
Environ. Sci. Technol. 2017, 51, 12756−12763 12763