HAL Id: hal-00328318
https://hal.archives-ouvertes.fr/hal-00328318
Submitted on 10 Oct 2008HAL is a multi-disciplinary open access
archive for the deposit and dissemination of sci-entific research documents, whether they are pub-lished or not. The documents may come from teaching and research institutions in France or abroad, or from public or private research centers.
L’archive ouverte pluridisciplinaire HAL, est destinée au dépôt et à la diffusion de documents scientifiques de niveau recherche, publiés ou non, émanant des établissements d’enseignement et de recherche français ou étrangers, des laboratoires publics ou privés.
Increased UV radiation due to polar ozone chemical
depletion and vortex occurrences at southern sub-polar
latitudes in the period (1997–2005)
Andrea Pazmino, Sophie Godin-Beekmann, E. A. Luccini, R. D. Piacentini, E.
J. Quel, Alain Hauchecorne
To cite this version:
Andrea Pazmino, Sophie Godin-Beekmann, E. A. Luccini, R. D. Piacentini, E. J. Quel, et al.. Increased UV radiation due to polar ozone chemical depletion and vortex occurrences at southern sub-polar latitudes in the period (1997–2005). Atmospheric Chemistry and Physics Discussions, European Geosciences Union, 2008, 8 (2), pp.6501-6537. �10.5194/acpd-8-6501-2008�. �hal-00328318�
ACPD
8, 6501–6537, 2008 Increased UV radiation at southern sub-polar latitudes A. F. Pazmino et al. Title Page Abstract Introduction Conclusions References Tables Figures ◭ ◮ ◭ ◮ Back CloseFull Screen / Esc
Printer-friendly Version Interactive Discussion
Atmos. Chem. Phys. Discuss., 8, 6501–6537, 2008 www.atmos-chem-phys-discuss.net/8/6501/2008/ © Author(s) 2008. This work is distributed under the Creative Commons Attribution 3.0 License.
Atmospheric Chemistry and Physics Discussions
Increased UV radiation due to polar ozone
chemical depletion and vortex
occurrences at southern sub-polar
latitudes in the period (1997–2005)
A. F. Pazmino1,2, S. Godin-Beekmann1, E. A. Luccini3,4, R. D. Piacentini3,5, E. J. Quel6, and A. Hauchecorne2
1
UPMC Univ. Paris 06, UMR 7620, Service d’A ´eronomie, 75005, Paris, France
2
Universit ´e Versailles St-Quentin, CNRS, UPMC, Service d’A ´eronomie, Route Foresti `ere de Verri `eres, 91370 Verri `eres-le-Buisson, France
3
Inst. de F´ısica Rosario (CONICET – Universidad Nacional de Rosario), Rosario, Argentina
4
Facultad de Qu´ımica e Ingenier´ıa “Fray Rogelio Bacon”, Universidad Cat ´olica Argentina, Rosario, Argentina
5
Facultad de Ciencias Exactas, Ingenier´ıa y Agrimensura, Universidad Nacional de Rosario, Rosario, Argentina
6
CEILAP (CITEFA-CONICET), Villa Martelli, Argentina
Received: 25 January 2008 – Accepted: 26 January 2008 – Published: 4 April 2008 Correspondence to: A. F. Pazmino (andrea.pazmino@aero.jussieu.fr)
ACPD
8, 6501–6537, 2008 Increased UV radiation at southern sub-polar latitudes A. F. Pazmino et al. Title Page Abstract Introduction Conclusions References Tables Figures ◭ ◮ ◭ ◮ Back CloseFull Screen / Esc
Printer-friendly Version Interactive Discussion Abstract
The variability of total ozone and UV radiation from Total Ozone Mapping Spectrome-ter (TOMS) measurements is analyzed as a function of polar vortex occurrences over the southern subpolar regions during the 1997–2005 period. The analysis of vortex occurrences showed high interannual variability in the 40◦S–60◦S latitude band with a
5
longitudinal asymmetry showing the largest frequencies over the 90◦W–90◦E region. The impact of vortex occurrences on UV radiation and ozone in clear sky conditions was determined from the comparison between the measurements inside the vortex and a climatology obtained from data outside the vortex over the studied period. Clear sky conditions were determined from TOMS reflectivity data. For measurements outside
10
the vortex, clear sky conditions were selected for reflectivity values lower than 7.5%, while for measurements inside the vortex, a relaxed threshold was determined from statistically similar UV values as a function of reflectivity. UV changes and ozone differ-ences from the climatology were analyzed in the 40◦S–50◦S and 50◦S–60◦S latitude bands during the spring period (September to November). The largest UV increases
15
and ozone decreases, reaching 200% and 65%, respectively, were found in the 50◦S– 60◦S latitude band in September and October. The heterogeneous ozone loss during vortex occurrences was estimated using a chemical transport model. The largest im-pact of vortex occurrences was found in October with mean UV increase, total ozone decrease and accumulated ozone loss in the 350 K–650 K range of respectively 47%,
20
32% and 63%. The region close to South America is the most affected by the Antarc-tic ozone depletion due to the combined effect of large number of vortex occurrences, lower cloud cover and large ozone decrease. This region would be the most vulner-able in case of cloud cover decrease linked to climate change, due to more frequent occurrence of ozone poor air masses during austral spring.
ACPD
8, 6501–6537, 2008 Increased UV radiation at southern sub-polar latitudes A. F. Pazmino et al. Title Page Abstract Introduction Conclusions References Tables Figures ◭ ◮ ◭ ◮ Back CloseFull Screen / Esc
Printer-friendly Version Interactive Discussion 1 Introduction
In the most recent years, the ozone hole area has shown a larger variability than pre-viously observed (see for example Fig. 1 in Newman et al., 2006). The year 2001 was characterized by a relatively large ozone hole that remained up to mid–December. Then in the year 2002, a remarkably high planetary wave activity took place in the
5
Southern Hemisphere, which contrasted with previous years (Allen et al., 2003). This activity brought about, at the end of September, the first stratospheric major warming ever observed in the Southern Hemisphere (Hoppel et al., 2003; Randall et al., 2005; Scaife et al., 2005). In the middle and high stratosphere, the air masses rich in ozone from mid-latitudes were transported to the Polar Regions (Kondragunta et al., 2005).
10
In that altitude range, the ozone hole divided in two lobes. The consequence of the 2002 major warming was a significant diminution of the surface of the ozone hole and its early disappearance. In 2003, a typical ozone hole was observed within a very large area in September. Then, in 2004, the ozone hole area was rather small as compared to the other years (except 2002) and the year 2005 was again characterized by a big
15
ozone hole. After 2002, a saw-tooth pattern of relatively small ozone hole in even years and mostly larger in odd years was observed (WMO, 2006). However, the year 2006 has been characterized by one of the largest ozone hole, comparable to those observed in 2000 and 2003.
It was shown by different works (Kirchoff et al., 1997; P ´erez et al., 2000; Cede et
20
al., 2002; Pazmi ˜no et al., 2005), that the subpolar regions of the Southern Hemisphere were affected by short periods of weak total ozone values directly linked to overpasses of the ozone hole. During these episodes, the subpolar regions experience a pro-nounced ozone reduction with generally an enhancement of UV-B radiation, depend-ing on cloud cover conditions. Other studies have shown that the populated regions
25
of the South America Southern tip are a preferential area for vortex occurrences in the spring period (Compagnucci et al., 2001; Huth and Canziani, 2003). In a previous work (Pazmi ˜no et al., 2005), we have analyzed the local increase of erythemal dose
ACPD
8, 6501–6537, 2008 Increased UV radiation at southern sub-polar latitudes A. F. Pazmino et al. Title Page Abstract Introduction Conclusions References Tables Figures ◭ ◮ ◭ ◮ Back CloseFull Screen / Esc
Printer-friendly Version Interactive Discussion
linked to vortex occurrences at mid-latitude and polar stations of the Southern Hemi-sphere. Episodic daily erythemal dose increases larger than twice the climatological value were found at the Argentinean town of Ushuaia (54.9◦S, 68.3◦W) linked to vor-tex occurrences over the station during the period 1997–2003. The average erythemal UV increase due to these events was evaluated to 68% over this period. Casiccia et
5
al. (2003) have found episodic UV index increases larger than 100% over Punta Arenas (53.1◦S, 70.9◦W) in Chili in October 2000 due to vortex overpasses.
In the present study, we analyzed the whole subpolar latitude region using total ozone and local noon erythemal UV irradiance (converted to UV index) of TOMS dur-ing the 1997–2005 period. The cloud cover conditions were taken into account usdur-ing
10
TOMS’s reflectivity values. In addition, a high spatial resolution advection model cou-pled to an ozone chemistry parameterization (ATOLL – Advection Transport model with Ozone Linearization scheme at isentropic Levels) was used in order to link the UV in-crease to accumulated chemical ozone loss during each Antarctic winter and spring. The model was also used to detect the preferential regions of vortex displacements
15
characterized by large chemical ozone loss but no significant UV enhancements as derived from TOMS measurements. The lack of UV sensitivity to significant ozone de-creases in some regions is explained by an important attenuation due to cloud cover. The regions with this combined effect of preferential vortex displacements and high cloud cover condition are more vulnerable to cloud cover diminution linked to climate
20
change, as the stratospheric ozone layer slowly returns to pre-ozone hole conditions. Newman et al. (2006) showed that the unambiguous detection of ozone hole decrease due to decrease in ozone depleting substances (ODS) will probably not occur before 2020. This delay in the detection of ozone hole recovery is linked to the atmospheric variability in the southern polar stratosphere and the long life time of ODS in the
strato-25
sphere, especially in the Polar Regions.
This paper is organized as follows. Firstly, the data and methodology used to study the reduction in total ozone and enhancement in UV index linked to polar vortex occur-rences are shown. Then, the ATOLL model used to simulate ozone loss partial columns
ACPD
8, 6501–6537, 2008 Increased UV radiation at southern sub-polar latitudes A. F. Pazmino et al. Title Page Abstract Introduction Conclusions References Tables Figures ◭ ◮ ◭ ◮ Back CloseFull Screen / Esc
Printer-friendly Version Interactive Discussion
is presented and validated. These simulations were used to relate UV changes and chemical ozone loss. In the next section, the main features of vortex displacements over the Southern Hemisphere are analyzed for the whole period 1997–2005. Then the variation in total ozone and UV index linked to polar vortex occurrences are quan-tified over the sub-polar regions and mid-latitude regions (40◦S–60◦S) using TOMS
5
data. In a following section, the relationship between UV changes and chemical ozone loss is analyzed using partial ozone columns from ATOLL simulations. The potentiality of different regions to possible UV enhancement in a hypothetical scenario of cloud cover diminution is analyzed. Finally, the main results of the work are summarized and conclusions are presented.
10
2 Impact of vortex occurrences on ozone and UV radiation
2.1 Data and methodology
In order to quantify the occurrences of the vortex at mid-latitudes over the 1997– 2005 period, the equivalent latitude (EL) at the potential temperature level θ=550 K
is used. It is calculated from PV field simulated by the MIMOSA PV advection model
15
(Hauchecorne et al., 2002). The EL at 550 K is computed at each elementary grid area (1◦×1◦) of the PV field of the latitude band 30◦S–90◦S. The meteorological analy-ses from the European Centre for Medium-Range Forecasts (ECMWF) 1.125◦×1.125◦ (T106 truncation) analyses are used for the PV calculation. Such a method was al-ready used in previous studies for the discrimination of polar and non polar
measure-20
ments performed at the edge of the vortex (Godin et al., 2001; Pazmi ˜no et al., 2005). The EL is a modified PV variable enclosing the same area as the PV contour. In the quasi-conservative coordinate system (EL,θ) firstly described by McIntyre and Palmer
(1984), the EL of each elementary area is compared to the EL of the vortex edge for classification. The inner and outer vortex regions are determined from the maximum of
25
ACPD
8, 6501–6537, 2008 Increased UV radiation at southern sub-polar latitudes A. F. Pazmino et al. Title Page Abstract Introduction Conclusions References Tables Figures ◭ ◮ ◭ ◮ Back CloseFull Screen / Esc
Printer-friendly Version Interactive Discussion
The classification is performed between 1 April and 31 December of each year of the period. Previous studies showed that the highest correlation between potential vortic-ity and total ozone values was obtained at 550 K isentropic level (Bodeker et al., 2002; Pazmi ˜no et al., 2005).
To quantify the changes in UV linked to total ozone decrease in sub-polar regions due
5
to vortex occurrences, total ozone columns (TOC) values from TOMS (V8) (e.g. Labow et al., 2004) and TOMS-retrieved erythemal UV irradiance at local noon (Krotkov et al., 2002) are used. The erythemal irradiance in W/m2 is multiplied by 40 to express it in UV Index (UVI), units (WHO, 2002). After interpolating the TOMS TOC and UVI data on a 1◦×1◦grid, two groups of data were distinguished according to the vortex position
10
over each elementary area of the grid. The first group corresponds to TOC and UVI values inside and in the inner edge of the vortex, as determined by the previously described classification and the second group to data outside the vortex. The data of the latter group are also used to calculate the reference climatology of daily UVI and TOC values over the studied period as a function of latitude. In this way, the TOC and
15
UVI changes due to vortex occurrences are characterized by the difference between the values inside the vortex and the corresponding value of the zonal climatology for that day and location.
Since UV radiation at the surface is strongly influenced by cloud conditions (WMO, 2003), only the data obtained in clear sky conditions are considered for the calculation
20
of the UVI zonal climatology. The separation of cloudy and clear sky data is determined from TOMS reflectivity data. The latter data is calculated from the backscattered ra-diance at 360 nm wavelength which is independent of ozone. This reflected radiation is assumed to originate from the ground and the tops of clouds in TOMS’s algorithm (McPeters et al., 1998). The cloudless scenes measured by TOMS for most land and
25
ocean surfaces have been studied by Eck et al. (1987). A ceiling value of reflectivity of around 7–8% was determined for clear sky condition (Eck et al., 1987; Herman and Celarier, 1997; Wang et al., 2000). This minimum reflectance technique is not ade-quate for regions covered by snow and ice. The reflectivity of snow and ice surface is
ACPD
8, 6501–6537, 2008 Increased UV radiation at southern sub-polar latitudes A. F. Pazmino et al. Title Page Abstract Introduction Conclusions References Tables Figures ◭ ◮ ◭ ◮ Back CloseFull Screen / Esc
Printer-friendly Version Interactive Discussion
quite high in the UV, preventing the distinction between cloudy and cloud-free regions covered by snow and ice. The regions southern of 60◦S were therefore not considered in the analysis since the sea ice in the Southern Ocean around Antarctica presents an important extension with a maximum reaching 60◦S in average in September (cf. Fig. 1 of Zwally et al., 2002). The study was focused on the 50◦S–60◦S latitude range since
5
this region is frequently affected by vortex occurrences as will be shown in Sect. 3. Three months were analyzed: September, October and November when the maximum frequencies of vortex occurrences are observed.
The first step to calculate the UVI climatology is to compute the zonal mean daily value from July to November over the 1997–2005 from UVI data with corresponding
10
reflectivity lower than 7.5%. Then the UVI daily evolution is fitted by a third-order polynomial. The TOC outside vortex climatology is computed from the daily zonal median value of the measurements obtained outside the vortex over the period 1997– 2005 from September to November. A moving average window of ±5 d is then applied and the climatology is finally obtained by fitting a third-order polynomial on the average
15
values.
The percentage differences in UVI and TOC values (∆UVI and ∆TOC, respectively) due to vortex occurrences over an elementary space (1◦×1◦) are determined as de-scribed by Eq. (1) for UVI:
∆UVI (λ, ϕ, d ) = 100 ×UVI (λ, ϕ, d ) − UVIcli(λ, d ) UVIcli(λ, d )
(1)
20
Where UVI represent the value inside the vortex at latitudeλ, longitude ϕ and day d
and UVIcliis the climatology value at latitudeλ and day d .
It was found in the study that for some latitude regions, the statistics of UVI and TOC measurements inside the vortex and for the specified criterion of clear sky condition was relatively poor. For example, only 58 elementary areas were found for clear sky
25
condition over the whole September 1997–2005 period for the latitude band 50◦S– 60◦S, representing around 0.04% of the total number of elementary areas that were inside the vortex during that month and for all cloud cover conditions.
ACPD
8, 6501–6537, 2008 Increased UV radiation at southern sub-polar latitudes A. F. Pazmino et al. Title Page Abstract Introduction Conclusions References Tables Figures ◭ ◮ ◭ ◮ Back CloseFull Screen / Esc
Printer-friendly Version Interactive Discussion
In order to improve the statistical results, a relaxed condition of the ceiling value of TOMS reflectivity was considered. To that aim, the change of UVI as a function of reflectivity was studied. Mean ∆UVI values were calculated for each degree of latitude between 50◦S and 60◦S for September, October and November over the period 1997– 2005. The mean values of ∆UVI over the whole latitude band (50◦S–60◦S) together
5
with the two standard error confidence interval (2σ) are shown in Fig. 1 (top panel)
for September (blue curve), October (red curve) and November (green curve) as a function of reflectivity with a step of 5%. As expected, the mean ∆UVI is the largest for lower reflectivity values for the three months. It becomes negative for reflectivity values larger than 40% in September and October and 30% for November. The mean ∆UVI
10
corresponding to reflectivity values lower than 10% vary from 50% in September, 75% in October and 35% in November. For the highest reflectivity values, ∆UVI can reach −80%. The mean ∆UVI of September and October are comparable within 2σ standard error confidence intervals and are generally larger than the mean ∆UVI in November.
The relaxed criterion for the ceiling reflectivity threshold is obtained by comparing
15
the mean ∆UVI values for different reflectivity values to the maximum mean ∆UVI at 2σ standard error level. It can be seen in the top panel of Fig. 1 that the mean values
associated to reflectivity larger than 27.5% in September, 22.5% in October and 12.5% in November are significantly different at 2σ standard error level. These thresholds of reflectivity represent thus the quasi-clear sky condition of the studied period for the
20
corresponding month. In these conditions, the number of elementary areas considered inside the vortex was increased from 0.04% to 9.2% in September, from 0.16% to 4.5% in October and from 0.13% to 1.1% in November.
The mean ∆TOC were also represented in Fig. 1 (bottom panel) together with the 2σ standard error confidence interval. It varies weakly with the reflectivity as compared to
25
∆UVI variation. The mean ∆TOC values are always negative for the three months. The monthly average of mean ∆TOC is −28.6±2.4% for September, −33.3±1.8% for Oc-tober and −19.2±1.3% for November. In the latter month, the mean ∆TOC values are significantly smaller in absolute value. Figure 1 shows a small diminution with
reflectiv-ACPD
8, 6501–6537, 2008 Increased UV radiation at southern sub-polar latitudes A. F. Pazmino et al. Title Page Abstract Introduction Conclusions References Tables Figures ◭ ◮ ◭ ◮ Back CloseFull Screen / Esc
Printer-friendly Version Interactive Discussion
ity increase for September and October that is not significant at 2σ level compared to
clear sky condition except for reflectivity values larger than 90%. These high reflectivity values correspond to regions close to 60◦S, where indeed the largest ozone decreases are found in the 50◦S–60◦S latitude band.
A similar analysis was done for the 40◦S–50◦S latitude band. We found similar
be-5
havior but the UVI increases at low reflectivity values are weaker than those of the southern latitude band due to weaker total ozone diminution. The values of reflec-tivity criteria were restricted to 27.5% on September, 17.5% on October and 7.5% in November.
2.2 Simulation of partial ozone column (POC) of ATOLL model
10
2.2.1 Model description
The ATOLL model was developed to obtain a high resolution 4-D representation of the ozone hole with a simple parametrization of ozone chemistry over the period 1997– 2005. ATOLL is a result of the coupling of the high resolution advection transport model Mod `ele Isentropique de transport Mesoechelle de l’Ozone Stratosph ´erique par
15
Advection (MIMOSA, Hauchecorne et al., 2002) with the LINearized Ozone (LINOZ, McLinden et al., 2000) chemistry parametrization for ozone homogeneous chemistry and to the MIDdle atmosphere RADiation scheme (MIDRAD, Shine, 1987) for vertical transport calculation using ozone in an interactive way. We have also established a heterogeneous ozone chemistry parametrization to take into account the important
20
ozone depletion in the Polar Regions of the Southern Hemisphere.
Three ozone tracers are defined: one that it is not affected by chemistry and the two others affected by homogeneous and heterogeneous chemistry, respectively. The three tracers are advected by the ECMWF wind analyses.
In its present version, the ATOLL model uses 16 isentropic levels between 350 and
25
950 K and covers the latitude band 30◦S–90◦S with a horizontal resolution of 1◦ ×1◦. This spatial resolution is sufficient to simulate large scale events such as vortex
dis-ACPD
8, 6501–6537, 2008 Increased UV radiation at southern sub-polar latitudes A. F. Pazmino et al. Title Page Abstract Introduction Conclusions References Tables Figures ◭ ◮ ◭ ◮ Back CloseFull Screen / Esc
Printer-friendly Version Interactive Discussion
placements towards mid-latitude regions of the Southern Hemisphere.
In order to simulate the ozone loss at high latitudes regions due to heterogeneous chemistry, the activation of air masses induced by polar stratospheric cloud (PSC) formation and the related ozone destruction in the presence of solar radiation were parameterized. A cold tracer (CT ) was incorporated into ATOLL in order to detect
5
the activated air masses after their exposure to PSC. The CT varies between 0 and 1, corresponding respectively to not activated and completely activated air. The time scale chosen for the activation rate isτa=7 h and τd=10 d for the deactivation rate in a
similar way to the previous work of Hadjinicolaou and Pyle, (2004). CT is determined by comparing once per hour the temperature in each grid point polewards of 40◦S for
10
each isentropic level with the temperature of formation of type I PSC or NAT (TPSC). Activated [deactivated] air mass is considered when the temperature is lower [higher] than TPSCand CT is then computed from Eqs. (2) [(3)].
CT (λ, ϕ, θ, t + dt) = 1 − (1 − CT (λ, ϕ, θ, t)) × e−d t/τa (2)
CT (λ, ϕ, θ, t + dt) = CT (λ, ϕ, θ, t) × e−d t/τd (3)
15
Where CT (λ, ϕ, θ, t + dt) is the cold tracer at latitude λ, longitude ϕ, isentropic level θ and timet+dt. The temporal resolution dt of ATOLL is 1 h.
TPSCis calculated from the pressure at the corresponding grid point and the mixing ratio of HNO3 and H2O (Hanson and Mauersberger, 1988). A climatology resulting from average zonal measurements of Limb Infrared Monitor of the Stratosphere
instru-20
ment (LIMS) (Gille and Russell, 1984) is used for the values of HNO3 and a value equal to 5 ppmv for H2O. The ozone depletion rate due to heterogeneous chemistry is estimated via an empirical method using the CTM model MIMOSA-CHIM (Marchand et al., 2005; Tripathi et al., 2006) simulations and ozonesonde observations at South Pole (SPO- 89.9◦S, 102◦E) and McMurdo (MMU- 77.8◦S, 166.6◦E) stations. We have
25
calculated a percentage of ozone depletion per 24 h of sunlight (p24). This percentage is multiplied by the value of the cold tracer which indicates the degree of activation
ACPD
8, 6501–6537, 2008 Increased UV radiation at southern sub-polar latitudes A. F. Pazmino et al. Title Page Abstract Introduction Conclusions References Tables Figures ◭ ◮ ◭ ◮ Back CloseFull Screen / Esc
Printer-friendly Version Interactive Discussion
in the corresponding point of grid only if the Solar Zenith Angle (SZA) is lower than 95◦. Hadjinicolaou and Pyle (2004) fixed p24 at 5%. In the case of ATOLL,p24 is vari-able with time and altitude. The sum of the ozone loss rates of the four main catalytic cycles involving chlorine and bromine constituent (Cl-O and ClO-ClO cycles and the cycle BrO-ClO via ClO2and via BrCl) of MIMOSA-CHIM was used as a guide for the
5
estimation of thep24 parameter in ATOLL. Then, thep24 values were adjusted for the cold winter 2001 and the disturbed winter 2002, from the comparison of model results with ozone sonde measurements at South Pole and McMurdo stations. These stations were selected because they are generally inside the vortex. The ozone depletion rate is applied at each time step of the model (1 h) if SZA<95◦
. The effective ozone loss
10
is thus modulated by the value of the cold tracer and the duration of sunlight, which determines for ATOLL the difference from one winter to the next. Note that a con-stant percentage of ozone loss from one year to the next is adequate for the studied period characterized by a weak variation in total chlorine and bromine content in the stratosphere (WMO, 2007).
15
2.2.2 Validation of the model simulations with ozone sonde measurements
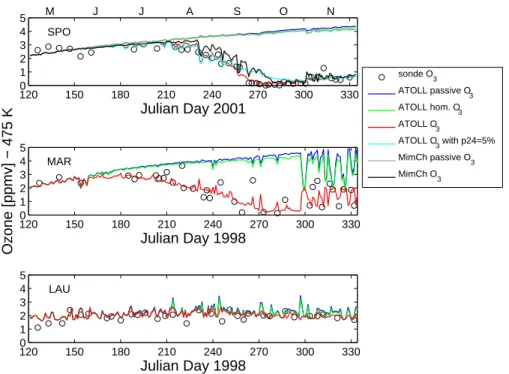
The ozone tracer influenced by dynamical processes and homogeneous and hetero-geneous chemistry is compared to ozone sondes measurements at different isentropic levels. As an example, Fig. 2 shows the ozone mixing ratio at 475 K for various sta-tions. The three ozone tracers of ATOLL are represented in the figure: the passive
20
ozone tracer (blue curve), ozone linked to homogeneous chemistry (green curve) and ozone associated to heterogeneous and homogeneous chemistry (red curve). Obser-vations are shown by the markers. The upper panel displays the ozone simulations at South Pole (SPO), generally in the vortex core, for the winter–spring 2001. The ozone and passive ozone tracer simulations by the CTM model MIMOSA-CHIM are
25
also represented in the Figure (black and gray curves, respectively) for comparison with heterogeneous ozone tracer from ATOLL.
ACPD
8, 6501–6537, 2008 Increased UV radiation at southern sub-polar latitudes A. F. Pazmino et al. Title Page Abstract Introduction Conclusions References Tables Figures ◭ ◮ ◭ ◮ Back CloseFull Screen / Esc
Printer-friendly Version Interactive Discussion
differences until the end of July. In August, the differences become more important and the simulation of ATOLL is in most of the cases in better agreement with the son-des measurements. The main differences between the simulations are noticeable in the months of September and October. ATOLL simulation reproduces the ozone de-crease, the low values of ozone reached at the end of September and the beginning of
5
October, in good agreement with observations. Moreover, it simulates correctly the low values of ozone persistent in October at the station. The MIMOSA-CHIM simulation reaches these low ozone values only by mid-October. Another parameterization for heterogeneous ozone loss rates was also used in ATOLL, ATOLL5% (cyan curve) with
p24equal to 5% following the specification of Hadjinicolaou and Pyle (2004). ATOLL5%
10
presents a good agreement until mid-September but the weakest ozone values are only reached at the end of October.
The comparison between ATOLL simulation and measurements performed at Marambio (MAR- 64.2◦S, 56.7◦W), a station most of the time in the vortex edge (Pazmi ˜no et al., 2005), and Lauder (LAU- 45.04◦S, 169.68◦E), which were not used
15
for the ATOLL formulation is represented in the Fig. 2 for the year 1998 (middle and bottom panel, respectively). ATOLL reproduces generally well the ozone destruction at MAR and the large ozone variability linked to the location of the station at the edge of the vortex is well followed by the simulation. The mid-latitude station (LAU) presents differences between the passive ozone tracer and ozone due to homogeneous and
20
heterogeneous chemistry from August. These differences are larger in October and November. During this period, the heterogeneous ozone tracer is in good agreement with sonde measurements.
Since we are interested in the relationship between the partial ozone column (POC) and UV radiation, we have also compared the POC fields of ATOLL between 350 and
25
650 K isentropic levels to the corresponding POC of SAGE II (Mauldin et al., 1985) over the 1998–2004 period. SAGE II ceased operation after 2004. Figure 3 shows the comparison of simulated and observed POCs for the latitude band 40◦S–60◦S in September, October and November. The situations inside the vortex are represented
ACPD
8, 6501–6537, 2008 Increased UV radiation at southern sub-polar latitudes A. F. Pazmino et al. Title Page Abstract Introduction Conclusions References Tables Figures ◭ ◮ ◭ ◮ Back CloseFull Screen / Esc
Printer-friendly Version Interactive Discussion
by blue points and the situations outside of the vortex by green ones. The mean relative POC differences between ATOLL and SAGE show an underestimation of the model in September of around 5.6% for the situations inside the vortex and an overestimation of 4.4% for the situation outside the vortex. In October, the mean relative difference presents a larger mean underestimation of 14.9% for the situations inside the vortex.
5
The situations outside the vortex show an overestimation comparable to that observed in September (5.1% mean relative difference). In November, the model shows an over-estimation of POC values for both types of situations of ∼13%. The correlation of partial ozone values from ATOLL and SAGE is quite good for the situations inside the vortex with a correlation coefficient of 0.75 in September, 0.8 in October and 0.79 in
Novem-10
ber. For the situations outside of the vortex, the correlation is weaker especially in September: 0.53, 0.66 and 0.8, respectively. These various comparisons with ground-based and satellite measurements indicate that ATOLL reproduces in a satisfactory way the ozone partial column in the altitude range most affected by heterogeneous chemistry processes during the period of interest.
15
3 Analysis of vortex occurrences over sub-polar regions
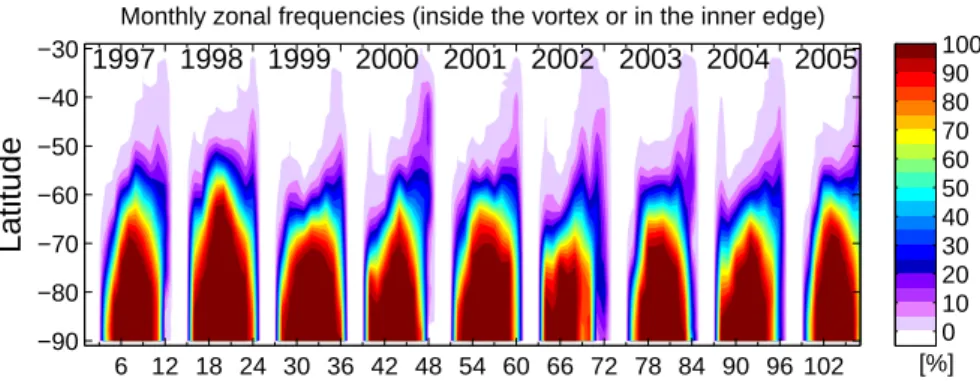
The frequencies of vortex occurrences over the Southern Hemisphere as a function of latitude and longitude are analyzed using the methodology described in Sect. 2.1. Figure 4 shows the seasonal evolution of the monthly zonal frequencies of the situa-tions inside the vortex over the period 1997–2005 as a function of the latitude (upper
20
panel). Frequencies larger than 90% are observed between 70◦S and 90◦S each year. The regions with frequencies larger than 90% extend northwards in June with a max-imum extension generally in August and a southward regression around October. As an exception due to the major warming, the latitude range between 70◦S and 90◦S are characterized by frequencies lower than 90% between September and November
25
in 2002. The annual evolution of frequencies larger than 70% is very similar from one year to the next with northernmost latitude of around 65◦S generally reached in July
ACPD
8, 6501–6537, 2008 Increased UV radiation at southern sub-polar latitudes A. F. Pazmino et al. Title Page Abstract Introduction Conclusions References Tables Figures ◭ ◮ ◭ ◮ Back CloseFull Screen / Esc
Printer-friendly Version Interactive Discussion
and August. The years 1998 and 2002 stand out in these time series as the years when the polar vortex showed the respectively northernmost and southernmost extensions.
In the 50◦S–60◦S latitude range, vortex overpasses generally occur with frequencies lower than 50% except in 1998 when frequencies exceeding 70% were determined between 57◦S and 60◦S in August. The monthly frequencies of vortex overpasses
5
in this latitude range present a larger interannual variability than at higher Southern latitudes. The weakest frequencies (below 5%) reach their northernmost extension (generally around 35◦S) in November–December. In 2000, 2003 and 2005, these low frequencies reached 30◦S. In 2002, vortex overpasses could be detected down to 30◦S already in September and up to October. Note that all the frequencies displayed in
10
Fig. 1 correspond to vortex occurrences before its breakup. The breakup of the vortex is determined when the maximum wind speed calculated along Ertel’s PV isolines at 450 K isentropic level falls below ∼15.2 m/s (Nash et al., 1996).
In order to study the asymmetry of the displacement of the austral vortex in the sub-polar regions previously mentioned, the monthly longitudinal frequency of the situations
15
inside the vortex for the sub-polar latitudes region are computed over the 1997–2005 period. The bottom panel of Fig. 1 displays the monthly longitudinal frequency for the 40◦S–60◦S latitude band. It shows that the highest frequencies (approximately 35%) in this latitude range are observed between 90◦O and 90◦E. In this longitude range, the frequencies are generally lower than 25% until July, except in 1998 when higher values
20
were reached. In September and October, the months when the vortex starts to be strongly deformed by planetary wave activity, the maximum frequencies vary between 30% and 50% at these longitudes.
4 Variation of ozone and UV radiation over subpolar regions linked to vortex overpasses
25
In order to analyze the relationship between local increases in UV and Antarctic vortex occurrences with low total ozone values, the UVI and TOC data from TOMS Version 8
ACPD
8, 6501–6537, 2008 Increased UV radiation at southern sub-polar latitudes A. F. Pazmino et al. Title Page Abstract Introduction Conclusions References Tables Figures ◭ ◮ ◭ ◮ Back CloseFull Screen / Esc
Printer-friendly Version Interactive Discussion
were compared following the methodology described in Sect. 2.1 for the latitude band 50◦S–60◦S. The latitude band 40◦S–50◦S was also considered although it is charac-terized by much lower vortex occurrence frequencies: on the order of 2.3% in average as compared to 18.6% in average for the former latitude band as shown in Fig. 4. Fig-ure 5 displays the variation of relative UVI changes (∆UVI) in September (a), October
5
(b) and November (c) as a function of relative ozone differences ∆TOC for both lati-tude bands. A moving average fit was applied to data at each 2.5% ∆TOC step, in a ∆TOC interval of ±1.25%. The mean values and 2σ standard deviation of ∆UVI are represented with bold lines in Fig. 5a, b and c. The relationship between UV change and TOC differences shown in the Figure are quite similar to that reported by UNEP
10
(1998) where the dependence of erythemal ultraviolet radiation at the Earth’s on at-mospheric ozone was illustrated at various locations. This relationship is very similar within 2σ standard deviation interval to a model prediction with a power rule using
RAF=1.1 (Madronich et al., 1998) described in the UNEP report that it is also repre-sented in Fig. 5 (black lines). This is specially highlighted in October and November.
15
Outlier values represent a negligible contribution to the mean ∆UVI values as seen by comparing the median and mean values for the three months.
The three months present similar UVI increases as a function of TOC changes as shown by the fitting bold lines in Fig. 5. Some differences are yet observed due to the different criteria for quasi-clear sky conditions. But these differences are negligible at
20
2σ standard deviation level.
In September and October, large UVI increase between once and two times the climatological values are found for an ozone decrease of 50–65% between 50◦S and 60◦S (red points in Fig. 5). In the northernmost latitude band (blue points), maximum UV increases of 65% for September and 110% for October are observed for ozone
25
decreases of 45% and 50%, respectively. In November, ∆UVI can reach values as high as 80% for the northernmost latitude band and 155% for the southernmost one, associated with ozone decreases larger than 40% and 50%, respectively.
ra-ACPD
8, 6501–6537, 2008 Increased UV radiation at southern sub-polar latitudes A. F. Pazmino et al. Title Page Abstract Introduction Conclusions References Tables Figures ◭ ◮ ◭ ◮ Back CloseFull Screen / Esc
Printer-friendly Version Interactive Discussion
diation at the 50◦S–60◦S latitude band, due to the rapid diminution of the number of vortex occurrences with high UV increases at the 40◦S–50◦S latitude band (see Fig. 5). In September and November UV increases do not reach 100% and in October, UV increase larger than 100% are found for only a few number of points.
5 Chemical ozone loss associated to vortex occurrences 5
In order to evaluate the chemical ozone loss over the 50◦S–60◦S latitude band linked to vortex occurrences and to study the relationship with UV changes, the partial accu-mulated ozone loss columns (AOL) siaccu-mulated by the ATOLL model for the 1997–2005 period have been used. The partial ozone columns are retrieved in the altitude range 350–650 K where heterogeneous chemistry processes induce chemical ozone loss due
10
to the presence of PSC at these polar altitude regions as shown in Fig. 6 of Parrondo et al. (2007) for the year 2003.
5.1 Characterization of ozone loss and UV changes relationship
In this section, we analyze the relationship between the accumulated ozone loss in the 350–650 K potential temperature range and the UV increases in the 50◦S–60◦S
15
latitude band. In order to link the partial column of the accumulated ozone loss (AOL) derived from ATOLL simulations to UVI and TOC changes (Sect. 3.2), we have com-puted total ozone from the partial ozone column of the model between 350 and 950 K. The ozone climatology of Fortuin et al. (1998) was used to compute the partial ozone columns below 350 K and above 950 K. However, comparisons with sondes and POAM
20
(Polar Ozone and Aerosols Measurements) III measurements (Bevilacqua et al., 2002) for POC below 350 K and above 950 K, respectively, revealed biases of this climatol-ogy in the Polar Regions. Correction terms were thus applied to the climatolclimatol-ogy in order to reach a better agreement with the measurements. In addition, a correction term was also computed for the overestimation of ozone by the model between 600
ACPD
8, 6501–6537, 2008 Increased UV radiation at southern sub-polar latitudes A. F. Pazmino et al. Title Page Abstract Introduction Conclusions References Tables Figures ◭ ◮ ◭ ◮ Back CloseFull Screen / Esc
Printer-friendly Version Interactive Discussion
and 950 K due to initialization problems. Ozonesondes in Antarctic stations (South Pole, McMurdo, Marambio and Dumont d’Urville) and POAM data were used for this correction terms.
The relative UVI and TOC differences due to vortex overpasses and computed from TOMS data for quasi-clear sky conditions are shown in the second and third columns
5
of Table 1a. For comparison, corresponding TOC results for ATOLL are given in the fourth column of the Table. For each average value, the 2σ standard error is indicated.
The fifth column corresponds to a spatial mean number of days of vortex occurrences (VOsp).
In order to study the influence of chemical ozone loss on UV increase, the method
10
described in Sect. 3.1 is applied for the partial ozone column simulated by ATOLL in the 350–650 K range (POC) and the accumulated ozone loss in the same potential temperature range (AOL). The POC values inside and inner edge of the vortex (POCi) and POC climatology (POCcli) are defined in Eqs. (4) and (5), respectively.
POCi(λ, ϕ, d )= POCi dyn(λ, ϕ, d ) − AOLi hom(λ, ϕ, d ) − AOLi het(λ, ϕ, d ) (4)
15
POCcl i(λ, d )= POCdyn cli(λ, d ) − AOLhom cli(λ, d ) − AOLhet cli(λ, d ) (5) Where POCi dyn corresponds to the partial ozone column affected only by trans-port processes at latitude λ, longitude ϕ and day d . The AOLi hom(λ, ϕ, d ) and
AOLi het(λ, ϕ, d ) correspond to the ozone loss at the latitude λ, longitude ϕ and day
d . The former one is due to homogeneous chemistry only while the latter one is due to
20
heterogeneous chemistry only. The different terms in Eq. (5) represent the same pa-rameters of Eq. (4) but for the climatology over the 1997–2005 period. The climatology is determined for situations outside the vortex and the values are zonally averaged.
The partial ozone column differences were computed as described in Eq. (6): ∆POC (λ, ϕ, d ) POCcli(λ, d ) = ∆POCdyn(λ, ϕ, d ) POCcli(λ, d ) −∆AOLhom(λ, ϕ, d ) POCcli(λ, d ) −∆AOLhet(λ, ϕ, d ) POCcli(λ, d ) (6) 25
ACPD
8, 6501–6537, 2008 Increased UV radiation at southern sub-polar latitudes A. F. Pazmino et al. Title Page Abstract Introduction Conclusions References Tables Figures ◭ ◮ ◭ ◮ Back CloseFull Screen / Esc
Printer-friendly Version Interactive Discussion
Where for each termX of the right hand side of Eq. (6)
∆X (λ, ϕ, d ) POCcli(λ, d )
=Xi(λ, ϕ, d ) − Xcli(λ, d ) POCcli(λ, d )
(7) The climatological values of POCdyn cli, AOLhom cli and AOLhet cli are calculated as in Sect. 3.1. Table 1b shows the mean relative values of these parameters for September–November of the 1997–2005 period in the 50◦S–60◦S latitude region.
5
Table 1a shows that the model presents mean TOC decrease values larger than TOMS ones in September and October. This is due to an overestimation of the ozone depletion by the model for TOC values inside the vortex (7% in average). The differ-ences of the mean TOC decreases between ATOLL and TOMS are larger in October but they are generally smaller than 4% according to the table. The correlation
co-10
efficient between ATOLL and TOMS ozone differences is 0.74 in September, 0.68 in October and 0.78 in November.
The largest UV and ozone changes due to vortex occurrences are found in October. Over the whole 1997–2005 period, vortex occurrences induce a mean UVI increase of 47.3% as compared to climatological value. This UVI increase is associated to a
15
mean total ozone decrease of 32.7% computed from TOMS and 36.4% from ATOLL. It corresponds to an average ozone decrease of 63% in the 350–650 K altitude range. The average values of UVI increase for both other months are smaller. September presents a mean UVI increase similar in absolute value to the average TOC difference, which yields a weaker amplification factor as compared to Madronich et al. results.
20
This can be explained by the fact that the maximum reflectivity value for quasi clear sky conditions in September is rather large, 27.5% as shown in Fig. 1. This value is due to a poorer statistical sampling of clear sky conditions during this month as compared to the other months, together with a higher dispersion of the UV index values as shown in Fig. 1 by the larger error bars of the average UV index as a function of reflectivity in
25
the lower reflectivity values range.
As expected, polar air masses linked to vortex occurrences are mostly influenced by the ozone loss due to heterogeneous chemistry (AOLhet) as shown in Table 1b. In
ACPD
8, 6501–6537, 2008 Increased UV radiation at southern sub-polar latitudes A. F. Pazmino et al. Title Page Abstract Introduction Conclusions References Tables Figures ◭ ◮ ◭ ◮ Back CloseFull Screen / Esc
Printer-friendly Version Interactive Discussion
September, this difference in ozone loss amounts to about 52% of the partial ozone column climatological value. October shows a mean AOLhet difference of 63.8%. In November, the values are smaller than in October. The mean differences of ozone loss due to homogeneous processes are generally positive and of the order of 4.5%. The effect of dynamical processes is relatively weak in the spring period as compared to that
5
of heterogeneous processes. The effect of dynamical processes and homogeneous chemistry are comparable in the different months.
6 Combined effect of cloud cover and vortex occurrences on UV radiation
According to ATOLL simulations and vortex classification, some regions were shown to be more affected by vortex occurrences (Fig. 4). However, the cloud cover can
10
mask the effect of vortex occurrences with low ozone values on the evolution of the UV radiation reaching the surface. In order to determine the regions that are the most vulnerable to potential UV enhancement in a cloud cover decrease scenario during the period of high stratospheric effective chlorine level, the previous analysis was per-formed considering a larger threshold for the reflectivity values, allowing thus a larger
15
number of vortex occurrences to be selected. This threshold corresponds to mean pos-itive UV changes in Fig. 1: 40% for September and October, and 25% for November. The analysis was performed for four regions determined in the 50◦S–60◦S latitude band. Figure 6 shows the total number of vortex occurrences over the 1997–2005 period (left panels) for the previously defined clear sky conditions: reflectivity lower
20
than 27.5% for September, 22.5% for October and 12.5% for November. The middle and right panels correspond to mean TOC differences and UVI changes respectively from TOMS measurements. The 4 regions correspond to the following longitude bands (1) [30◦W–120◦W]; (2) [120◦W–150◦E], (3) [150◦E–60◦E] and (4) [60◦E–30◦W]. They are shown in Fig. 6. We observe that in September and October the number of vortex
25
occurrences with quasi-clear sky conditions over the studied period is the largest in region 1, where it varies from 5 to 20 d over the 9 yr close to the southern part of South
ACPD
8, 6501–6537, 2008 Increased UV radiation at southern sub-polar latitudes A. F. Pazmino et al. Title Page Abstract Introduction Conclusions References Tables Figures ◭ ◮ ◭ ◮ Back CloseFull Screen / Esc
Printer-friendly Version Interactive Discussion
America. In region 1, the ozone decrease varies from 20% to 50% in both months but it presents the largest values in October. The corresponding UVI increases range from 25% to 100%. The other regions present negligible values compared to region 1 in both months. November is characterized by weaker number vortex occurrences in the different regions. Slightly higher influence of vortex overpasses is observed in region 1
5
and 3 during this month (<6 d). In these regions, the average TOC decrease and UVI
increase reach 35% and 100%, respectively, in some elementary grid area (1◦×1◦). Table 2 shows for September, October and November the average number of vor-tex occurrences in the 4 regions of the 50◦S–60◦S latitude band, together with the mean value for the whole latitude band. The TOC differences and the corresponding
10
2σ standard error for the new quasi-clear sky conditions are also presented. The
vor-tex occurrences are shown for quasi-clear sky conditions (VO1: 27.5% for September, 22.5% for October and 12.5% for November, see Fig. 6) and for the new quasi-clear sky scenario (VO2: 40% for September and October and 25% for November). The absolute difference between mean relative TOC decreases between relaxed and non
15
relaxed quasi-clear sky conditions is lower than ±2% for most regions, except region 2 that presents a larger value (±4%) in the October–November period. As seen in previous results, October is the month characterized by the largest ozone decreases in most regions. Region 1 (R1) corresponding to the populated areas of South America is the most affected by vortex occurrences in a possible cloudiness decrease scenario
20
(situations with reflectivity<40%) with a mean VO2value of around 24 d in September and October and 5 d in November over the 9 yr. In addition, this region presents the largest mean TOC decrease values compared to the other regions in September and October. A mean TOC decrease of about 30% is computed for these months, corre-sponding to a mean UV increase of 35%, according to Fig. 5. In such a scenario, the
25
populated regions of South America would see the largest increase in the number of vortex occurrences in September and October, the months when the UV increase is largest. The others regions (2 to 4) show substantially lower increase in the number of vortex occurrences, with generally lower average ozone decreases. However the
ACPD
8, 6501–6537, 2008 Increased UV radiation at southern sub-polar latitudes A. F. Pazmino et al. Title Page Abstract Introduction Conclusions References Tables Figures ◭ ◮ ◭ ◮ Back CloseFull Screen / Esc
Printer-friendly Version Interactive Discussion
relative increase in the number of vortex occurrences defined as VOAF =VO2/VO1, is almost similar in all 4 regions. Region 4 shows a larger VOAF in October (4.5) with a large ozone decrease (32%) but with a smaller number of occurrences as compared to region 1 (10 to 24 d respectively over the 9 yr). In November, lower TOC decreases and number of vortex occurrences are observed in all 4 regions as compared to both
5
other months. Region 2 is the least affected area due to weak ozone decrease (6%) and a weak increase in the number of vortex occurrence (1.1 to 1.7 d). Regions 1, 3 and 4 present similar and moderate TOC decrease values (16 to 21%) and weak vortex occurrences (4 to 5 d over the 9 yr).
7 Summary and conclusions
10
UV index together with total ozone and reflectivity data from TOMS were used in order to characterize the UV enhancement in sub-polar regions associated with intrusion of polar ozone depleted air masses in the 1997–2005 period. The frequency of vortex occurrences was found to be larger than 90% in regions polewards of 70◦S except in 2002 due to the major warming at the end of September. Northward of 60◦S,
vor-15
tex occurrence frequencies showed large interannual variability from one year to the next. In the studied period, a longitudinal asymmetry of vortex occurrences over the subpolar regions was observed, presenting the highest frequency values in the (90◦W– 90◦E) sector for the 40◦S–60◦S latitude band. In these regions, vortex occurrences are mostly observed during the September–November period. This is explained by the
20
higher planetary wave activity during this period, moving the vortex to subpolar regions. The study was thus focused in the September–November period in the 50◦S–60◦S lat-itude band to highlight the influence of vortex occurrences on UV and total ozone over these regions. The results corresponding to the 40◦S–50◦S latitude band was also analyzed for comparison.
25
Total ozone differences and UVI changes were evaluated by comparing the situa-tions inside the vortex with climatological values corresponding to situasitua-tions outside
ACPD
8, 6501–6537, 2008 Increased UV radiation at southern sub-polar latitudes A. F. Pazmino et al. Title Page Abstract Introduction Conclusions References Tables Figures ◭ ◮ ◭ ◮ Back CloseFull Screen / Esc
Printer-friendly Version Interactive Discussion
the vortex. In the case of UVI and for situations inside the vortex, a relaxed condition was determined for clear sky conditions by evaluating the UV changes as a function of reflectivity. In such conditions, UVI increases larger than 100% for TOC decreases larger than 45% were observed in September, October and November in the 50◦S– 60◦S latitude band and September and October in the 40◦S–50◦S one. As expected,
5
the 50◦S–60◦S latitude band presents the highest UVI increases. November shows the lowest UVI increases and TOC decreases in both latitude bands. The average value of the number of vortex occurrences combined with quasi-clear sky conditions over the 50◦S–60◦S latitude band is quite small, ∼5 d for September, ∼4 d for October and 1.5 d for November. But values of vortex occurrences had reached 20 d on September and
10
October close to the south of America continent.
A high resolution (1◦×1◦) transport model coupled to an ozone loss parameteriza-tion scheme (called ATOLL) was used in order to characterize the evoluparameteriza-tion of the ozone loss in the Southern Hemisphere between 1997 and 2005 for the 50◦S–60◦S latitude band. The simulations showed correct agreement with sondes and SAGE II
15
measurements in the 350–650 K potential temperature range. October is the period with maximum average increase of UVI, ozone loss and decrease of total columns for the 50◦S–60◦S latitude band. As expected, the accumulated ozone loss (AOL) due to heterogeneous reactions represents the highest contribution to ozone decrease in the 350–650 K altitude range (AOLhet∼=64%). These mean values of UVI and TOC
dif-20
ferences are mostly weighed by values in region 1 (R1 – South America, see upper panels of Fig. 6) due to rather low cloud cover percentage in this region.
In order to determine the most vulnerable regions to potential UV enhancements linked to vortex occurrences in a cloudiness diminution scenario, the number of vortex occurrences and total ozone difference from TOMS measurements were computed
25
for situations with new relaxed reflectivity conditions. The vortex occurrences with a new relaxed reflectivity threshold of 40% for September and October, and 25% for November, corresponding to positive UV changes, were considered as an extreme scenario for cloud cover decrease. In such conditions, October still shows the highest
ACPD
8, 6501–6537, 2008 Increased UV radiation at southern sub-polar latitudes A. F. Pazmino et al. Title Page Abstract Introduction Conclusions References Tables Figures ◭ ◮ ◭ ◮ Back CloseFull Screen / Esc
Printer-friendly Version Interactive Discussion
ozone decrease values in the considered regions. The region close to South America stands out as the most sensitive region due to the combined effect of large number of vortex occurrences, rather low cloud cover and large ozone decrease. This is the case for the three months considered in this study. In this region, the mean number of vortex occurrences over the 1997–2005 period would increase from ∼6 d in quasi
5
clear sky conditions to ∼24 d with a corresponding mean ozone decrease of ∼38% in October. Such ozone decrease would induce a mean UV enhancement of 50%. The regions 2 to 4 show a little lower or comparable values of TOC decreases and vortex occurrences compared to the mean values considering the whole 50◦S–60◦S latitude band in September and October. As in the whole subpolar latitude regions, the
10
dilution of the polar vortex in November and December induces an enhancement of UV radiation in these regions as compared to pre-ozone hole conditions, but they are statistically much less affected by large sudden UV increase.
Due to the large correlation between the UVB range with the erythemal irradiance (or UVI) and other biological irradiances sensible to this solar spectral range (ADN and
15
eye damage, carcinogenesis, phytoplankton, etc.) (UNEP, 2007), the present results could be extended to the analysis of these biological effects. Since 4 September 2007, corrected data set for ozone and reflectivity calculated by Version 8 are available from TOMS webpage (ftp://toms.gsfc.nasa.gov/pub/eptoms/data/ozone/). The two V8 were compared for ozone and reflectivity distinguishing the data considered inside and
out-20
side (climatology) the vortex following the definition given in Sect. 2.1 of this paper. Only the 50◦S–60◦S latitude band was considered. The differences in total ozone value are rather small between both versions. Monthly average ozone values in the new version are larger by 4 to 5 DU for both inside and outside vortex situations in the 3 months considered in this study, while the correlation coefficient are very close to
25
1. The difference between both versions is larger in the reflectivity data. The new V8 reflectivity presents a monthly average underestimation of 0 to 3% reflectivity value for both situations in the analyzed months. The correlation coefficient is 0.92 for Septem-ber, 0.96 for October and 0.85 for November for inside situations. Weaker values were
ACPD
8, 6501–6537, 2008 Increased UV radiation at southern sub-polar latitudes A. F. Pazmino et al. Title Page Abstract Introduction Conclusions References Tables Figures ◭ ◮ ◭ ◮ Back CloseFull Screen / Esc
Printer-friendly Version Interactive Discussion
found for the outside situations (reflectivity <7.5%), 0.67 for September, 0.78 for
Oc-tober and 0.69 for November. We estimated that this new reflectivity data could have some impact on the UV analysis. A new study using the methodology described in this paper will be performed when a coherent ozone/UV/reflectivity data set comes out and a comparison will be made with the results obtained in this work
5
Acknowledgements. The authors thank the TOMS team for providing the ozone, UV and re-flectivity data and ECMWF for meteorological data. R. D. Piacentini acknowledge the support provided by the Argentina Agency for the Promotion of Science and Technology and CON-ICET. This work was performed within the ORACLE-O3 France project funded by the Agence Nationale pour La Recherche.
10
References
Allen, D., Bevilacqua, R., Nedoluha, G., Randall, C., and Manney, G.: Unusual strato-spheric transport and mixing during 2002 Antarctic winter, Geophys. Res. Lett., 30, 1599, doi:10.1029/2003GL017117, 2003.
Bevilacqua, R. M., Fromm, M. D., Alfred, J. M., Hornstein, J. S., Nedoluha, G. E., Hoppel, 15
K. W., Lumpe, J. D., Randall, C. E., Shettle, E. P., Browell, E. V., Butler, C., D ¨ornbrack, A., and Strawa, A. W.: Observations and analysis of polar stratospheric clouds detected by POAM III during the 1999/2000 Northern Hemisphere winter, J. Geophys. Res., 107(D20), 8281, doi:10.1029/2001JD000477, 2002.
Bodeker, G. E., Struthers, H., and Connor, B. J.: Dynamical containment of Antarctic ozone 20
depletion, Geophys. Res. Lett., 29, 1098, doi:10.1029/2001GL014206, 2002.
Casiccia, C., Kirchhoff, V. W. J. H., and Torres, A.: Simultaneous measurements of ozone and ultraviolet radiation: Spring 2000, Punta Arenas, Chili, Atmos. Environ., 37(3), 383–389, 2003.
Cede, A., Luccini, E., Nu ˜nez, L., Piacentini, R. D., and Blumthaler, M.: Monitoring of ery-25
themal irradiance in the Argentine Ultraviolet Network, J. Geophys. Res., 107(D13), 4165, doi:10.1029/2001JD001206, 2002.
ACPD
8, 6501–6537, 2008 Increased UV radiation at southern sub-polar latitudes A. F. Pazmino et al. Title Page Abstract Introduction Conclusions References Tables Figures ◭ ◮ ◭ ◮ Back CloseFull Screen / Esc
Printer-friendly Version Interactive Discussion
the lower stratospheric temperature over the Southern Hemisphere: The MSU view. Part I: Methodology and temporal behaviour, Int. J. Climatol., 21, 1215–1228, 2001.
Eck, T. F., Barthia, P. K., Wang, P. H., and Stowe, L. L.: Reflectivity on Earth’s surface and clouds in ultraviolet from satellite from satellite observations, J. Geophys. Res., 92, 4287– 4296, 1987.
5
Fortuin, J. P. F. and Kelder, H.: An ozone climatology based on ozonesonde and satellite mea-surements, J. Geophys. Res., 103(D24), 31 709–31 734, 1998.
Gille, J. C. and Russell III, J. M.: The Limb Infrared Monitor of the Stratosphere: Experiment Description, Performance, and Results, J. Geophys. Res., 89(D4), 5125–5140, 1984. Godin, S., Bergeret, V., Bekki, S., David, C., and M ´egie, G.: Study of the interannual ozone loss 10
and permeability of the Antarctic polar vortex from aerosols and ozone lidar measurements in Dumont d’Urville (66.4◦S, 140◦E), J. Geophys. Res., 106(D1), 1311–1330, 2001.
Hadjinicolaou, P. and Pyle, J. A.: The Impact of Arctic Ozone Depletion on Northern Middle Latitudes: Interannual Variability and Dynamical Control, J. Atmos. Chem., 47, 1, 25–43, 2004.
15
Hanson, D. and Mauersberger, K.: Laboratory Studies of the Nitric Acid Trihydrate: Implications for the South Polar Stratosphere, Geophys. Res. Lett., 15, 855–858, 1988.
Hauchecorne, A., Godin, S., Marchand, M., Heese, B., and Souprayen, C.: Estimation of the Transport of Chemical Constituents from the Polar Vortex to Middle Latitudes in the Lower Stratosphere using the High-Resolution Advection Model MIMOSA and Effective Diffusivity, 20
J. Geophys. Res., 107(D20), 8289, doi:10.1029/2001JD000491, 2002.
Herman, J. R. and Celarier, E. A.: Earth surface reflectivity climatology at 340–380 nm from TOMS data, J. Geophys. Res., 102, 28 003–28 011, 1997.
Hoppel, K., Bevilacqua, R., Allen, D., Nedoluha, G., and Randall, C.: POAM III obser-vations of the anomalous 2002 Antarctic ozone hole, Geophys. Res. Lett., 30, 1394, 25
doi:10.1029/2003GL016899, 2003.
Huth, R. and Canziani, P.: Classification of hemispheric monthly mean stratospheric potential vorticity fields, Ann. Geophys., 21, 805–817, 2003,
http://www.ann-geophys.net/21/805/2003/.
Kirchhoff, V. W. J. H., Sahai, Y., Casiccia S., C. A. R., Zamorano B., S. F., and Valderrama, V. 30
V.: Observations of the 1995 ozone hole over Punta Arenas, Chile, J. Geophys. Res., 102, 16 109–16 120, 1997.
ACPD
8, 6501–6537, 2008 Increased UV radiation at southern sub-polar latitudes A. F. Pazmino et al. Title Page Abstract Introduction Conclusions References Tables Figures ◭ ◮ ◭ ◮ Back CloseFull Screen / Esc
Printer-friendly Version Interactive Discussion
Beck, T., Beach, E., McPeters, R., Stolarski, R., Bhartia, P. K., DeLand, M. T., and Huang, L.-K.: Vertical Structure of the Anomalous Antarctic Ozone Hole, J. Atmos. Sci., 62(3), 801– 811, 2005.
Krotkov, N., Herman, J., Bhartia, P. K., Seftor, C., Arola, A., Kaurola, J., Kalliskota, S., Taalas, P., and Geogdzhaev, I. V.: Version 2 total ozone mapping spectrometer ultraviolet algorithm: 5
problems and enhancements, Opt. Eng., 41(12), 3028–3039, 2002.
Labow, G. J., McPeters, R. D., and Bhartia, P. K.: A Comparison of TOMS & SBUV Version 8 Total Column Ozone Data with Data from Groundstations, Proceedings of the Quadrennial Ozone Symposium, Kos, Greece, 1–8 June 2004, 295–296, 2004.
Madronich, S., McKenzie, R. L., Bj ¨orn, L. O., and Caldwell, M. M.: Changes in biologically 10
active ultraviolet radiation reaching the Earth’s surface, J. Photoch. Photobio. B, 46, 5–19, 1998.
Marchand, M., Bekki, S., Pazmino, A., Lef `evre, F., Godin-Beekmann, S., and Hauchecorne, A.: Model Simulations of the Impact of the 2002 Antarctic Ozone Hole on the Midlatitudes, J. Atmos. Sci., 62(3), 871–884, 2005.
15
Mauldin, L. E. III, Zaun, N. H., McCormick, M. P., Guy, J. H., and Vaughn, W. R.: Stratospheric Aerosol and Gas Experiment II Instrument: A Functional Description, Opt. Eng., 24(2), 307– 312, 1985.
McIntyre, M. and Palmer, T.: The “surf-zone” in the stratosphere, J. Atmos. Terr. Phys., 46, 825–849, 1984.
20
McLinden, C. A., Olsen, S. C., Hannegan, B., Wild, O., Prather, M. J., and Sundet, J.: Strato-spheric ozone in 3-D models: A simple chemistry and the cross-tropopause flux, J. Geophys. Res., 105(D11), 14 653–14 665, 2000.
McPeters, R. D., Bhartia, P. K., Krueger, A. J., Herman, J. R., Wellemeyer, Ch. G., Seftor, C. J., Jaross, G., Torres, O., Moy, L., Labow, G., Byerly, W., Taylor, S. L., Swissler, T., and Cebula, 25
R. P.: Earth Probe Total Ozone Mapping Spectrometer (TOMS) Data Products User’s Guide, Nasa Technical Publication, Goddard Space Flight Center/NASA, Greenbelt, MD, 64 pp., 1998.
Nash, E. R., Newman, P. A., Rosenfield, J. E., and Schoeberl, M. E.: An objective determination of the polar vortex using Ertel’s potential vorticity, J. Geophys. Res., 101, 9471–9478, 1996. 30
Newman, P. A., Nash, E. N., Kawa, S. R., Montzka, S. A., and Schauffler, S. M.: When will the Antarctic ozone hole recover?, Geophys. Res. Lett., 33, L12814, doi:10.1029/2005GL25232, 2006.
ACPD
8, 6501–6537, 2008 Increased UV radiation at southern sub-polar latitudes A. F. Pazmino et al. Title Page Abstract Introduction Conclusions References Tables Figures ◭ ◮ ◭ ◮ Back CloseFull Screen / Esc
Printer-friendly Version Interactive Discussion
Parrondo M. C., Yela, M., Gil, M., von der Gathen, P., and Ochoa, H.: Mid-winter coger strato-sphere temperatures in the Antarctic vortex: comparison between observations and ECMWF and NCEP operational models, Atmos. Chem. Phys., 7, 435–441, 2007,
http://www.atmos-chem-phys.net/7/435/2007/.
Pazmi ˜no A. F., Godin-Beekmann, S., Ginzburg, M., Bekki, S., Hauchecorne, A., Piacentini, R., 5
and Quel, E.: Impact of Antarctic polar vortex occurrences on total ozone and UVB radiation at southern Argentinean and Antarctic stations during 1997–2003 period, J. Geophys. Res., 110, D03103, doi:10.1029/2004JD005304, 2005.
P ´erez, A., Crino, E., Aguirre de C ´arcer, I., and Jacque, F.: Low-ozone events and three-dimensional transport at midlatitudes of South America during springs of 1996 and 1997, 10
J. Geophys. Res., 105(D4), 4553–4561, 2000.
Randall, C. E., Manney, G. L., Allen, D. R., Bevilacqua, R. M., Hornstein, J., Trepte, C., La-hoz, W., Ajtic, J., and Bodeker, G.: Reconstruction and Simulations of Stratospheric Ozone Distributions during the 2002 Austral Winter, J. Atmos. Sci., 62, 748–764, 2005.
Scaife, A. A., Jackson, D. R., Swinbank, R., Butchart, N., Thoraton, H. E., Keil, M., and Hender-15
son, L.: Stratospheric vacillations and the major warming over Antarctica in 2002, J. Atmos. Sci., 62, 629–639, 2005.
Shine, K.: The middle atmosphere in the absence of dynamical heat flux, Q. J. Roy. Meteor. Soc., 113, 603–633, 1987.
Tripathi, O. P., Godin-Beekmann, S., Lef `evre, F., Marchand, M., Pazmi ˜no, A., Hauchecorne, A., 20
Goutail, F., Schlager, H., Volk, C. M., Johnson, B., K ¨onig-Langlo, G., Balestri, S., Stroh, F., Bui, T. P., Jost, H. J., Deshler, T., and von der Gathen, P.: High resolution simulation of recent Artic and Antarctic stratospheric chemical ozone loss compared to observations, J. Atmos. Chem., 55, 3, 205–226, doi:10.1007/s10874-006-9028-8, 2006.
UNEP (United Nations Environment Programme), Environmental effects of ozone depletion: 25
1998 Assessment, UNEP, 205 pp., 1998.
UNEP (United Nations Environment Programme), Environmental effects of ozone depletion and its interaction with climate change: 2006 Assessment, UNEP, 2007.
Wang, P., Li, Z., Cihlar, J., Wardle, D. I., and Kerr, J.: Validation of an UV inversion algorithm using satellite and surface measurements, J. Geophys. Res., 105(D4), 5037–5048, 2000. 30
WHO (World Health Organization), Global solar UV index: A practical guide, WHO/SDE/OEH, 2, Geneva, Switzerland, 2002.
ACPD
8, 6501–6537, 2008 Increased UV radiation at southern sub-polar latitudes A. F. Pazmino et al. Title Page Abstract Introduction Conclusions References Tables Figures ◭ ◮ ◭ ◮ Back CloseFull Screen / Esc
Printer-friendly Version Interactive Discussion
Global Ozone Research and Monitoring Project-Report No. 47, Geneva, Switzerland, 2003. WMO (World Meteorological Organization), An Overview of the 2005 Antarctic Ozone Hole,
Global Ozone Research and Monitoring Project-Report No. 49, Geneva, Switzerland, 2006. WMO (World Meteorological Organization), Scientific Ozone Assessment of Ozone Depletion:
2006, Global Ozone Research and Monitoring Project-Report No. 50, Geneva, Switzerland, 5
2007.
Zwally, M. J., Comiso, J. C., Parkinson, C. L., and Cavalieri, D. J.: Variability of Antarctic sea ice 1979–1998, J. Geophys. Res., 107(C5), 3041, doi:10.1029/2000JC000733, 2002. 10
ACPD
8, 6501–6537, 2008 Increased UV radiation at southern sub-polar latitudes A. F. Pazmino et al. Title Page Abstract Introduction Conclusions References Tables Figures ◭ ◮ ◭ ◮ Back CloseFull Screen / Esc
Printer-friendly Version Interactive Discussion
Table 1. (a) Mean UVI and TOC relative differences of TOMS and TOC relative differences of
ATOLL for the 50◦S–60◦S latitude band and the corresponding 2σ Standard Error according to
classification with maximum admissible reflectivity value for September, October and Novem-ber. These values were average over the 1997–2005 period. The monthly values of the mean spatial vortex occurrences are shown in the last column.
Mean relative values Mean spatial values
Month ∆UVIUVI
cli ∆TOCT TOCTcli ∆TOCA TOCAcli VOsp % % % d September 24.6±0.6 −26.4±0.3 −29.1±0.2 4.7±0.2 October 47.3±1.0 −32.7±0.3 −36.4±0.2 3.8±0.2 November 26.1±1.5 −16.6±0.6 −17.8±0.5 1.5±0.1