Supporting Information
Lock-in thermography to analyze plasmonic nanoparticle dispersions
Lukas Steinmetz, Patricia Taladriz-Blanco*, Christoph Geers, Miguel Spuch-Calvar, Mathias Bonmarin, Sandor Balog, Barbara Rothen-Rutishauser, Alke Petri-Fink*
Experimental Section
Chemicals and Materials. Tetrachloroauric acid (99%, HAuCl4 • 3H2O), sodium citrate tribasic dihydrate (≥98%, C6H5Na3O7 • 2H2O), silver nitrate (≥99%, AgNO3), tannic acid (99%, C76H52O46) and L-glutathione reduced (GSH) (≥98%, C16H17N3O6S) were purchased from Sigma-Aldrich, Switzerland. Hydrochloric acid (37%, HCl) was obtained from VWR Chemicals, France and sodium hydroxide (≥98%, NaOH) as well as hydroxylamine
hydrochloride (≥99%, H3NO • HCl) from Fluka, Switzerland. Milli-Q water was used for all synthesis and experiments.
Synthesis of glutathione-functionalized gold nanospheres (Au@GSH). AuNPs were
prepared by the Turkevich method.[42] Briefly, a 0.5 mM gold solution was boiled in the presence of 1.5 mM of sodium citrate. The resulting citrate capped AuNPs with a core diameter of 15 nm were functionalized with GSH, by mixing 0.1 mM of Au sols with a 0.1 mM GSH aqueous solution. 42 nm AuNPs were prepared by reduction of gold salt (0.5 mM) with hydroxylamine hydrochloride (0.2 M) in the presence of as-prepared 15 nm AuNPs (0.0125 mM).[43]
Synthesis of glutathione-functionalized silver nanospheres (Ag@GSH). The synthesis of
silver NPs was carried out following the synthetic procedure described by ast s et al.[41] Briefly, a 100 mL mixture of 5 mM sodium citrate and 0.1 mM tannic acid was refluxed in a two-neck rounded flask. After boiling, 1 ml of a 25 mM AgNO3 aqueous solution was added to the mixture. The resulting Ag dispersion was cooled down to room temperature and cleaned by centrifugation at 4500 g for 60 min. AgNPs were functionalized with GSH by mixing 0.1 mM of as-prepared AgNPs with 0.1 mM of GSH.
Reversibly controlled NP aggregation. Controlled aggregation of GSH-functionalized NPs
was carried out by an alternating addition of 10 µl aliquots of 1 M HCl and 1 M NaOH to a 2 ml NP dispersion.
UV-Vis spectroscopy. UV-Vis spectra of GSH-functionalized NPs were recorded at room
temperature with a Jasco V-670 spectrophotometer using a 10 mm path length quartz suprasil cuvette (Hellma Analytics).
Transmission electron microscopy (TEM). A Tecnai Spirit transmission electron
microscope (FEI) operating at 120 kV was used to measure the size of the NPs and to evaluate their assembly-disassembly behavior at different pHs. Samples were prepared by drop casting 5 µl of the NP dispersion on a copper carbonated mesh grids (300 mesh, EMS). Images were acquired with a Veleta CCD camera (Olympus) and the NP core diameters were determined with the ImageJ v1.52 software.
Dynamic light scattering (DLS), zeta potential and pH measurements. The hydrodynamic
diameter and the zeta-potential of the GSH-functionalized NPs were recorded with a Brookhaven 90Plus Particle Size Analyzer. The effective surface charge of the NPs was analyzed using phase amplitude light scattering (ZetaPALS) in water. The means and the standard deviation of ten DLS and zeta potential measurements were estimated. pH values of
the dispersions were determined with a sympHony meter equipped with a pH SM 123 electrode (VWR).
Limit of detection (LOD) and limit of quantification (LOQ). The LOD and the LOQ for
Figure 1 were obtained by 95% confidence bands after Hubaux and Vos.[44]
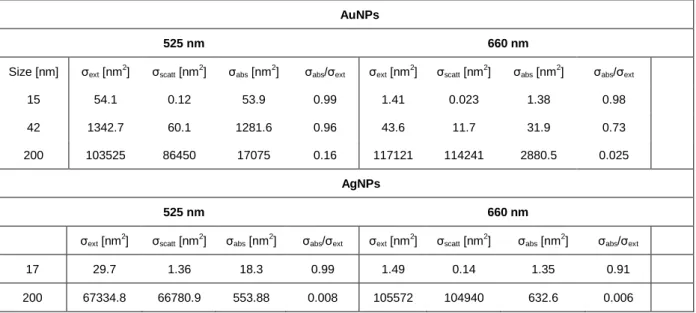
Table S1. Extinction, scattering and absorption coefficients of Au & AgNPs.
AuNPs
525 nm 660 nm
Size [nm] σext [nm2] σscatt [nm2] σabs [nm2] σabs/σext σext [nm2] σscatt [nm2] σabs [nm2] σabs/σext
15 54.1 0.12 53.9 0.99 1.41 0.023 1.38 0.98 42 1342.7 60.1 1281.6 0.96 43.6 11.7 31.9 0.73 200 103525 86450 17075 0.16 117121 114241 2880.5 0.025 AgNPs 525 nm 660 nm σext [nm 2 ] σscatt [nm 2 ] σabs [nm 2
] σabs/σext σext [nm 2 ] σscatt [nm 2 ] σabs [nm 2 ] σabs/σext 17 29.7 1.36 18.3 0.99 1.49 0.14 1.35 0.91 200 67334.8 66780.9 553.88 0.008 105572 104940 632.6 0.006
Table S2. Limit of detection (LOD) and limit of quantification (LOQ) of 15 nm and 42 nm
AuNPs at different wavelengths. 15 nm AuNPs, 525 nm 15 nm AuNPs, 660 nm 42 nm AuNPs, 525 nm 42 nm AuNPs, 660 nm LOD [mM] 0.06 0.06 0.03 0.14 LOQ [mM] 0.11 0.12 0.06 0.22
Table S3. Parameters of dispersed, aggregated and re-dispersed GSH-functionalized Au and
AgNPs. AuNPs @ GSH Dispersed NPs Aggregated NPs Re-dispersed NPs AgNPs @ GSH Dispersed NPs Aggregated NPs Re-dispersed NPs DC [nm] (TEM) 14.8 ± 2 17.3 ± 6 DH [nm] (DLS) 18.9 ± 2 1372.5 ± 64 19.3 ± 1 36.2 ± 1 901.4 ± 280 36.5 ± 1 ζ-potential [mV] -10.9 ± 4 17.1 ± 2 -22.1 ± 4 -19.3 ± 8 -3.6 ± 3 -31.7 ± 7 pH 4.3 2.2 5.9 4.3 2.3 7.4
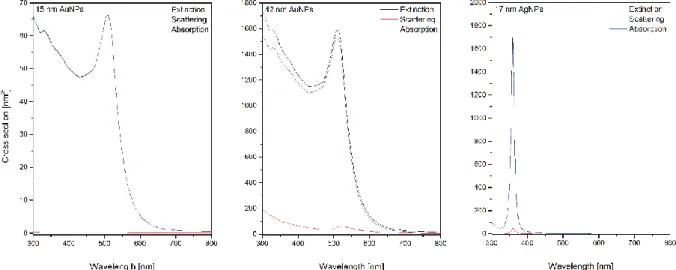
Figure S1. Extinction, scattering and absorption cross sections of the investigated Au &
AgNPs.
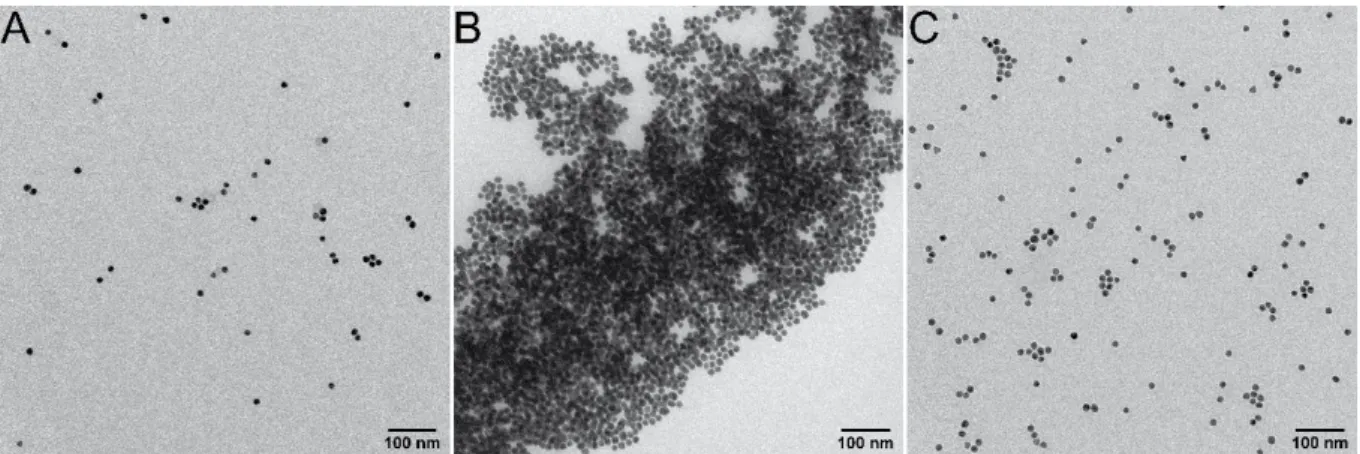
Figure S3. TEM micrographs of 15 nm AuNPs functionalized with GSH at different pHs. pH
4.3 (A), pH 2.2 (B) and pH 5.9 (C) demonstrating the reversible assembly of the particles.
Figure S4. TEM micrographs of 17 nm AgNPs functionalized with GSH at different pHs. pH
Figure S5. Variation of LIT amplitude signal for a dispersed and aggregated (A)
AuNPs@GSH and (B) AgNPs@GSH dispersion while excited with LED light centered at 660 nm and 525 nm, respectively.
References
[41] N. G. Bastús, F. Merkoçi, J. Piella, V. Puntes, Chem. Mater. 2014, 26, 2836. [42] B. V. Enüstün, J. Turkevich, J. Am. Chem. Soc. 1963, 85, 3317.
[43] K. R. Brown, M. J. Natan, Langmuir 1998, 14, 726. [44] A. Hubaux, G. Vos, Anal. Chem. 1970, 42, 849.