Publisher’s version / Version de l'éditeur:
Annals of Glaciology, 13, pp. 241-247, 1989
READ THESE TERMS AND CONDITIONS CAREFULLY BEFORE USING THIS WEBSITE. https://nrc-publications.canada.ca/eng/copyright
Vous avez des questions? Nous pouvons vous aider. Pour communiquer directement avec un auteur, consultez la première page de la revue dans laquelle son article a été publié afin de trouver ses coordonnées. Si vous n’arrivez pas à les repérer, communiquez avec nous à [email protected].
Questions? Contact the NRC Publications Archive team at
[email protected]. If you wish to email the authors directly, please see the first page of the publication for their contact information.
NRC Publications Archive
Archives des publications du CNRC
This publication could be one of several versions: author’s original, accepted manuscript or the publisher’s version. / La version de cette publication peut être l’une des suivantes : la version prépublication de l’auteur, la version acceptée du manuscrit ou la version de l’éditeur.
Access and use of this website and the material on it are subject to the Terms and Conditions set forth at
The Avalanche-Hazard Index
Schaerer, P. A.-V
https://publications-cnrc.canada.ca/fra/droits
L’accès à ce site Web et l’utilisation de son contenu sont assujettis aux conditions présentées dans le site
LISEZ CES CONDITIONS ATTENTIVEMENT AVANT D’UTILISER CE SITE WEB.
NRC Publications Record / Notice d'Archives des publications de CNRC:
https://nrc-publications.canada.ca/eng/view/object/?id=58656d6e-a227-41b6-a7e4-e5c2ea6e3cb0
https://publications-cnrc.canada.ca/fra/voir/objet/?id=58656d6e-a227-41b6-a7e4-e5c2ea6e3cb0
S e r
I
TH1
National Research
Consell national
1
N 2 1 d
I
Council Canada
de
recherches Canada
no.
1627
1
C .2
,Institute for
lnstitut de
Research in
recherche en
BLDGF
construction
construction
The A valanche-Hazard Index
by P. Schaerer
ANALYZED
Reprinted from
Annals of Glaciology 13,1989
p. 241 -247
(IRC Paper No. 1627)
NRCC 31
060
L'indice
de
danger
d'avalanche est une expression nudrique des donrmages et pertes
dsultant
de
l'interaction
d'une
avalanche et des vdhicules se trouvant sur une route.
On
le
dhrrnine
en mdtiphant
la
Mquence
avec
laquelle les vdhicules en
mtmhe
ou en attente
sont fmpp6 gar
divers
types
d'avalanche,
par
un
coefficient indiquant la gravit6 des
con&quences.
L'inBice de danger
d'avalanclie s'est dvdld
&re
un outil dkisionnaire utile
POUT
l'identiication &s
trajets
d'avalanche
oh
il
serait tr&s avantageux d'assurer une
protection, pour 196valuation
des
options
au
niveau des mesures de protection et
pour
la
Annals o/ Glaciology 13 1989
@ International Glaciological Society
THE AVALANCHE-HAZARD INDEX
byPeter Schaerer
ABSTRACT
(National Research Council of Canada, 3560 Wesbrook Mall, Vancouver, British Columbia V6S 2L2, Canada)
The avalanche-hazard index is a numerical expression of damage and loss as the result of an interaction between snow avalanches and vehicles on a road. The index is determined by multiplying the frequencies of moving and waiting vehicles being hit by various types of avalanches by a weighting which indicates the severity of the conse- quences. The avalanche-hazard index has proved to be a useful decision-making tool for identification of those avalanche paths where control would be most beneficial, for evaluation of options for control measures, and for comparison of the risks for different roads.
INTRODUCTION
Planners, designers, and managers of public and industrial roads in avalanche areas often need to decide whether or not their safety procedure with respect to avalanches is adequate, and to choose an appropriate level of avalanche control. They make their decisions by balancing the risks and the duration of any necessary road closures against the costs of control measures, organizational considerations, production schedules, psychological impact, and environmental damage. Local politics has a significant additional influence where decisions relating to public roads are concerned. Making decisions is assisted when quantitative input information can be provided. The avalanche-hazard index, a numerical expression of the hazard to traffic, is a useful decision-making tool. It allows rational conclusions to be reached about risks to traffic and the potential effectiveness of control options. The index was developed in 1974 for use on highways in the Province of British Columbia, Canada (Avalanche Task Force, 1974). and since then it has been used for other road systems in western Canada, the U.S.A., and New Zealand. This paper presents the method of obtaining the index, some experiences with its application, and, in the Appendix, an example of its application.
By definition, avalanche hazard is the expected frequency of damage and loss as the result of an interaction between an avalanche and objects and persons. The term contains two elements, (a) the frequency of an encounter, which may be defined as the probability of an encounter in a given period of time, and (b) the nature and magnitude of the resulting damage, which in turn is a function of the nature of the avalanche.
NATURE O F THE AVALANCHE
The following idealized classes of avalanche were assessed for their effect on traffic.
Powder snow
Powder snow that crosses a road at a speed of up to 2 0 m s - ' and deposits snow less than 0.1 m deep produces conditions on the road similar to those resulting from blowing snow. Vehicles may be pushed to the side of the road and, because of restricted visibility, drivers may lose
control and collide with a snowbank or with other vehicles. In most cases, the resulting damage tends to be minor.
Slough
This term defines slow avalanches of flowing snow which stop on the road. Characteristically, they either deposit deep snow on one shoulder and cover part of the road or they cross the road and stop at the opposite edge, depositing less than a 0.3 m depth of snow. This type of avalanche often originates from a short steep slope and vehicles tend not to be damaged, because of the small size and low speed of the avalanche, and are normally able to drive either round or through the deposited snow.
Light snow
Flowing avalanches of light snow go beyond the road and deposit depth of snow between 0.3 and 1.0 m. Cars could be pushed off the road by the action of such snow but would not be buried. Avalanches must be classified as of the plunging-snow type if vehicles could be damaged by falling down a steep slope after being hit by the snow.
Deep snow
Flowing avalanches that deposit snow to a depth of more than 1 m on the road are classified as the deep-snow type. Vehicles affected could either be buried or be swept off the road and damaged when falling down a steep slope. The occupants would probably be injured or killed when their vehicle was crushed by, or moved with, the avalanche. Death from burial in the snow is also a possibility.
Plunging snow
Avalanches of dry, flowing snow and/or powder snow which cross roads at high speed after falling over long, steep slopes and cliffs come into this category. They are extremely destructive because of their high speeds. The classification "plunging snow" was introduced by Fitzharris and Owens (1980) for the Milford Road in iu'ew Zealand where this avalanche type is significant.
WEIGHTING THE CONSEQUENCES
The effects of avalanches on traffic were taken into account by attaching a weight, W j , to each class, with j
representing the class. Arbitrary weightings were chosen when the hazard index was first introduced (Avalanche Task Force, 1974) and these were used in subsequent applications. Recently, the weightings have been changed to allow for impact forces and for the costs of losses. The avalanche- impact force, Q, on a vehicle is expressed as
where c is a shape factor, b is the length of the vehicle exposed to snow, a is the average height of the surface under avalanche impact, p is the snow density, and u is the avalanche speed. The product cb was assumed to be a constant for the purposes of comparison of classes of avalanche.
Schaerer: Avalanche-hazard index
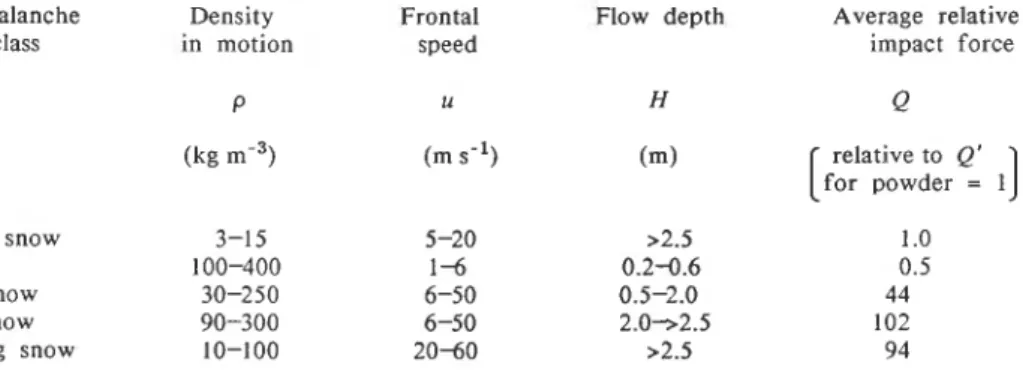
TABLE I. RANGES O F AVALANCHE PROPERTIES AND RELATIVE IMPACT FORCES
Avalanche Density Frontal Flow depth Average relative
class in motion speed impact force
(kg m-3) (m S-I) (m) relative to Q' for powder = 1
I
Powder snow 3-1 5 5-20 >2.5 1 .O Slough 100-400 1 - 6 0.2-0.6 0.5 Light snow 30-250 6-50 0.5-2.0 44 Deep snow 90-300 6-50 2.0-2.5 102 Plunging snow 10-100 20-60 >2.5 94TABLE 11. RELATIVE CONSEQUENCES O F AVALANCHES
Avalanche Relative Relative
class impact force cost
(see Table I) Powder snow 1 Slough 0.5 Light snow 44 Deep snow 102 Plunging snow 94
avalanche-flow depth, H, and (ii) 2.5 m, which is the average vehicle height. Ranges of values for p , u, and H were estimated from data reported in the literature and from personal experience (Table I). The information takes into account measurements on avalanches in motion, conclusions from damage, observations of deposited avalanche snow, and other data has proved adequate for design purposes. Knowledge of limiting and average values allows average impact forces, Q' , relative to those due to powder snow to be determined (Table I).
The degree of loss resulting from an avalanche encounter was determined by estimating a probability factor and attaching a monetary value to loss of life, injury, and vehicle damage. To this cost an additional sum was added for adverse publicity, possible law suits, and a loss of attraction of traffic to the route. Loss of life was valued at $500000, an amount presently set by life-insurance companies and actuarial firms in Canada, and injuries and damage to vehicles were valued at between $2000 and $50000 depending on their nature and severity. The costs of losses relative to those due to powder avalanches, C' , are contained in Table 11. Weightings, W ., were determined
J
by averaging the relative impact forces and cost, dividing by 10, and rounding off to the nearest integer (Table 11).
The consequence of powder snow and slough falls are low relative to the other classes; therefore, such avalanches may be neglected in calculations of the hazard index. The class powder snow refers to the rather slow, small powder avalanches which frequently run during snowstorms, and it should be noted that high-speed powder avalanches must be classified as plunging snow. Most powder avalanches go unnoticed and are not recorded because they run during snowfalls and deposit an insignificant amount of snow on the road. Despite the fact that they are probably numerically quite significant, experience shows that slow powder avalanches contribute less than 4% to the total of hazard indices, mainly because they d o not block roads. Estimates of slough are unreliable because of inconsistent recording methods. Some observers note all slips of snow running into a road-side ditch, whereas others record only snow that has covered the full width of a pavement.
FREQUENCY AND WIDTH O F AVALANCHES
A first step in calculating hazard indices is to make an inventory of the avalanche paths along a road. This includes
Weighting
estimating for each path and separately for light snow, deep snow, and plunging snow the return period of occurrence,
T years, and the average length of road covered, L m. Past observations of avalanches are preferred for making estimates, but studies of tree growth, terrain, and climate must be added because to this data records are frequently incomplete and cover insufficient periods of time.
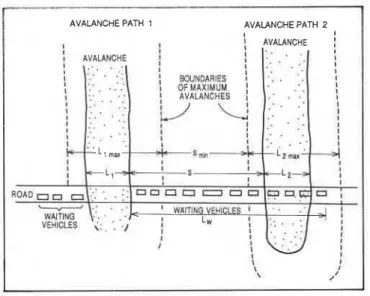
The parameter Lmax is the maximum length of road that could be covered by avalanches for a specific avalanche path (Fig. 1). Values for Lmax can be assigned from the boundaries of the terrain or from the trim line of the forest. Individual avalanches cover the full possible width of the path only in extreme cases. From my own studies, I have found the following estimates adequate when no observations of actual avalanches were available:
L = 0.3 Lmax for light snow; L = 0.7 Lmaxfor deep snow; L = 0.5 Lmax for plunging snow.
ENCOUNTER FREQUENCIES Moving traffic
The encounter frequency, Pm,i,;, is the average number of moving vehicles that could be hit per year by avalanches of class j in a specific avalanche path j . Pm i
.
is the combination of the frequency of occurrence
'd
avalanches, pa and the probability of a vehicle being in the path of a6 'avalanche, pl j., ,
T i is the return period of occurrence of avalanches of class j at avalanche path i , in years; Li,; is the average length of road covered by avalanches of class j at avalanche path i, in m; N is the average daily traffic volume in the months when avalanches could occur (usually December-March); the average daily traffic volume
Schaerer: Avalarlche-hazard index is the number of vehicles per 2 4 h counted in both
directions (vehicles per 24 h); V is the average speed of
traffic on the snow-covered road, in km h-'; D is the
stopping distance for a vehicle with speed V on a snow-covered road in m.
The stopping distance D must be taken into account because a vehicle that is closer to the avalanche than the distance
D, being unable to stop in time, would drive into the
moving avalanche. Values for D, which depend on the
speed and road grade, are tabulated in highway and traffic engineering handbooks. With a conversion of units in
Equations (2), (3), and (4):
Waiting traffic
Vehicles are exposed to avalanches for only between 5 and 15 s when they move across an avalanche path, but for a much longer time when they stop. Avalanche snow blocking the road is the most frequent reason for stopping, so that cars, trucks, and buses waiting in front of an existing snow deposit are then exposed to subsequent avalanches in the same avalanche path and to avalanches on adjacent paths. Because avalanche formation is related to the weather, avalanches often run along several paths within a
period of a few hours. For this reason, avalanche
occurrences at neighbouring sites must not be treated as mutually exclusive events when probabilities are considered.
When an avalanche has blocked the road in avalanche path i, the frequency P w i+l,j of waiting vehicles being hit in the adjacent avalanchk, ?+I, by avalanches of class J with return period Ti+',, is:
where ps is the probability that an avalanche will run along
path i
+
1 while traffic is waiting, and Nw,i+l,j is thenumber of vehicles exposed. Values for ps ranglng between 0.05 and 0.3 have been determined from observations in western Canada, mainly at Rogers Pass. They use for reference the probability that avalanches will run along an adjacent path within 2 h of an initial occurrence. High values of ps are for avalanche paths having similar aspect and terrain characteristics, low values for ps apply to combinations of avalanche paths with different elevation, incline, and starting-zone aspect. Such paths often produce
avalanches simultaneously during heavy snowfalls, even
though their characteristics differ. Experience must guide
the choice of values for ps in applications; ps = 0.15
represent average conditions for our studies, although
Armstrong (1981) concluded that values in the range ps =
0.03-0.05 would be appropriate for Red Mountain Pass in Colorado.
On public roads, one waiting vehicle occupies an average length, Lv, of 15 m of road. For roads with pre- dominant truck traffic, such as industrial roads, L v would be 30 m. The length of a queue of waiting vehicles, Lw, is
NILv
Lw =
-
(7)48
In Equation (7), 1 is the waiting period in hours which is
required for the maintenance crew or the police to respond to an alert, to direct the traffic to safe locations, or to remove the snow that blocks the road. A standard value of
t = 2 h is recommended for calculations and in comparisons
of avalanche-hazard indices. A shorter waiting time can be assumed o n frequently patrolled highways, and where a maintenance base is close to potential avalanche sites.
The number of vehicles, Nw,i+l,, exposed to
avalanches in path i
+
1 is:AVALANCHE PATH I AVALANCHE PATH 2 I 1 1
I
AVALANCHEI
I.. .
- AVAUNCHE 1 ....II
:.
. ..
I
. . .
:.
.
A :. --. BOUNOARIES1
' .. '.
\
L ':-. I OFMAXIMUM'
'. .
' I AVALRNCHES'
,.
. .
I I. .
I..
".
.
I' .
I :'.
' , I 11
: ' : I,
. . . 1 I '. , . .:.:-.
-- I - FC-LI,,+
Smh -L -ri 2
wl--! 1 I I.
...
\ I'\
I d'Fig. 1. Exposure of waiting traffic.
where S is the safe distance between avalanches with paths
i and i
+
J, and Smi, is the distance between the boundarylimits of the respective avalanche paths (Fig. I). Because
avalanches usually do not cover the full width, Lma, of avalanche paths, the average safe distance between paths is assumed to be expressed by
Assuming no pedestrians were present, a second
avalanche along the same path would either run harmlessly over the previous deposit or cover the road in the region of waiting traffic. The frequency with which waiting traffic
is likely to be hit by another avalanche from path i is
assumed to be represented by
In this Equation, ps' is the probability of a second
avalanche running along path i once one avalanche has already occurred. Values for ps' range from 0 to 0.5 and must be chosen from a study of the terrain, history of avalanche occurrence, and experience; for most avalanche
paths with a single starting zone ps' = 0.
Access roads to ski areas and roads with business- related rush-hour traffic often bear heavy traffic volumes in one direction during about 2 h in the morning and in the other direction in the afternoon. This non-uniform time distribution of traffic does not influence the encounter frequency for the individual moving vehicle, although, because of the concentration of traffic, several vehicles could be caught in the same avalanche, making the event more spectacular. Rush-hour traffic would influence the encounter frequency for waiting traffic, because dense traffic would form a longer queue than average traffic and so could stretch across a greater number of avalanche paths. For this reason, encounter frequencies for waiting traffic must be calculated separately for rush hours and for slack periods.
Observed frequencies of encounter
The frequencies, Pm,i,i and Pw were calculated on
the assumption that the r a f f ~ c w d u d move freely, that
drivers would ignore avalanche hazards, and that the traffic flow would resume as soon as avalanche deposits were removed. In reality, traffic is restricted during periods of avalanche occurrences. An avalanche on the road blocks off the traffic to all other avalanche paths beyond and even after the avalanche snow has been removed, the road- maintenance personnel and the police often keep the road closed until they consider conditions are safe. For these reasons, the observed number of encounters of moving and waiting traffic are lower than the predicted frequencies by calculation, and depend a great deal on the relative location of the avalanche paths and the standard of traffic control.
Schaerer: Avalar~che-hazard irzdex
For example, at Rogers Pass, the theoretical frequency of hits by light-snow or deep-snow avalanches is 0.3 vehicles per year once avalanche control by structures and artillery has been taken into account. In 25 years of operation, several vehicles have been hit by powder but not by light or deep snow. At Kootenay Pass, the expected encounter frequency was six vehicles per year between 1965 and 1984, but on average only 1.9 vehicles per year were actually hit during this period. Similarly, for Red Mountain Pass in Colorado, Armstrong (1981) calculated 24 encounters, whereas the observed number averaged over 25 years was 1.6 encounters per year.
DEFINITION O F THE HAZARD INDEX
The avalanche-hazard index, AHI, is the weighted expected frequency of encounters of moving and waiting vehicles with avalanches, summed over a road with n avalanche paths.
i=t~ i=5
The avalanche-hazard index is a number that reflects the seriousness of the avalanche danger to traffic on individual avalanche paths and over a whole section of road.
APPLICATIONS
Avalanche-hazard indices were calculated for roads in Canada, the U.S.A., and New Zealand with the following applications:
(a) The index identifies the avalanche paths that contribute most strongly to the hazard of a road, and consequently shows where avalanche control would be most beneficial. The hazard index defines priorities for building control works.
(b) The index allows the evaluation of the effect of alternative control measures. It can be applied in a cost- effectiveness analysis by calculating the ratio of risk reduction to cost of control. The risk reduction is the difference between the hazard index without control and the hazard index with control.
Estimates must be made of the reduction of the frequency and types of avalanches falling on the road as a result of control measures. .For example, snow sheds (galleries) reduce the number of avalanches on the road by between 90 and 100%, earth structures such as mounds and dikes by between 20 and 80%, and explosives by 90%. Often the control works employed not only reduce the frequency of avalanches but also change their type, from deep snow to light snow, or influence the length of road covered by them.
(c) The hazard index allows comparisons of the avalanche- hazard between roads and of the level of hazard control that was acceptable at other roads; as such, it assists decision making at the political level.
(d) Calculations of the hazard index for future heavier traffic volumes allow orderly planning of control measures. In making comparisons, it should be remembered that the weighting used in earlier applications (Avalanche Task Force, 1974; Fitzharris and Owens, 1980) were different from those of Table 11. The weightings in Table I1 yield hazard indices 0.7-0.9 times the indices calculated with the original weighting.
ADJUSTMENT TO HAZARD Level of control
An avalanche hazard may be mitigated either by restricting the movement of traffic, principally by closing the road during hazardous times, and by controlling the avalanches. The levels of avalanche control employed in Canada at the present time are listed below:
It is standard practice to control the traffic on all public and private roads exposed to avalanches by closing gates at each end of the road during hazardous times. The road- maintenance foreman usually evaluates the snow stability and orders the closures. A trained avalanche technician may be assigned the task when there is more than one road with avalanches in the area, when avalanches also threaten an adjacent ski area, or when avalanches are controlled by explosives.
When the hazard index exceeds a value of 40, the avalanches are usually controlled by either artillery, bombs dropped from a helicopter, or pre-placed explosives. In addition, deflection dikes, mounds, catching dams, and snow
.
sheds (galleries) are built where they can be introduced a t low cost or where avalanche snow on the road would cause unacceptably long traffic delays. Avalanche paths requiring these structures have avalanche-hazard indices between 104
and 80.
The frequency and the duration of road closures influence decisions about avalanche control as much as the hazard
~
index. Often an avalanche control was introduced under pressure from business and politicians when the alternative duration of closures became intolerably long. It seems that road users have a stronger perception of the loss of travel time and business than they have of the probability of an avalanche encounter.Acceptable risk
Elimination of all hazards can be expensive, and often a complete control of avalanches and of traffic movement is not feasible. A minimum avalanche hazard must therefore be tolerated.
In developing the level of acceptance, it would be useful to compare the hazard index with statistics of other natural and Man-made hazards, for example, earthquakes, fires, boating and road accidents, and smoking. Such comparisons are difficult, however, because the avalanche- hazard index is based on theoretical encounter frequencies, and statistics on avalanche accidents on roads are incomplete. There follow a few considerations which assist in defining the level of acceptability of the avalanche- hazard index.
The acceptable risk due to avalanches would be somewhere between the risk accepted from natural disasters and that for traffic accidents. People accept involuntary risks due to natural disasters if they result in one death per million per year (Kletz, 1977). Canadian experience with avalanches on roads suggests a probability of death of 0.25 per encounter with a deep-snow avalanche. This means a frequency of encounters with deep-snow avalanches Pm
+
Pw = 4 x would be tolerable. Using Equation (11) wlth W = 10, the acceptable hazard index for one death per million is 40 x 10.~. For natural-hazard zoning in Norway, Hestnes and Lied (1980) proposed an acceptable level of 3 x deaths per year as the highest acceptablerisk level; this is equivalent to an avalanche-hazard index of 0.12. The tolerable level for traffic accidents has not been defined in the literature, though studies give observed accident risks per person and travel distance. In British Columbia, Canada, the risk on roads is one death per 35 x lo6 km of travel by car (Ministry of Transportation and
Highways, British Columbia, 1984). Studies have shown that the acceptability of risks is a function of the derived benefits in terms of money and personal satisfaction. Voluntary risks have a higher level of acceptance than involuntary risks. This means that, in order to save travel time and inconvenience, road users are prepared to take greater risks that are accepted for natural disasters.
Experience shows that people can accept an avalanche- hazard index of 1. Reducing the hazard below this value would usually require control measures that are economically not justified, or would demand unacceptably long traffic delays. According to Equations (5) and ( I ] ) , a hazard index of 1 would be present on a road with a traffic volume N = 750 vehicles per day, speed V = 80 km h-', stopping distance D = 130m, one light-snow avalanche with L = 30 m and one deep-snow avalanche with L = 80 m per year. With a probability of death of 0.05 in a light-snow avalanche and 0.25 in a deep-snow avalanche, the frequency of fatalities would be 0.024 per year.
Schaerer: Avalanche-hazard index
road. According to statistics, the accident rate from all
causes on this road with traffic volume = 750 vehicles per
day would be 0.15 deaths per year. Rates of fatal accidents on roads and in industry quoted by Kletz (1977) give similar values. With the above assumptions of death rates in avalanche encounters on roads, it may be concluded that an avalanche-hazard index of 1 represents a risk that is 4 - 6 times lower than other risks to traffic.
Example
Rogers Pass, the section of Trans-Canada Highway that crosses the Selkirk Mountains, has the highest avalanche
, hazard of all roads in Canada. The high hazard is the result
of the presence of 65 avalanche paths over a distance of
36km, with numerous paths close together, frequent
avalanche occurrences, and a winter traffic volume of 1700 vehicles per day in 1987. Without control measures,
the avalanche-hazard index would be 1004, but was
mitigated because snow sheds (galleries), retaining barriers in starting zones, earth dikes, and earth mounds reduce the hazard index to 235, and because artillery fire, in addition, reduces the hazard index to 27, although not all avalanche paths can be treated by the artillery. The hazard is reduced to a value of 15 by frequent road patrols that keep the exposure time of waiting vehicles to less than I h, and by regulatory signs aimed at preventing vehicles stopping in avalanche paths. Road closures during the avalanche control by artillery and extension of these, when the hazard is high, cover most of the residual hazard. On average, two uncontrolled light-snow avalanches per year were observed to fall on to the road, producing a hazard index of 0.8.
CONCLUSIONS
The avalanche index is a number that expresses the hazard that avalanches present to traffic. Its calculation is based on estimates of the types of avalanches, their widths on the road, frequencies of occurrence and relation of timing with respect to avalanches in adjacent avalanche
paths. The estimates of the input data of different
investigators may vary, but experience has shown that the results obtained do not vary significantly. Even with different assumptions, the avalanche paths which pose the highest hazards can be identified and the total hazard on a road be compared with that for other roads.
The hazard index allows a rational assessment of the avalanche danger and prevents the making of intuitive decisions about a control. Its most important applications are the identification of the avalanche paths with the greatest contribution to the hazard, and an assessment of the effectiveness of control measures.
A hazard index of 1 appears to be acceptable. Traffic must be controlled during hazardous times when the hazard index exceeds 1, and avalanches be controlled when the index is greater than 40.
In calculating the hazard, each avalanche path (together with its neighbouring paths) was asumed to be independent of other avalanche paths on the road. The same avalanche was assumed to hit moving traffic and waiting traffic each time it occurred after another avalanche had already covered the road. It could be argued that the hazard index could be made more realistic by taking into account that the traffic flow stops after one avalanche occurrence and that each
:
avalanche can strike vehicles only once. Since this wouldnot allow a comparison between individual avalanche paths, a simpler approach was adopted. The methods described can be applied in modified form to hazard assessments on railways, ski, and hiking trails.
I
ACKNOWLEDGEMENTThe author wishes to thank the Avalanche Section of
the British Columbia Ministry of Transportation and
Highways for making available data on avalanche
occurrences and hazard indices. Thanks are due to B. Fitzharris for promoting the application of the method, thus stimulating further studies.
REFERENCES
Armstrong, B.R. 1981. A quantitative analysis of avalanche
hazard on U.S. Highway 550, southwestern Colorado. Proc. West. Snow Conf., 49, 95-104.
Avalanche Task Force. 1974. Report on jindings and
recommendations. Appendix [ I . Victoria, B.C., British
Columbia Department of Highways.
Fitzharris, B.B. and I.F. Owens. 1980. Avalanche atlas of the Milford Road and an assessment of the hazard to traffic. New Zealand Mountain Safety Council. Avalanche Committee. Report 4.
Hestnes, E. and K. Lied. 1980. Natural-hazard maps for
land-use planning in Norway. J. Glacial., 26(94),
331-343.
Kletz, T.A. 1977. What risks should we run? New Sci., 74(105 l), 320-322.
Ministry of Transportation and Highways, British Columbia. 1984. Traffic incident statistics. Victoria, B.C., Ministry of Transportation and Highways.
APPENDIX
The following is an example of the application of the avalanche-hazard index to a section of road with five
avalanche paths (Fig. 2).
Inventory of avalanche paths
The first step is to list the avalanche paths and the types, average sizes, and return periods of avalanches on the road (Tables I11 and IV).
Traffic characteristics
Volume: N = 1100 vehicles/d Speed: V = 80 km/h
Stopping distance: D = 130 m Waiting period: t = 2 h
Average space of vehicles: Lv = 15 m
Length of waiting-traffic queue after 2 h:
Calculated using Equation (7).
Hazard index
Calculate the hazard index using Equations (1) to (9).
The following steps apply in calculating the index
contribution from waiting traffic for each individual path, i:
(a) Identify the avalanche paths, i
+
1, i+
2...,
and i-
1,i - 2,
...,
that are within a distance of 688 m of path i.(b) Determine the hazard contribution AHIi+, of path i
+
1with
L3 and T3 refer to light snow in path i
+
I; L4 and T4refer to deep snow in path i
+
1. Substitute 1/T3, and1/T4 with (1/Ti,3
+
if 1/T3 or I/T4 are greaterthan
(c) Similarly, determine the hazard contribution from all
other paths i
+
2, i - 1, etc., as well as from path i,and add the resulting values (Table V).
Avalanche-control considerations
The avalanche-hazard index of about 20 is in the range where the hazard is usually controlled by road closures during hazardous times. In this specific case, avalanche control is considered because the five avalanche paths do not represent the only avalanche-hazard area on the road.
Avalanche path 4, with the highest hazard index, has a special need of control measures. In addition, it contributes heavily to the hazard of path 3, because traffic that stops on path 3 is exposed to avalanches from path 4.
Schaerer: Avalanche-hazard index
P
AVALANCHE P A W
0 SCALE
doO
The results of a study of the feasibility of avalanche control options are that:
Supporting structures in the starting zones are more expensive than snow sheds, and d o not yield benefits other than those of protecting the traffic. (For this reason supporting structures should not be considered.)
The slopes above the road in avalanche paths 1 - 4 are steep enough to prevent avalanches from running out above the
road, and also to preclude the building of earth
structures.
The run-out zone of avalanche path 5 is on a n alluvial fan, which would permit the construction of deflection
.
dikes.Fig. 2. Map of avalanche paths.
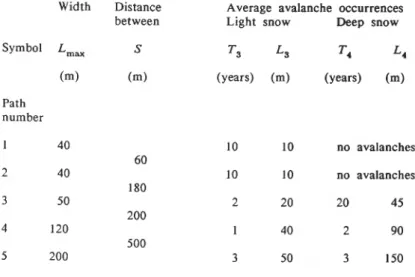
TABLE 111. INVENTORY O F AVALANCHE PATHS AND AVALANCHES
Width Distance Average avalanche occurrences
between Light snow Deep snow
Symbol L,,
Path number
5 200 3
No plunging avalanches are expected.
10 no avalanches
10 no avalanches
20 20 45
40 2 90
50 3 150
TABLE IV. PROBABILITY O F A SECOND AVALANCHE ONCE ONE AVALANCHE HAS OCCURRED (P,)
Path 1 2 3 4 5
TABLE V. HAZARD INDICES
Path Hazard index Total
numbef Moving traffic Waiting traffic