HAL Id: hal-01935677
https://hal.archives-ouvertes.fr/hal-01935677
Submitted on 27 Nov 2018
HAL is a multi-disciplinary open access
archive for the deposit and dissemination of
sci-entific research documents, whether they are
pub-lished or not. The documents may come from
teaching and research institutions in France or
abroad, or from public or private research centers.
L’archive ouverte pluridisciplinaire HAL, est
destinée au dépôt et à la diffusion de documents
scientifiques de niveau recherche, publiés ou non,
émanant des établissements d’enseignement et de
recherche français ou étrangers, des laboratoires
publics ou privés.
Waves
D. Massy, F. Mazen, D. Landru, N. Ben Mohamed, Samuel Tardif, A.
Reinhardt, F. Madeira, O. Kononchuk, François Rieutord
To cite this version:
D. Massy, F. Mazen, D. Landru, N. Ben Mohamed, Samuel Tardif, et al.. Crack Front Interaction
with Self-Emitted Acoustic Waves. Physical Review Letters, American Physical Society, 2018, 121
(19), pp.195501. �10.1103/PhysRevLett.121.195501�. �hal-01935677�
Crack front interaction with self-emitted acoustic waves.
D. Massy1,3, F. Mazen2, D. Landru3, N. Ben Mohamed3, S. Tardif1, A. Reinhardt2, F. Madeira2, O. Kononchuk3, and F. Rieutord1
1
Univ. Grenoble Alpes, INAC-MEM, F-38000 Grenoble, France CEA, INAC-MEM, F-38000 Grenoble, France
2 Univ. Grenoble Alpes, F-38000 Grenoble, France
CEA-LETI, MINATEC Campus, F-38054 Grenoble, France
3
SOITEC, Parc Technologique des Fontaines, 38190 Bernin, France
The interaction of a propagating crack in implanted silicon with self-emitted acoustic waves is studied and reveals the generation of periodic patterns on wafers surfaces after separation. The measurement and identification of the acoustic waves have been experimentally achieved showing the emergence of dominant shear waves acoustic frequencies related to the crack velocity. The surface modifications are made of roughness modulations at large scale due to periodic deviations of the crack front. A physical mechanism explaining the pattern formation is proposed accounting for the observed wavelengths.
Dynamic fracture in brittle materials is a complex but crucial problem to understand the mechanisms of materials failure. The usual way of describing fast crack dynamics is the linear elastic fracture mechanics (LEFM) [1] in which a singular zone is often defined around the crack tip to embrace all the nonlinear dissipation processes (the fracture process zone, FPZ). In this approach, the crack speed v is driven by the balance between the fracture energy Γ needed to create new surfaces and the energy G available at the crack tip. When the latter gets larger, the crack speed asymptotically tends towards the Rayleigh wave speed cR. However, experiments
performed on brittle amorphous materials have shown that this theoretical limiting velocity is never reached because of crack instabilities [2]–[4]. Indeed, branching mechanism appears around v ~ 0.4cR [5] and crack front destabilization due to
nonlinearities at the crack tip arises around v ~ 0.9cR [6]. These two phenomena have finally been
joined within a same description where the transition from a straight crack to microbranching is found to be hysteretic and linked to a finite Mode II perturbation at the crack tip [7].
Another approach to explain the crack speed saturation is based on process region changes during the crack propagation. It has been shown that sufficiently fast cracks involve the nucleation, growth and coalescence of microcraking damages at high-frequency ahead the crack tip. These microcracks arise from toughness fluctuations at the microscopic scale due to material heterogeneities and let post mortem conic marks on the fracture surface [8]–[12]. If the development of these microcracks was at first seen as a source of crack speed saturation [10], [13], more recent studies show that they rather boost the macroscale velocity by coalescing with the main crack front [11], [12].
Finally, in the case of crystalline materials, the terminal crack velocity reaches globally higher values (0.7 – 0.9cR) [14]–[18], essentially because
of the presence of cleavage planes, but path instabilities still occur at low and high driving forces [19]–[21]
At the crack tip, the major part of the crack energy is used to separate atomic bonds, but a fraction is also spent in heat generation [22] and acoustic emission [9], [23], [24]. The amount of energy corresponding to acoustic emission is quite low, around 1 to 5% in PMMA and glass [23], [24]. However, the interaction of elastic waves with a fracture front perturbs the crack dynamics. Indeed, stress waves generated during loading or by an ultrasonic transducer have shown to induce crack path instabilities, branching modifications or speed fluctuations when they run into a crack front [9], [25]–[27]. The Wallner lines, which are circular marks seen on post-fracture surfaces, also arise from the interaction of the fracture front with transverse waves emitted at a material discontinuity (defect, sample boundaries) [28], [29]. More recently, similar feature on post-fracture surfaces have been shown to come from the interaction of the crack front with localized nonlinear waves propagating along the crack tip (crack front waves) [30], [31], even if a controversy arose about the origin of these undulation markings [26], [32], [33]. Some authors have also used piezoelectric transducers to study the sound emitted by a fast running crack [23], [24]. They showed that the signal is first dominated by low frequency components while high frequency components appear at higher velocity. The latest are in fact due to microbranching onset, which is highlighted by the cross-correlation between acoustic emission and surface structure.
These different studies have shown the great importance of acoustic emission when describing crack dynamics, even if the exact impact of self-emitted acoustic waves on the main crack remained quite unclear. In this paper, we show that crack propagation generates elastic waves propagating at high velocity around the crack front in implanted silicon. By using a dedicated set up, a precise characterization of the acoustic emission is made possible and allows one to address the fundamental question of the frequency selection mechanism in the crack acoustic emission. After reflection at the sample boundaries, these waves interact with the crack tip and generate, in our highly reproducible experiments, periodic patterns on the post-fracture surface.
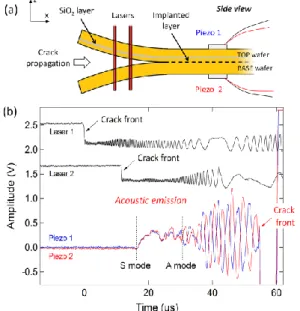
Our experiments have been performed on implanted silicon samples cut out from 300 mm bonded wafers in the [110] direction. Such substrates are commonly used for silicon-on-insulator (SOI) manufacturing using Smart Cut™ technology [34] whose main steps are summarized below. Relatively high doses of light gas ions are implanted in a thermally oxidized monocrystalline silicon substrate which leads to the formation of a buried weakened layer in the crystal. The substrate is then bonded onto a host wafer using direct wafer bonding [35], [36]. Under annealing, the implanted species evolve into microcracks lying parallel to the surface, and a controlled fracture finally propagates along the implanted layer (mainly 2D propagation) [37], [38]. If not thermally, the fracture can be mechanically initiated after a certain degree of maturation by pushing a blade between the two wafers. A thin layer of monocrystalline silicon is therefore transferred onto the host substrate, constituting in the end the SOI wafer (Fig. 1(a)).
FIG. 1: (a) Crack propagation in implanted silicon (b) Laser and piezoelectric signals used to monitor the crack propagation and its acoustic emission in a 300×20×1.55 mm3 bonded silicon strip.
To monitor the crack propagation, a dedicated optical bench based on infrared transmission in silicon has been developed [38]. The crack is mechanically initiated by a blade which is inserted at the beveled edge of the sample. It has been shown that for homogeneous thermal budget and temperature along the sample, the crack speed rapidly saturates [37]. Higher splitting temperatures lead to higher crack speeds because the gas pressure inside the microcavities is increased. Experimentally, fracture initiation at different temperatures is made possible using a specially designed oven in which the sample is placed during the crack propagation measurement. Fig. 1 shows the optical signals (black) recorded for a crack mechanically initiated at 300°C after a first annealing dedicated to microcracks development. The time lag between the two intensity drops on the laser signals allows the determination of the crack velocity which is here 2.4±0.1 km.s-1. The following oscillations correspond to laser interferences due to crack opening and can be used to recover the crack deformation profile [38].
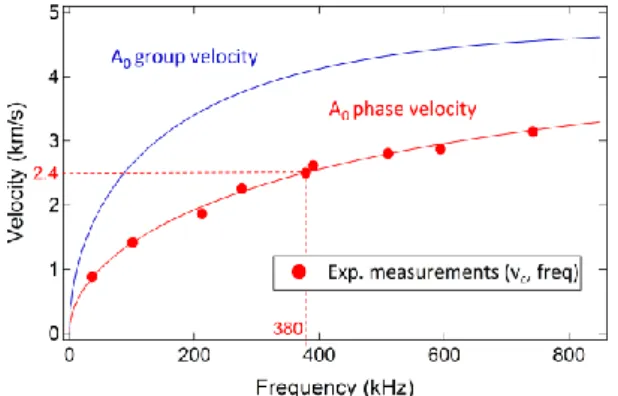
To record the acoustic emission of the propagating crack, two 5×5 mm² piezoelectric sensors [39] were bonded at the middle of the top and the bottom surfaces. The presence of face-to-face sensors allows the differentiation of symmetric and antisymmetric sample deformations. Typical electrical signals are shown in Fig. 1(b). Two fronts are seen, the first one around t =17µs (followed by a simultaneous rise of both signals) and the second one at t = 31µs (followed by a remarkable periodic signal in phase opposition). The piezoelectric signals then fall (t = 53µs) and strongly saturate. This corresponds to the arrival time of the crack at the sensors location, where the divergent movements of the two silicon arms behind the crack front makes the sensor saturate and prevent any further acoustic measurement. The signal before this saturation corresponds therefore to the acoustic emission of the propagating crack. It is first made of a symmetric (S Lamb waves) deformation (signals in phase) that propagates at high velocity, around 7.5 km.s-1. Then, a periodic and antisymmetric deformation (signals in antiphase) appears around t = 31 µs. The frequency of this signal is clearly distinguishable and is equal to 380 kHz. The emergence of this frequency is very interesting because no characteristics length, such as microcracks mean size (10 to 20 µm) or sample thickness (1.55 mm) could explain this periodic signal. In order to investigate the origin of this frequency, the same experiments have been repeated for different crack speeds by changing the fracture temperature. The relationship between the crack velocity and the piezoelectric signal frequency is reported with red circles in Fig. 2. This evolution can be explained as follows. In the case of a semi-infinite solid, a non-dispersive elastic
wave known as the Rayleigh wave can propagate at the sample surface [2]. Its penetration in the solid is quite low, about one or two wavelengths λ. If we now consider a finite solid limited by two plane surfaces at a distance h, two Rayleigh waves are likely to propagate independently at each free surface. However, if the distance h becomes close to λ, the two waves pair up and form symmetric (Sn)
or antisymmetric (An) Lamb waves [41], where n is
the mode number. The dispersion relations of theses waves [42] link the frequency ω with the wave vector k, and therefore with the phase and group velocities. The dispersion curves of the fundamental antisymmetric mode A0 have been
plotted on Fig. 2 and correlates very well with the evolution of the crack speed with the acoustic emission frequency.
FIG. 2: Experimental evolution of the antisymmetric mode frequency with crack velocity (red circles) and A0 Lamb mode dispersion curves
(solid lines).
This good correlation and the emergence of a dominant frequency for each experiment are now discussed. During its propagation, the crack emits a wide range of acoustic waves at different frequencies and therefore with different phase velocities vφ. Among all these waves, the ones
propagating with a phase velocity equal to the crack speed (or its projection if the two wave vectors are not collinear) prevail since their amplitudes build-up constructively at a given point.
This phenomenon is known as the stationary phase principle and was first described in 1887 by Lord Kelvin to explain the formation of ship wakes [43]. Using standard harmonic waves this reads:
a(M, t)= M 'Îfrontexp(i
t '<t
ò
j(M ' M, t-t '))dr ' dt '(1) The expression for the phase and its stationarity depends on the geometry. In our simple 1D case considering direct harmonic plane waves
exp(ij(M ' M, t-t '))dt 'dr ' (t '<t,M 'Îfront ) ò ò =expiwt expikx(1-vj vF ) ( x<d) ò dx
This expression shows that amplitude will be maximum if the integrand over all locations of emitting crack front does not vary i.e. if v=vF.
In our case, the crack velocity takes value between 0 and the Rayleigh velocity, which is
about 4.6 km.s-1 in silicon [44]. Only one A0 Lamb
mode can have a phase velocity in this range of speed, and can hence fulfill the stationary phase condition, and be preferentially excited. However, the energy of these waves does not propagate at the phase velocity, but at the group velocity vg. As one
can see on Fig. 2, the group velocity of the A0 Lamb
mode is higher (typically a factor of 2) than the phase velocity, which explains why acoustic waves are detected ahead the crack front. This point is of great importance because it gives also the opportunity for the acoustic waves to reflect at the sample edges and to come back to interact with the crack front. This interaction leads to roughness surface modifications as it is now presented.
Experimentally, the post-fracture surfaces of the silicon samples exhibit a periodic pattern which can be seen on haze maps as shown on Fig. 3. In the case of strip samples, the pattern is made of fringes parallel to the strip end and located at the opposite side of the initiation. For information, the haze mapping is an optical measurement based on laser beam diffuse light scattering which is extremely sensitive to all kind of small variations at the wafer surface.
To investigate the nature of this pattern, optical interferometer measurements have been performed at the bright (BF) and dark (DF) fringes locations. Two examples are shown on Fig. 3 where one can see the post-split microcracks footprints with typical size around 10 µm. RMS roughness value of 10.7 ± 0.3Å has been found for DF and 12.4 ± 0.6Å for BF. If these roughness absolute values do not have to be considered, high frequency being suppressed at this scale, their relative values indicate that the microcracks footprints are more pronounced at the dark fringes of the pattern than at the bright fringes.
FIG. 3: Haze map of the periodic pattern observed on a post-fracture surface (top) and optical interferometer measurements on the base wafer at the bright and dark fringes of the pattern (bottom).
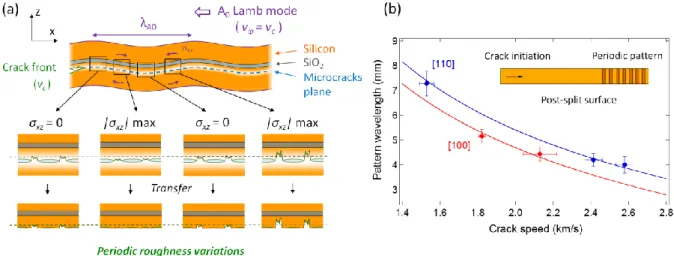
This periodic modulation of the surface roughness is in fact the result of the interaction between the crack front and self emitted acoustic waves, which have been previously reflected at the sample boundary. Indeed, the gas implantation into the silicon crystal creates platelets which evolve after
annealing into microcavities [37]. During the layer transfer, the crack front tends to progress through these open areas to minimize energy dissipation. At the same time, the crack front emits ahead an antisymmetric A0 Lamb mode which generates local
shear stresses into the wafer. In our strip samples, the acoustic waves propagate along the same axis than the crack front, which means that the A0 Lamb
mode excited in our conditions has a phase velocity equals to the crack speed (Fig. 2). Since the group velocity of the A0 Lamb mode is higher than the
phase velocity, the acoustic deformation propagates ahead the crack front, reflects at the sample edge and comes back to interact with the crack. Then, depending on the local stress field induced by the A0 Lamb mode at the time of the interaction, the
FIG. 4: (a) Interaction between the crack front and the reflected acoustic wave. The A0 Lamb mode generates
bending that leads to crack path deviations between the microcavities and to periodic roughness variations on the post-split surface. (b) Experimental and theoretical evolution of the pattern wavelength with crack speed. crack tip is more or less deviated between the
microcavities, leading in the end to roughness variations at large scale as it is outlined on Fig. 4(a). It is worth noting that the crack front deviation always occurs on the buried oxide side since this region has been damaged by the hydrogen implantation. The bending movement imposed by the A0 mode (σxz component) enhances or reduces
these path deviations.
The pattern wavelength seen on the silicon post-fracture surfaces can now be linked to the acoustic emission frequency using the same stationary phase argument, considering the time at which crack reaches observation point M(d,t). In Eq. (1), taking into account waves reflected at the edge (x=L) of the wafers,
expi
j
(M'M,t
-
t')dt'dr'
(t'<t,M 'Îfront)òò
=
expik2(L
-
d)
expik(d
-
x)(1
-
v
jv
F)
(x<d)ò
dx
.It means that the pattern wavelength is simply equal to the half of the A0 mode wavelength. To
check this, similar experiments have been performed with silicon strips in the [110] or the [100] direction. The periodic roughness pattern was measured by ellipsometry on the post-split surface. The evolution of the pattern wavelength with the crack speed is compared to the evolution of the half wavelength of the corresponding A0 mode (Fig.
4(b)). The agreement between these data validates therefore the mechanism proposed above.
The same mechanisms are at play for full wafer assemblies. In addition to these patterns visible on
the edge opposed to the initiation point due to reflected waves, longer wavelength patterns are also visible far from the wafer edges. These patterns can be faithfully reproduced summing at any point M the contributions of A0 Lamb waves emitted by the
crack front at past positions before they arrive at M. In conclusion, we showed that the acoustic emission of a propagating crack has a significant impact on its propagation path. The acoustic waves are selected by the crack speed (vφ = vF ) and the
sample geometry (Lamb waves for plates) via phase stationarity arguments. In the case of a crack running parallel to the surface of silicon slab, the flexural waves (antisymmetric A0 Lamb mode) are
excited preferentially and generate bending and shear stress in the sample. Since its group velocity is higher than its phase velocity, the A0 mode
propagates ahead the crack front, reflects at the samples edges and come back to interact with the crack tip. The shear stress field of these waves leads to crack path deviations at large scale and generates periodic patterns made of roughness modulations on the post-fracture surface. The accurate agreement between the experimental pattern wavelengths and the associated crack velocities in the case of strip samples comforts this mechanism. Numerical simulations aimed to reproduce the wave pattern in the case of standard circular silicon wafers are currently in progress. We would like to acknowledge support from the French authorities through the "Investissement
d'Avenir" EXACT program.
References:
[1] L. B. Freund, Dynamic Fracture Mechanics. Cambridge: Cambridge University Press, 1990. [2] K. Ravi-Chandar, Dynamic Fracture, Elsevier.
Oxford, 2004.
[3] J. Fineberg, S. P. Gross, M. Marder, et H. L. Swinney, « Instability in dynamic fracture », Phys.
Rev. Lett., vol. 67, no 4, p. 457‑460, juill. 1991. [4] A. Livne, O. Ben-David, et J. Fineberg,
« Oscillations in Rapid Fracture », Phys. Rev. Lett., vol. 98, no 12, p. 124301, mars 2007.
[5] E. Sharon, S. P. Gross, et J. Fineberg, « Local Crack Branching as a Mechanism for Instability in Dynamic Fracture », Phys. Rev. Lett., vol. 74, no 25, p. 5096‑5099, juin 1995.
[6] T. Goldman, R. Harpaz, E. Bouchbinder, et J. Fineberg, « Intrinsic Nonlinear Scale Governs Oscillations in Rapid Fracture », Phys. Rev. Lett., vol. 108, no 10, p. 104303, mars 2012.
[7] T. G. Boué, G. Cohen, et J. Fineberg, « Origin of the microbranching instability in rapid cracks »,
Phys. Rev. Lett., vol. 114, no 5, p. 054301, févr. 2015.
[8] F. Kerkhof, « Wave fractographic investigations of brittle fracture dynamics », in Dynamic crack
propagation, Noordhoff International Publishing.,
Leyden: G.C. Sih, 1973, p. 3‑35. [9] K. Ravi-Chandar et W. G. Knauss, « An
experimental investigation into dynamic fracture: IV. On the interaction of stress waves with propagating cracks », Int. J. Fract., vol. 26, no 3, p. 189‑200, nov. 1984.
[10] K. Ravi-Chandar et B. Yang, « On the role of microcracks in the dynamic fracture of brittle materials », J. Mech. Phys. Solids, vol. 45, no 4, p. 535‑563, avr. 1997.
[11] C. Guerra, J. Scheibert, D. Bonamy, et D. Dalmas, « Understanding fast macroscale fracture from microcrack post mortem patterns », Proc. Natl.
Acad. Sci., vol. 109, no 2, p. 390‑394, janv. 2012. [12] J. Scheibert, C. Guerra, F. Célarié, D. Dalmas, et D.
Bonamy, « Brittle-Quasibrittle Transition in Dynamic Fracture: An Energetic Signature », Phys.
Rev. Lett., vol. 104, no 4, p. 045501, janv. 2010.
[13] P. D. Washabaugh, « A reconciliation of dynamic crack velocity and Rayleigh-wave speed in isotropic brittle solids », Int. J. Fract., vol. 65, p. 97‑114, 1994.
[14] J. J. Gilman, « Propagation of Cleavage Cracks in Crystals », J. Appl. Phys., vol. 27, no 11, p. 1262‑1269, nov. 1956.
[15] D. Hull et P. Beardmore, « Velocity of propagation of cleavage cracks in Tungsten », Int. J. Fract.
Mech., vol. 2, no 2, p. 468‑487, juin 1966.
[16] J. H. Greenwood, « The maximum fracture velocity of silicon », J. Mater. Sci., vol. 6, no 5, p. 390‑394, mai 1971.
[17] T. Cramer, A. Wanner, et P. Gumbsch, « Crack Velocities during Dynamic Fracture of Glass and Single Crystalline Silicon », Phys. Status Solidi A, vol. 164, no 1, p. R5‑R6, nov. 1997.
[18] J. A. Hauch, D. Holland, M. P. Marder, et H. L.
Swinney, « Dynamic Fracture in Single Crystal Silicon », Phys. Rev. Lett., vol. 82, no 19, p. 3823‑3826, mai 1999.
[19] T. Cramer, A. Wanner, and P.Gumbsch, « Energy dissipation and path instabilities in dynamic fracture of silicon single crystals », Phys. Rev. Lett., vol. 85, no 4, p. 788‑791, juill. 2000.
[20] J. R. Kermode, T. Albaret, D. Sherman, N. Bernstein, P. Gumbsch, M. C. Payne, G. Csányi, et A. De Vita, « Low-speed fracture instabilities in a brittle crystal », Nature, vol. 455, no 7217, p. 1224‑1227, oct. 2008.
[21] D. Sherman, M. Markovitz, et O. Barkai,
« Dynamic instabilities in {1 1 1} silicon », J. Mech.
Phys. Solids, vol. 56, no 2, p. 376‑387, févr. 2008. [22] W. Döll, « Kinetics of crack tip craze zone before
and during fracture », Polym. Eng. Sci., vol. 24, no 10, p. 798‑808, juill. 1984.
[23] S. P. Gross, J. Fineberg, M. Marder, W. D. McCormick, et H. L. Swinney, « Acoustic
emissions from rapidly moving cracks », Phys. Rev.
Lett., vol. 71, no 19, p. 3162‑3165, nov. 1993. [24] J. F. Boudet, S. Ciliberto, et V. Steinberg,
« Experimental Study of the Instability of Crack Propagation in Brittle Materials », EPL Europhys.
Lett., vol. 30, no 6, p. 337, 1995.
[25] J. Fineberg, S. P. Gross, M. Marder, et H. L. Swinney, « Instability in the propagation of fast cracks », Phys. Rev. B, vol. 45, no 10, p. 5146‑5154, mars 1992.
[26] D. Bonamy et K. Ravi-Chandar, « Interaction of Shear Waves and Propagating Cracks », Phys. Rev.
Lett., vol. 91, no 23, p. 235502, déc. 2003. [27] J. F. Boudet et S. Ciliberto, « Interaction of Sound
with Fast Crack Propagation », Phys. Rev. Lett., vol. 80, no 2, p. 341‑344, janv. 1998.
[28] H. Wallner, « Linienstrukturen an Bruchflächen »,
Z. Für Phys., vol. 114, no 5‑6, p. 368‑378, mai 1939.
[29] D. Hull, Fractography: Observing, Measuring and
Interpreting Fracture Surface Topography.
Cambridge University Press, 1999.
[30] E. Sharon, G. Cohen, et J. Fineberg, « Propagating solitary waves along a rapidly moving crack front »,
Nature, vol. 410, no 6824, p. 68‑71, mars 2001. [31] E. Bouchaud, J. P. Bouchaud, D. S. Fisher, S.
Ramanathan, et J. R. Rice, « Can crack front waves explain the roughness of cracks? », J. Mech. Phys.
Solids, vol. 50, no 8, p. 1703–1725, 2002. [32] G. C. E Sharon, « Comment on “Interaction of
Shear Waves and Propagating Cracks” », Phys. Rev.
Lett., vol. 93, no 9, p. 099601; author reply 099602, 2004.
[33] D. Bonamy et K. Ravi-Chandar, « Bonamy and Ravi-Chandar Reply »:, Phys. Rev. Lett., vol. 93, no 9, p. 099602, août 2004.
[34] M. Bruel, « Silicon on insulator material
technology », Electron. Lett., vol. 31, no 14, p. 1201, 1995.
[35] H. Moriceau, F. Rieutord, F. Fournel, Y. L. Tiec, L. D. Cioccio, C. Morales, A. M. Charvet, et C. Deguet, « Overview of recent direct wafer bonding advances and applications », Adv. Nat. Sci. Nanosci.
Nanotechnol., vol. 1, no 4, p. 043004, 2010. [36] F. Rieutord, B. Bataillou, et H. Moriceau,
vol. 94, no 23, p. 236101, juin 2005.
[37] J.-D. Penot, D. Massy, F. Rieutord, F. Mazen, S. Reboh, F. Madeira, L. Capello, D. Landru, et O. Kononchuk, « Development of microcracks in hydrogen-implanted silicon substrates », J. Appl.
Phys., vol. 114, no 12, p. 123513, sept. 2013. [38] D. Massy, F. Mazen, S. Tardif, J. D. Penot, J.
Ragani, F. Madeira, D. Landru, O. Kononchuk, et F. Rieutord, « Fracture dynamics in implanted silicon », Appl. Phys. Lett., vol. 107, no 9, p. 092102, août 2015.
[39] A. N. Z. Victor Giurgiutiu, « Characterization of Piezoelectric Wafer Active Sensors », J. Intell.
Mater. Syst. Struct. - J INTEL MAT SYST STRUCT,
vol. 11, no 12, 2000.
[40] A. N. Stroh, « A theory of the fracture of metals »,
Adv. Phvsics, vol. 6, p. 418‑ 465, 1957.
[41] H. Lamb, « On Waves in an Elastic Plate », Proc. R.
Soc. Lond. Math. Phys. Eng. Sci., vol. 93, no 648, p.
114‑128, mars 1917.
[42] K. F. Graff, Wave motion in elastic solids, Dover, New York. 1991.
[43] R.S. Johnson, A Modern Introduction to the
Mathematical Theory of Water Waves, Cambridge
University Press, Cambridge (1997). [44] D. Sherman, « Macroscopic and microscopic
examination of the relationship between crack velocity and path and Rayleigh surface wave speed in single crystal silicon », J. Mech. Phys. Solids, vol. 53, no 12, p. 2742‑2757, déc. 2005.