HAL Id: hal-02268606
https://hal.archives-ouvertes.fr/hal-02268606
Submitted on 21 Aug 2019
HAL is a multi-disciplinary open access
archive for the deposit and dissemination of
sci-entific research documents, whether they are
pub-lished or not. The documents may come from
teaching and research institutions in France or
abroad, or from public or private research centers.
L’archive ouverte pluridisciplinaire HAL, est
destinée au dépôt et à la diffusion de documents
scientifiques de niveau recherche, publiés ou non,
émanant des établissements d’enseignement et de
recherche français ou étrangers, des laboratoires
publics ou privés.
Synchrotron Radiation Micro-CT Imaging of Bone
Tissue
Zsolt-Andrei Peter, Françoise Peyrin
To cite this version:
Zsolt-Andrei Peter, Françoise Peyrin. Synchrotron Radiation Micro-CT Imaging of Bone Tissue.
Theory and Applications of CT Imaging and Analysis, InTech, 2011, 978-953-307-234-0. �hal-02268606�
14
Synchrotron Radiation Micro-CT
Imaging of Bone Tissue
Zsolt-Andrei Peter
1and Françoise Peyrin
2,31
Université Paris Ouest Nanterre La Défense, IUT de Ville d'Avray, Département GTE
2Creatis, CNRS UMR 5220; INSERM U630; Université de Lyon; INSA Lyon
3European Synchrotron Radiation Facility
France
1. Introduction
The evaluation of bone fragility remains an open question that is all the more important given that the prevalence of osteoporosis is increasing in industrial countries with the ageing of the population and its greater sedentarity. This disease, which affects one in three menopausal women, is responsible of fractures and vertebral compression that can lead to invalidity. Osteoporosis is a “silent disease”: 40% of women and 13% of men after 50 years old are concerned with and 24% of aged patients die one year after a hip fracture. Thus this disease represents a major cost for public health.
The diagnosis of bone fragility and the associated therapeutic decision are currently based on the measurement of bone mineral density (BMD) using dual X-ray absorptiometry (DXA) techniques. However, although BMD is an important determinant of bone fragility, it doesn’t provide a sufficient prediction of fracture risk (estimated between 60% and 70%) and it appears necessary to develop new methods for bone strength evaluation.
Bone quality changes that occur during aging and osteoporosis are receiving increasing interest. Among bone quality factors, the role of bone micro-architecture which refers essentially to the organization of the trabecular network has been widely demonstrated. The quantification of bone micro-architecture should make possible to improve the prediction of bone mechanical resistance. Although bone architecture was conventionally evaluated by histomorphometry, new non-destructive techniques derived from medical imaging are increasingly used for the assessment of bone tissue.
In this chapter, we shall concentrate on ray imaging techniques, and in particular on 3D X-ray microtomography (micro-CT) which is progressively supplanting standard histomorphometry for the analysis of bone micro-architecture. This technique is non destructive, avoids sample preparation and provides three-dimensional images with a high and isotropic spatial resolution in the three spatial directions.
Using synchrotron radiation (SR) coupled to micro-CT instead of standard X-ray beams possesses additional advantages in terms of image quality and signal to noise ratio. Thanks to the properties of synchrotron radiation, this modality enables to study simultaneously bone microstructure and bone mineralization.
As clinicians expect more than images, objective measures of bone architecture and quantification techniques based on these images have been developed. The availability of
3D micro-CT images makes it possible to measure model independent parameters of bone micro-architecture, and thus to obtain reliable information on the geometry and topology of the bone structures as well as its connectivity, orientation, and anisotropy.
In the following we shall first present basic notions in bony biology. Then we shall briefly describe the evolution of bone imaging by means of X-ray based techniques, and detail the powerful synchrotron radiation micro-CT tool for imaging bone tissue. We shall then present image processing techniques to extract quantitative measurement from micro-CT images. After addressing the segmentation of bone from background and the separation of trabecular from cortical bone, we shall review specific methods to analyze trabecular and cortical bone. On the one hand, methods allowing the morphometric and topologic quantification of the trabecular network will be presented. On the other hand, new methods allowing the quantification of cortical bone from SR micro-CT images will be described. Then, examples of applications of SR micro-CT in bone research will be reviewed. We shall then conclude by some perspectives opened by this modality for the investigation of bone tissue.
2. Bone tissue
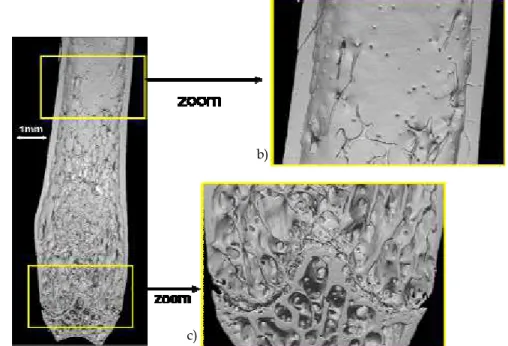
Bone achieves several functions in the organism; it has a multiscale structure exhibiting different levels of organization. At the microstructural scale, it is possible to distinguish cortical and cancellous (trabecular) bone being, respectively, a dense external shell and a porous inner material made of thin trabeculae (hundred of micrometers). Figure 1 a) illustrates a 3D SR micro-CT image of a mice tibia bone obtained by our group at the ESRF (voxel size : 5µm) with a zoom on the cortical (b) and trabecular (c) structures.
The trabecular or spongy bone constitutes 70% of the axial (or central) skeleton in humans, and can be seen as a honeycomb of vertical and horizontal bars called trabeculae. It is within this region that human red marrow is almost exclusively located.
The cortical or compact bone constitutes 80% of the total human skeleton, located primarily in the peripheral skeleton. It plays a major role in bone strength and bone fragility depends on its micro-structure. Human cortical bone is mainly organized in osteons and includes a complex network of canals: the mainly longitudinally oriented Havers canals and perpendicular to it, the Volkmann canals.
A fundamental process in bone biology is remodeling which replaces old bones with new one and allows bone to adapt its properties to mechanical constraints. All along our life, bone is constantly remodeled, which means that it is sequentially resorbed and reconstructed. The surface-to-volume ratio is much higher in trabecular than cortical bone and accordingly bone remodeling has a greater effect on trabecular bone because it has an annual turnover rate of about 25% in trabecular and 2-3% in cortical bone. After bone reconstruction, its mineral concentration in localized regions increases progressively. Thus bone tissue can be seen as an arrangement of bone modeling units (BMU) with different degrees of mineralization.
At the cellular scale, bone tissue includes micrometric or submicrometric porosities such as micro-cracks, osteocyte lacunae, and canalicules. The composition of bone tissue itself is a mixture of collagen, water and mineral (hydroxyapatite (HA) crystals). The collagen and mineral phases are complementary in the sense that they respectively provide toughness and stiffness.
If the general organization of bone microstructure is well described in an anatomy handbook, its particular organization for a given bone may vary with aging, disease, or therapy. The main particularity of bone as a material is to be able to adapt itself to mechanical constraints. This adaptation is the consequence of complex biological processes which are not fully elucidated but which result in modifications at all levels, from the arrangement of mineralized particles to that of its micro and macro structure.
Fig. 1. a) SR micro-CT image of a mice bone; b) zoom on the cortical envelope; c) zoom on the trabecular part of the bone
Among the different means of investigating bone, imaging techniques may provide various types of information at different scales. While spatial resolutions between 5–10 μm are appropriate to study bone microstructure, a submicrometric resolution is necessary to examine the ultra-structural level and a nanometric resolution is required to get information about the crystalline structure.
3. X-ray based imaging techniques of bone
X-ray radiography is the oldest and simplest medical imaging technique. Although it does not directly produce a three-dimensional image of bone structure, different groups have suggested coupling it with texture analysis techniques to assess bone architecture (Cortet, B. et al., 1995). Research in this area involves the optimization of radiographic imaging together with texture analysis. When using flat panel detectors, the choice of spatial resolution has been shown to be a key issue. Texture analysis consists in extracting characteristic parameters of the arrangement of more or less regular patterns that constitute the bone image. Fractal approaches have been particularly exploited (Benhamou, C.L. et al.,
b)
2001), but other statistical or structural approaches are also appropriate (Apostol, L. et al., 2006). Nevertheless these techniques have inherent limitations since they only allow studying 2D projections of the 3D bone microstructure.
X-ray Computerized Tomography (CT) avoids the overlay problem encountered in radiography by providing slices within the structure. Since its discovery, the technology of X-ray CT has considerably evolved and recent spiral scanners are well suited to the acquisition of fast serial sections. CT and particularly Quantitative CT (QCT) are increasingly used to measure BMD since it measures a volumetric density instead of an areal density as in standard DXA (Engelke, K. et al., 2009). CT has also been proposed to quantify in vivo trabecular texture to evaluate osteoporosis (Chevalier, F. et al., 1992), (Laval-Jeantet, A.M. et al., 1993), (Mundinger, A. et al., 1993). The typical spatial resolutions vary between 300 µm and 500 µm in the cutting plane for a slice thickness which is generally between 1 mm and 2 mm. The partial volume effect in these images is important given the size of the trabeculae (estimated at a few hundred micrometers) compared to the spatial resolution. It is manifested by the disappearance of the finest trabeculae or the grouping of the closest trabeculae, and can only provide indicators (Bousson, V. et al., 2000), (Bousson, V. et al., 2001). New peripheral CT systems such as the Xtreme C (from Scanco) can now provide 3D images of the bone micro-architecture at the human extremities (tibia or radius) at very high spatial resolution (~100 µm).
Even higher spatial resolution can be achieved in vitro with 3D microtomography (micro-CT) for the three-dimensional analysis of bone microarchitecture. A pioneer work in this area was that of Feldkamp (Feldkamp, L.A. et al., 1989) who was the first to develop a cone-beam micro-CT to acquire three-dimensional images of the bone with an isotropic spatial resolution of 70 µm. That technique possesses several advantages over histomorphometry: first, it is non-destructive, thus it does not compromise the sample for other testing methods (for instance biomechanical testing) and then it provides a 3D characterization able to render the complex organization of the bone tissue. This technique has received a considerable success and many commercial cone-beam micro-CT systems are now available for the analysis of bone samples (Cooper, D.M. et al., 2006).
Micro-CT can be improved by using X-ray beams extracted from synchrotron radiation. In fact, synchrotron sources permit to use a monochromatic X-ray beam while maintaining a high flux. Thus Synchrotron Radiation (SR) micro-CT provides three-dimensional images of bone structure at high or very high resolution of a few micrometers in relatively short exposure times. The feasibility of three-dimensional synchrotron microtomography to image bone samples was first demonstrated by Engelke (Engelke, K. et al., 1989). Bonse (Bonse, U. et al., 1994) presented three-dimensional images of iliac crest biopsies with a cubic voxel size of 8 µm. Kinney showed the possibility of acquiring in vivo three-dimensional synchrotron microtomography on rats at 9 μm (Kinney, J.H. et al., 1995). A three-dimensional synchrotron microtomography was developed at the European Synchrotron Radiation Facility (ESRF) in Grenoble (France), to study bone architecture (Salome, M. et al., 1999), and will be described in the following section.
4. Synchrotron Radiation (SR) micro-CT imaging technique
In this section we will briefly present the physical properties of the synchrotron radiation sources and the major advantages of coupling it to micro-CT. In particular, we will describe the SR micro-CT setup available at the ESRF, on beamline ID19, which is very well adapted to image bone tissue.
4.1 Synchrotron radiation sources
Electromagnetic waves are emitted when a charged particle is submitted to acceleration. In a circular accelerator such as a synchrotron or a storage ring, electrons are deviated by magnetic fields. This deviation is due to the radial force which attracts the electrons towards the center or the ring, and we call “synchrotron radiation” the light emitted by these electrons. Its wide spectrum reaches the X-ray range, it has a very high intensity and a continuous spectrum, spanning the whole range from infra-red (wavelength between 2.5 to 25μm) to X-rays (wavelength between 0.1 to 3Å), which is reached only when the energy of the electrons is high enough (of the order of several billion electronvolts - GeV). This wide range of wavelengths will allow studying different properties of materials at different scales and tiny features, e.g. bonds in molecules, nanoscale objects etc., but also lets to follow for example chemical reactions on a very short time scale.
The storage ring in a synchrotron facility includes different types of magnets and insertion devices connected to the beamline. Beamlines are located all around the storage ring and are optimized for a given technique.
The most important advantage of synchrotron radiation over a laboratory X-ray source is its brilliance. A synchrotron source like the ESRF (Figure 2 a)) has a brilliance that is more than a billion times higher than a laboratory source. It belongs to third generation sources, like APS (Chicago, USA) and Spring’8 (Himeji, Japan). The Sincrotrone Trieste (Trieste, Italy), SLS (Zürich, Switzerland), ALS (Berkeley, USA), SOLEIL (Orsay, France) also belong to third generation sources but have a lower critical energy.
4.2 SR micro-CT setup
The use of synchrotron X-rays compared to laboratory X-ray sources has several advantages in micro-CT. A first major property is the very high intensity of the X-ray beam, which allows improving the signal to noise ratio (SNR) in the images while reducing acquisition times. In 3D CT, the necessary number of photons is proportional to the fourth power of the voxel size to keep the same noise level, and then the high photon flux permits measurements at high spatial resolution. A second major property offered by synchrotron sources is the possibility to perform tomography with a monochromatic X-ray beam for a selected energy. Monochromaticity is a basic assumption in the theory of tomographic reconstruction which avoids beam hardening artifacts that can occur with a polychromatic standard X-ray tube. On a SR micro-CT setiup, the energy of the X-ray beam is tunable, and can be optimized for a given sample or a series of samples. Finally, unlike in most commercialized system using cone-beam sources, it is possible to implement parallel beam acquisition. This mode of acquisition has the advantage to allow exact tomographic reconstruction and thus to avoid typical cone-beam artefacts with conventional systems. In three-dimensional (3D) SR micro-CT, hundreds of two-dimensional (2D) projection radiographs of the specimen are taken at several different angles. The accuracy of the CT image is dependent on the number of parallel beam projections and the number of data points in each projection. Each radiograph is a projection of the linear absorption distribution in the sample along the direction of X-ray beam onto the plane perpendicular to the direction of the X-ray beam propagation. Thus, SR micro-CT images represent maps of the linear absorption coefficient within the sample for a given energy.
An important limitation in high resolution micro-CT, which is inherent to the principle of CT, is the limited size of the sample. An important issue is the choice of spatial resolution versus overall sample size. Indeed, since the number of pixels of the detector is fixed, the
higher the spatial resolution, the smaller the field of view. Moreover, during data acquisition, the sample must completely fit into the field of view to avoid local tomography, compromising quantitative reconstruction.
During data acquisition, a number of parameters have to be selected: energy of the X-ray beam, exposure time per projection, number of projection, number of frames. Ideally, the energy should be chosen such that the specimens absorb 85-90% of the incident radiation to obtain the best signal to noise ratio in the reconstructed image. In a homogeneous sample, absorbing 90% of the incident radiation means that the product between the sample thickness and the linear attenuation coefficient associated to the X-ray wavelength corresponds to 2.3. The exposure time and the number of projection will directly impact the signal to noise ratio in the reconstructed image.
Throughout the acquisition, the sample is sequentially rotated over a total angular range of 180˚. Typically, several hundreds equiangular radiographic images of the sample are acquired (corresponding to approximately 8-16 GBytes of data per sample with a 2048x2048 detector). In addition, dark current and reference images are recorded with the same exposure time at different moments of each scan, to perform flat field corrections. This set of 2D images is then processed through a tomographic reconstruction algorithm to get the three-dimensional image of the sample. Tomographic image reconstruction consists in solving an inverse problem to estimate an image from its line integrals on different directions, in 2D, and the problem is theoretically equivalent to the inversion of the Radon transform of the image. In practice, there are two major classes of reconstruction algorithms that use fundamentally different approaches to accomplish this conversion: the first are the transform-based methods using analytic inversion formulae, and the other are series expansion methods based on linear algebra. The conventional method used in practice is the Filtered backprojection algorithm (FBP) which belongs to the first class of methods.
An SR micro-CT setup has been implemented on beamline ID19, one of the two long beamlines (145 m) of the ESRF (Salome, M. et al., 1999). The experimental scheme and a photo of this particular micro-CT setup are represented on Figure 2 b) and c).
Fig. 2. a) the ESRF in Grenoble; b) and c) the SR micro-CT setup at the ID19 beamline (ESRF) b)
a)
A wide SR parallel beam (up to 40mm×14 mm) with an energy ranging from 10 to 80 keV is available. A double crystal monochromator sets to diffract in the symmetrical Bragg reflection geometry, selects the appropriate energy from the white SR beam emerging from the storage ring. The sample is mounted on a goniometer including high resolution translations and rotations to position the sample and to rotate it in the beam. A two-dimensional detector records the beam transmitted through the sample. The distance between the sample and detector must be as small as possible to avoid phase contrast effects due to the coherence of the beam (Cloetens, P. et al., 1997). The two-dimensional detector is based on a two-dimensional charge coupled device (CCD) Fast REadout LOw Noise (FRELON) camera developed by the ESRF detector group (2048 × 2048 CCD chip, 14 bit dynamic range) (Labiche, J.-C. et al., 2007). This camera records the light image converted from a scintillator screen, after optical magnification. The optical system is modular and can be used with different objectives to adapt the field of view and the spatial resolution to the sample under investigation. Typically, pixel sizes of 10.13 µm, 6.65 μm, down to 0.28 μm may be used (Weitkamp, T. et al., 2010).
4.3 Comparison between micro-CT and SR micro-CT in bone research
As already mentioned, SR CT presents a number of advantages over standard micro-CT because it allows quantitative imaging with high SNR in smaller acquisition times. SR micro-CT is thus often used as a reference technique to evaluate emerging imaging modalities.
SR and standard micro-CT have previously been compared to assess trabecular bone microarchitecture in a large subset of human bone specimens (Chappard, C. et al., 2006). In that work SR micro-CT images with a voxel size of 10.13 µm were reconstructed from 900 2D radiographic projections (with angular step of 0.2°), while standard micro-CT images with a voxel size of 10.77 µm were reconstructed from 205, 413 and 825 projections obtained using angular steps of 0.9°, 0.45° and 0.23°, respectively. The results show that streak-like artifacts occurred with standard micro-CT as a result of reconstruction artifacts, geometrical blurring, and beam hardening. These streak-like artifacts appear on histograms as an intermediate grey level between bone and background and therefore tend to reduce image contrast. Although systematic differences were noted between SR micro-CT and standard micro-CT images, correlations between the techniques were high and the differences would generally not change the discrimination between the studied groups. In conclusion, standard micro-CT was shown to provide a reliable 3D assessment of human bone when working with 0.23° or 0.45° rotation step, but not with 0.9° rotation step, thus highlighting the importance of acquisition conditions in practical study.
Another fundamental property of SR micro-CT in bone studies is the possibility to observe differences in mineralization within the bone phase and therefore to access another factor of bone quality. The differences observed in gray levels are related to various stages of mineralization associated with bone remodeling. The accuracy of the system was evaluated by using solutions mimicking hydroxyapatite, the main component of bone, at different known concentrations (Nuzzo, S. et al., 2001). This property is related to the monochromaticity of the beam but also to the high SNR of SR micro-CT images, and makes it possible to quantify the local degree of mineralization in bones. The method was validated and compared with quantitative microradiography (Nuzzo, S. et al., 2002b). It is therefore possible to quantify the degree of mineralization of bone in three-dimensions simultaneously to the bone architecture. This technique was applied to study the effects of a
treatment for osteoporosis with etidronate on paired iliac crest biopsies (Nuzzo, S. et al., 2002a).
5. 3D analysis of SR micro-CT bone images
After tomographic reconstruction, 3D renderings of obtained data may be made by electronically stacking up the slices. These 3D volumes may be also sectioned in arbitrary ways, zoomed and rotated to better locate individual details. While the 2D slice images and 3D renderings are very useful for making qualitative observations of an internal concrete structure, the real benefit is the quantitative information that can be extracted from the 3D datasets.
The development of new 3D image analysis techniques is mandatory to fully exploit the wealth of information provided by SR micro-CT. We will thus review original image processing methods which are intimately related to the particular features of the available images. In this respect, the segmentation of the phases of interest is crucial since it will determine the accuracy of any quantitative analysis. The analysis of huge 3D images (between 2 and 16 GBytes per sample) involves the additional need to develop fast and automatic 3D image processing algorithms in order to study a statistically significant amount of data.
5.1 Segmentation of bone from background
With SR micro-CT, the segmentation of bone from background is much easier than with standard micro-CT due to the high SNR and high contrast in the image. In addition, parallel beam SR micro-CT avoids cone beam artifacts encountered in most standard micro-CT systems and resulting in various blurring effects. Thus it results that the gray level histogram of a SR micro-CT is typically bimodal, with two well defined peaks, one corresponding to background and the other to bone. Note that this property is deteriorating rather quickly with the spatial resolution of the image.
The segmentation of the bone phase can thus be appropriately done by simple thresholding based on standard techniques such as Otsu method. In SR micro-CT, the choice of the threshold will be less sensitive than in standard micro-CT, where this method is known to generate isolated particles and disconnection in the trabecular network. When processing a whole series of samples acquired in the same conditions, it is generally better to use the same threshold for all samples.
5.2 Separation of cortical and trabecular bone in a composite sample
To be biologically relevant, the extraction of quantitative parameters must be done separately on the trabecular and cortical envelops. This task cannot be simply performed by thresholding gray levels since both bone structures are in the same range of attenuation. In previous work, we proposed an automatic method to separate both cortical and trabecular bone in those bone samples that contained the two components (Martín-Badosa, E. et al., 2003b). To this aim, we used the fact that the cortical envelope, as being the external shell surrounding the trabecular bone, is much more compact than the trabecular bone. Thus, a customized algorithm for identification of the cortical envelope based on geometrical considerations was developed. The process was mainly based on an iterative filling procedure. The exterior region was scanned until bone was reached and filled with a constant gray level value. Then, the same procedure was used to label the cortical region
with a different gray-level value, starting from the exterior cortical border and stopping when darker regions were reached.
5.3 3D analysis of trabecular bone
5.3.1 Quantification of trabecular microarchitecture
The typical analysis of trabecular bone involves the computation of quantitative morphometric parameters calculated from the binarized images.
A first possible approach is to reproduce those parameters which are conventionally used in histomorphometry and are calculated slice by slice on the volume data (Peyrin, F. et al., 2000). This method, although based on a two-dimensional calculus, provides parameters which are measured throughout the volume and capture the variability of parameters both on the slice level and on the direction of analysis.
A second approach is to use a 3D version of the mean intercept length (MIL) method (Hipp, J.A. & Simmons, C.A., 1997), which was initially proposed for 2D images. For random directions in 3D space, the number of intercepts of a set of parallel test lines with the bone structure is computed and normalized by the total length of test lines. Then, a number of morphometric parameters are derived from the MIL measurements based on the hypothesis that the bone network is organized in a parallel plate model (Parfitt, A.M. et al., 1983): Trabecular Bone Volume fraction (BV/TV in %, where TV stands for total bone sample volume), Bone Surface on Bone Volume ratio (BS/BV in mm-1), Trabecular Thickness (Tb.Th
in mm), Trabecular Number (Tb.N in mm-1), and Trabecular Separation (Tb.Sp in mm). The
nomenclature used for quantifying bone microarchitecture in trabecular (and cortical) bone has been standardized in a reference paper of Parfitt (Parfitt, A.M. et al., 1987).
However, these so-called derived architectural parameters have the drawback to rely on a geometrical model of bone structures which is obviously not completely appropriate in all situations. This is particularly the case when comparing normal and pathological data since it may not be known if observed differences are real or are due to an inappropriate model.
Fortunately, the availability of 3D images makes it possible to avoid such assumptions, allowing the proposal of new model independent morphometric parameters.
A definition of local thickness on three-dimensional images proposed in the work (Hildebrand, T. & Rüegsegger, P., 1997a) evaluates the thickness at any point of the bone structure, which is a direct or model-independent definition requiring no prior assumption. A theoretical local thickness is defined at each point of the volume as the diameter of the maximal sphere centered in that point. We proposed a method for computing the local thickness of 3D discrete images based on discrete geometry (Martín-Badosa, E. et al., 2003b). A medial axis of the bone structure, defined by the centers of maximal balls, is derived from the local maxima of a 3D discrete distance map. The discrete thickness map is then obtained by propagating the sorted values of the diameter of the maximal balls to the entire balls. We typically use a 3D chamfer distance which provides a good approximation of the Euclidian distance (Apostol, L. et al., 2006). Figure 3 a) shows a 3D rendering of a human trabecular bone (voxel size : 10 µm) and its associated thickness map (Figure 3 b)). This method provides a thickness value at each point of the bone volume, and thus makes available the distribution of thickness over the entire volume. Statistical results such as the histogram of thickness, and the mean, median, and standard deviation of the distribution can be computed.
5.3.2 Topological and geometrical classification of the trabecular bone
Three-dimensional images may also be used to get information on the orientation and anisotropy of the structure, as well as on the topology of the bone network (Martín-Badosa, E. et al., 2003b). Orientation and anisotropy may be obtained from the MIL method by fitting the points defined by each direction and the normalized number of intersections in this direction, by an ellipsoid in 3D space (Hipp, J.A. & Simmons, C.A., 1997). The degree of anisotropy (DA) is estimated by the ratio of the largest to the smallest axis value. The main orientation of the ellipsoid gives an estimate of the orientation of the structure.
(a) (b)
Fig. 3. a) 3D SR micro-CT image of a human trabecular bone volume; b) the associated thickness map
In terms of topological parameters, the connectivity of the structure is often quantified using the number of Euler-Poincaré. A method for computing it on discrete three-dimensional images is described in the work of Odgaard (Odgaard, A. & Gundersen, H.J.G., 1993) and the result is often normalized to bone volume which is called Euler density. If the structure contains only one connected component, the Euler density decreases when the connectivity increases. Other studies have suggested the use of a skeleton to extract three-dimensional topological parameters, like the number of branches, number of connections (Pothuaud, L. et al., 2002). However, in three dimensions, there are different types of skeletons, wireframe or surface, and these methods have a high sensitivity to noise especially for high resolution images (Peyrin, F. et al., 1998b).
The assessment of the type of trabecular structure as being plate-like or rod-like was introduced by Hildebrand with the Structure Model Index (SMI) (Hildebrand, T. & Rüegsegger, P., 1997b). This parameter was a major advance in the characterization of trabecular bone since it is known that with age or disease, there is conversion of plate trabeculae into rods. The SMI thus provides relevant information about the plateness or rodness of the structure. Technically, the SMI involves the computation of the bone surface and its derivative and is based on a model.
However, while the SMI is a global parameter, it can also be of interest to characterize locally the geometry of trabeculae ("plate"-like or "rod"-like). First works in this area were done by analyzing the skeleton of the image and applied to in vivo MRI images (Wehrli, F.W. et al., 2001). Nevertheless, this method was restricted to the analysis of the skeleton, which can be noisy when dealing with SR micro-CT images at high resolution. To overcome this problem, a new method was introduced in order to characterize locally all voxels of the 3D image and not only the skeleton (Bonnassie, A. et al., 2003). This technique uses an original idea of making a local topological analysis in the neighbourhood of each point in order to classify the voxels of the bone structure (Peyrin, F. et al., 2007). This approach is based again on three–dimensional medial axis transformation for describing geometrical shapes in three-dimensional images. For 3D images, the medial axis, which is composed of both curves and medial surfaces, provides a simplified and reversible representation of structures. The local topological analysis method works in three main steps:
1. the voxels of the medial axis are classified in four classes: boundary, branching, regular and arc points.
2. the reversibility of the medial axis is used to propagate the classification to the whole object.
3. the boundary points are eliminated.
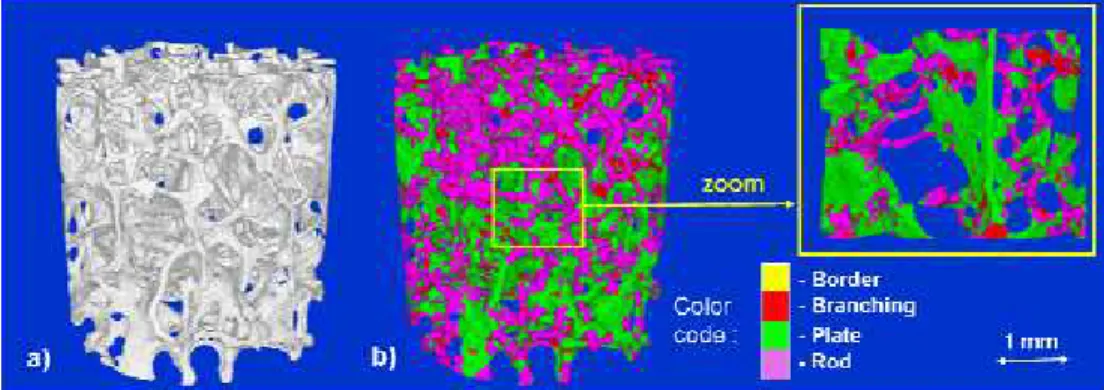
From this decomposition, it is possible to count the percentage of branch, plate and rod points in the bone volume, respectively denoted NV/BV, PV/BV, and RV/BV, as well as the thickness of each structure of interest (Peyrin, F. et al., 2010). As an illustration, Figure 4 shows the application of this method to a trabecular bone volume obtained by SR micro-CT at the ESRF (voxel size : 10µm). The labelled volume is shown on Figure 4 b), and on the zoomed image one can see the highly reliable classification of the original volume’s voxels.
Fig. 4. a) human trabecular bone; b) local topological classification
5.4 Analysis of cortical bone
Although less studied than trabecular bone, the investigation of cortical bone is also raising increasing interest The possibility offered by SR micro-CT to tune the energy higher than for trabecular bone is an important asset to get quantitative images of cortical bone. Figure 5 a) shows the 3D rendering of a typical cortical bone sample imaged from SR micro-CT (voxel size : 10 µm), illustrating its compact structure compared to that of trabecular bone presented above.
(a) (b)
Fig. 5. a) 3D rendering of the cortical bone (6x6x6 mm3 sample) imaged with SR micro-CT
(voxel size : 10 µm); b) porous network of a) limited to 300 µm thickness corresponding to the arrangement of Havers and Volkman canals
5.4.1 Extraction of the canal network from the cortical bone
The filled cortical bone envelop, can typically be obtained by using mathematical morphology tools, including opening and closing operations (Bousson, V. et al., 2004). The pore network can be then easily segmented from the SR micro-CT image by subtracting the porous cortical volume to the cortical envelop, as demonstrated in Figure 5 b).
As described in section 2, the pore network in cortical bone including the so-called Havers and Volkman canals is of great interest to characterize cortical bone. This network which is extremely dense can be characterized by using the same types of parameters than those used for the quantification of the trabecular bone network (see section 5.3.1). The porosity can be evaluated as the ratio of the pore volume to the filled cortical envelop (Cooper, D.M. et al., 2007).
5.4.2 Segmentation of remodeling regions
Compared to standard micro-CT, we already pointed out that SR micro-CT has the ability to provide the mineral concentration in bone tissue, also called the degree of mineralization of bone (DMB). The quantification of the DMB provides important information about the metabolism of bone and is typically only studied by 2D methods.
However, even if the Bone Mineral Units (BMUs) can be observed in the SR micro-CT slices (see Figure 6a)), their automatic detection is challenging since the contrast between osteons and interstitial bone may be very weak and close to the standard deviation of noise.
So far, the quantification of ancient versus new bone from SR micro-CT images had only been addressed by simple thresholding (Borah, B. et al., 2006) and global parameters such as the mean and standard deviation calculated on the entire bone phase were used to characterize the DMB. Although this method may give an approximate value of the respective volume of the two phases, it is obviously not sufficient to identify each osteon.
In a previous work, we addressed this problem and proposed a segmentation scheme associated to a denoising process (Peter, Z. et al., 2008). While there are many general segmentation approaches which perform well in various applications, a number of them fail when they are used to separate low-contrast features. Several approaches, such as K-means or a region growing method using the energy model of Mumford and Shah (Dibos, F. & Koepfler, G., 2000) were tested to segment osteons. The later is based on the minimization of an energy term incorporating a constraint on the curvature. Although these methods seemed attractive, the results showed over-segmentations: false detections appeared in bone background and a remodeling zone corresponding to a physiological entity could be split in many sub-regions. Thus we designed a customized method based on a region growing segmentation scheme associated to a denoising process using wavelets. The first step of the method was to improve the signal to noise ratio of the image by using a denoising method which preserves high frequency features and contours. Then, we developed customized region growing methods, which use some prior biological knowledge and whose principles will be recalled in the following section.
Denoising
Despite their exceptional quality, SR micro-CT images are generally corrupted by photonic Poisson or Gaussian noise and ring artifacts, related to image formation process. These may influence to some extent the treatment, because the structures of interest are generally small and with low contrast. To avoid the degradation of the spatial resolution, a non linear denoising method is preferred.
In this class, wavelet based denoising has been showed efficient in many applications (Mallat, S., 1997). Basically, the noisy image is transformed into the wavelet domain, then the wavelet coefficients are subjected to soft or hard thresholding, and in the last step the result is inverse-transformed. If W denote the wavelet transform (and w the set of the wavelet coefficients), then the whole denoising process with a threshold t , amounts to a non-linear operator Tη :
W W
Tη= −1cηtc (1)
where ηt
( )
w =sgn( )
w( )
w−t+ for the soft thresholding, and ηt( )
w = 1w{ }
w>t for the hardthresholding.
The application of this method yields some oscillations which are especially pronounced in the vicinity of discontinuities and rapid changes (Donoho, D. & Coifman, R. R., 1995). These “pseudo-Gibbs” oscillations are caused by the fact that only a subset of the full set of basis elements has been used for the reconstruction after the thresholding. In contrast to the classical Gibbs-phenomena associated with Fourier analysis, the “pseudo-Gibbs-phenomena” are much better behaved, much better localized and much more moderate in oscillation; nevertheless they can yield incorrect results in the subsequent segmentation. These artifacts exhibited by denoising with traditional wavelet transforms are due to the lack of translation invariance of the wavelet basis. The main idea of the “second generation denoising” method, also called “translation invariant (TI) wavelet denoising”, proposed in (Donoho, D. & Coifman, R. R., 1995), is the following: for a range of shifts, one shifts the data, denoises the shifted data and then unshifts the denoised data. Doing this for each of a
range of shifts, and averaging the several results so obtained, produces a reconstruction subject to far weaker Gibbs phenomena.
For a signal
(
xt:0≤t<n)
, let Sh denote the circulant shift by h∈Ν,( )
Shxt =x( )t+h modn. Thisoperator is unitary, and hence invertible: S−h=
( )
Sh −1. In term of operators, the idea ofshifting to avoid artifacts is the following: given an analysis technique Tη, calculate the shifted version T~η, for a range H of shifts (all n for instance) and average over the several results so obtained:
( )
(
x S)
Aver S(
T(
S( )
x)
)
Tη ; h h∈H = h∈H −h η h ~ . (2) Hard thresholding combined with translation invariance give both good visual quantitativecharacteristics (Donoho, D. & Coifman, R. R., 1995).
Segmentation
Among the different possible approaches to image segmentation, we proposed to use a customized region growing taking into account biological prior information. According to bone physiology, osteons in cortical bone are located around pores and are relatively elliptic although their shapes may vary (see for instance the darker zones around the black pores on Figure 6 a) ). The method proceeds as follows.
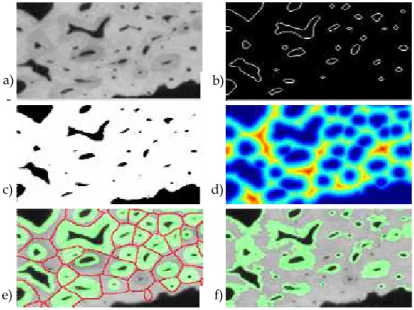
First, the original image (Figure 6 a)) is binarized using a threshold which enables to keep as much pores as possible (Figure 6 c)). The contours are detected by a simple gradient method and the exterior contour is eliminated. The pore contours (Figure 6 b) are then obtained and tracked to get closed and 1 pixel-thick contours. Then a connected component analysis is performed in order to label each pore contour. This image is then used to initialize the region growing process. The number of connected pore sets the number of regions in the image.
The simple region growing method proceeds as follows. For each region, labeled by l , a neighbor pixel x=
( )
x,y is labeled in the region if :) ( ) ( ) ( ml l I x − <ασ (3)
where I(x) is the image gray level, m(l) and σ(l) are the current mean and standard deviation of the region, and α is a parameter. The direct application of this algorithm gives poor results, but using denoising schemes like TI wavelets prior to segmentation considerably improved the quality of the segmentation. On Figure 6 f) we can check the localization and the shape of detected remodeling zones, superimposed to the original image. Although some remodeling zones are missing, a majority of them are detected at the good location. However the application of this method shows a number of problems. First, some regions are missing: looking in more details to the image, it appeared that some remodeling zones aren't really homogeneous due to phase contrast which is inherent to SR micro-CT imaging and creates a contrast which behaves as a second derivative at the boundaries. This phase contrast is almost invisible but may also compromise the growing of some regions. Second, leakage in ring artifacts frequently occurs, leading to false detection. Therefore we proposed a second segmentation strategy including shape constraints to overcome this inconveniency. To this aim, we exploited the additional biological prior that remodeling zones are formed around the pores, they follow roughly the shape of the
contours and their thickness is also almost isotropic around each pore. This physiological sketch led us to use the distance map dist associated to the image. The different steps of the method are illustrated in Figure 6. We calculate the distance map of the binarized image (see Figure 6 d)). The brightness (“hotness”) of each pixel in the distance map is the distance to the nearest boundary, so in our case, to the nearest pore. The hotter a pixel is, it is farther from a pore. The maxima lines of the distance map give the best estimate of the separation lines between two different remodeling regions. The maxima of the distance map correspond to the boundaries of the watershed image (see Figure 6 e)).
The regions to be segmented are initialized, as previously, by the contours of the pores, but now assuming that the remodeling regions are entirely included in the polygon-like zones (the so-called “catchment basins”) delimitated by the watershed boundaries around each pore. Each remodeling zone is segmented separately starting from the initial contours. For each label l , the segmented remodeling zone is constructed by agglomerating pixels at increasing distances satisfying a given criterion while being still included in the corresponding watershed zone (catchment basin) Cl. The final segmentation of each
remodeling zone can be expressed by:
( ) ( )
( )
{
l l}
l I x y x y C dist x y d
R = , / , ∈ and , ≤ (4)
and the overall segmentation result by applying this method is represented on Figure 6 e).
Fig. 6. a) Region of Interest on the original cortical bone slice : the remodeling regions appear in darker gray levels around the black pores; b) the contours of the pores; c) the binarized image associated to a); d) the distance map image (coded with the “jet” colorbar) obtained from c); e) location of remodeling regions: overlay of the areas segmented with the shape constraint method (in green) and the boundaries of watershed image (in red) on the original image on a); f) the initial segmentation of the osteons, obtained by homogeneity guided region growing.
c) e) d) f) b) a)
Different criteria may be used to define the maximum distance dl, corresponding to the
thickness of the remodeling zones. We used the maximization of the derivative of the mean gray level value of the pixels at a given distance from the pore. Roughly speaking, this distance is supposed to identify the change in the image contrast and it corresponds to the boundary of the remodeling zones.
The results presented in Figure 6 e) show that the segmentation is closely related to the shape of the pores and is no more influenced by the ring artifacts since it is purely related on the maximal thickness of the zone. However, this method can also slightly under-estimate those remodeling regions whose boundary is irregular around the pore.
6. Application of the SR micro-CT in bone research
Applications of SR micro-CT in bone research have been performed at different synchrotrons in the world (SSL (Swiss Light Source), ALS, in Lawrence Berkeley National Laboratory Berkeley National (USA), Japan, ESRF). In most studies, the important property of SR micro-CT to provide the degree of mineralization of bone was exploited. We shall only mention a few of these studies, either related to animal models or to human bone.
SR micro-CT has first been used to study the effects of treatment of osteoporosis with etidronate by analyzing biopsies from osteoporotic patients before and after one or two years of treatment. The results showed an increased degree of mineralization with the treatment without significant modification of the micro-architecture, which was in agreement with what was expected with a biphosphonate treatement (Nuzzo, S. et al., 2002a) (Meunier, P.J. & Boivin, G., 1997). A more recent study focused on the characterization of subchondral bone in patients with osteoarthritis and osteoporosis (Chappard, C. et al., 2006). A significant increase in the thickness of trabeculae in patients with osteoarthritis and a lower degree of mineralization were observed, which can be interpreted by an increase in bone remodeling activity.
With the development of studies on animal models for therapeutics or genetics, imaging of small animals, and particularly mice, has become a major issue. In this field, SR micro-CT offering higher spatial and density resolution is also particularly attractive. It was used to assess significant differences in micro-architecture and mineralization between two strains of mice (Martín-Badosa, E. et al., 2003a). In addition these two strains showed a different response to a model of osteoporosis by hind-limb suspension (Martín-Badosa, E. et al., 2003a). The properties of SR micro-CT were particularly exploited to study the mineralization in genetically modified mice and in treated mice with bone metabolic diseases (Yao, W. et al., 2006), (Balooch, G. et al., 2007). SR micro-CT at the micrometer scale permitted to study the role of insulin like growth factor-I (IGF-I) in regulating bone mineralization in fetal bone structure (Burghardt, A.J. et al., 2007). While most studies were performed after animal sacrifice, the feasibility of imaging mice bone in vivo with SR micro-CT was also demonstrated (Kinney, J.H. et al., 1998), (Bayat, S. et al., 2005).
7. Conclusions and future works
The development of micro-CT in bone research was first driven by the need for having a highly precise means of reconstructing the complex architecture of bone tissue at a high resolution. During the last decade, it has become a standard tool for the evaluation of bone micro-architecture. By exploiting the physical properties of synchrotron light, Synchrotron
micro-CT overpasses standard micro-CT. Its major advantage is to allow the simultaneous analysis of bone morphometry and bone mineralization.
The quantitative exploitation of SR micro-CT images has also driven the development of new image analysis techniques that have been briefly recalled in this chapter. Specific developments were designed to extract morphometric, topologic and geometric parameters on the trabecular network. Work is also in progress to analyze the osteonal system in cortical bone, including the pore network and the remodeling zones. The methods developed so far have already been applied in a number of studies on human or animal bone. A limitation is that SR micro-CT techniques cannot be used in vivo on humans (due to the high X-ray dose received by the samples (Salome, M. et al., 1999)), but only ex vivo on extracted bone biopsies.
A first perspective in SR micro-CT is to push the resolution limit at the nanometer level, which is currently an active research topic at the international level. This opens interesting opportunities and can help to visualize in particular unrevealed features of bone ultra-structure. The feasibility of visualizing osteocyte lacunae in human vertebra imaged at two scales (6.7 and 1.4 μm) was demonstrated in an earlier work (Peyrin, F. et al., 1998a). Nevertheless, relatively few micro-CT studies have so far been conducted on bone ultrastructure in humans (Hengsberger, S. et al., 2003) and mice (Schneider, P. et al., 2007). We have also presented recently new methods for extracting three-dimensional characteristics of osteocyte lacunae and micro-cracks (Peyrin, F., 2009), (Larrue, A. et al., 2007). This subject with the development of new nano-CT systems is becoming a hot topic to characterize the osteocyte system which has a fundamental role in bone biology.
A second perspective in SR micro-CT is to exploit phase contrast imaging which is also raising increasing interest. While different experimental procedures allow obtaining phase contrast, the coherence properties of the ESRF beam makes it possible to implement phase contrast by simple propagation. Phase contrast imaging allows to image samples with low absorption and to enhance very small differences in attenuation. Different acquisition strategies may be used. The “edge enhancement” mode consists in making a scan with the detector not just after the sample but at a given distance. The “holotomographic” mode consists in recording several scans (in general two to four) placing the detector at different distances from the sample. In this case, the phase map is obtained by tomographic reconstruction after a so-called “phase retrieval” algorithm, processing the radiographs acquired at these different distances for each angle. The phase retrieval methods which were initially proposed for low absorbing samples have recently been extended to absorbing samples (Langer, M. et al., 2008), and open interesting perspectives to quantify simultaneously the bone tissue and the organic matrix.
A third perspective, is the development of new image analysis methods to provide smart solutions to image segmentation and analysis in this domain, which also requires multidisciplinary vision on bone research. These new techniques should be inspired from recent theoretical developments in fields like mathematics or image processing (engineering). It is mandatory to integrate improvements in data backup solutions but also of new techniques in speeding up computer calculations. The complex processing algorithms should be parallelized in order to manage huge 3D image volumes of about 16 Gbytes/volume. The advances concerning the GPU (Graphics Processing Unit) and their compatibility with widely used scientific softwares could make possible to manipulate easier 3D renderings, which is very important when working with 3D image volumes representing such a complex and multiscale structures like the bone tissue.
All these improvements together raise exciting perspectives to acquire novel knowledge on bone tissue, bone strength and the physiopathology of bone.
8. References
Apostol, L.; Boudousq, V.; Basset, O.; Odet C.; Yot, S.; Tabary, J.; Dinten, J.M.; Boller, E.; Kotzki, P.O. & Peyrin, F. (2006). Relevance of 2D radiographic texture analysis for the assessment of 3D bone micro-architecture. Med. Phys., Vol. 33, N°. 9, p. 3546-3556.
Balooch, G.; Yao, W.; Ager, J.W.; Balooch, M.; Nalla, R.K.; Porter, A.E.; Ritchie, R.O. & Lane, N.E. (2007). The aminobisphosphonate risedronate preserves localized mineral and material properties of bone in the presence of glucocorticoid. Arthritis Rheum., Vol. 56, N°. 11, p. 3726-3737.
Bayat, S.; Apostol, L.; Boller, E.; Brochard, T. & Peyrin, F. (2005). In vivo imaging of bone micro-architecture in mice with 3D synchrotron radiation microtomography. Nucl. Instrum. Meth. Phys. Res. A (Elsevier), Vol. 548, p. 247-252.
Benhamou, C.L.; Poupon, S.; Lespessailles, E.; Loiseau, S.; Jennane, R.; Siroux, V.; Ohley, W. & Pothuaud, L. (2001). Fractal analysis of radiographic trabecular bone texture and bone mineral density: two complementary parameters related to osteoporotic fractures. J. Bone Miner. Res., Vol. 16, N°. 4, p. 697-704.
Bonnassie, A.; Peyrin, F. & Attali, D. (2003). A new method for analyzing local shape in three-dimensional images based on medial axis transformation. IEEE Transactions on Systems, Man and Cybernetics, PART B-CYBERNETICS, Vol. 33, N°. 4, p. 700-705. Bonse, U.; Busch, F.; Günnewig, O.; Beckmann, F.; Pahl, R.; Delling, G.; Hahn, M. & Graeff,
W. (1994). 3D computed X-ray tomography of human cancellous bone at 8 µm spatial resolution and 10-4 energy resolution. Bone and Mineral, Vol. 25, p. 25-38. Borah, B.; Dufresne, T.E.; Ritman, E.L.; Jorgensen, S.M.; Liu, S.; Chmielewski, P.A.; Phipps,
R.J.; Zhou, X.; Sibonga, J.D. & Turner, R.T. (2006). Long-term risedronate treatment normalizes mineralization and continues to preserve trabecular architecture: sequential triple biopsy studies with micro-computed tomography. Bone, Vol. 39, N°. 2, p. 345–352.
Bousson, V.; Bergot, C.; Meunier, A.; Barbot, F.; Parlier-Cuau, C.; Laval-Jeantet, A.M. & Laredo, J.-D. (2000). CT of the middiaphyseal femur: Cortical bone mineral density and relation to porosity. Radiology, Vol. 217, p. 179-187.
Bousson, V.; Meunier, A.; Bergot, C.; Vicaut, E.; Rocha, M.A.; Morais, M.H.; Laval-Jeantet, A.-M. & Laredo, J.-D. (2001). Distribution of intracortical porosity in human midfemoral cortex by age and gender. J. Bone Miner. Res., Vol. 16, N°. 7, p. 1308-1317.
Bousson, V.; Peyrin, F.; Bergot, C.; Hausard, M.; Sautet, A. & Laredo J.D. (2004). Cortical bone of the human femoral neck : three-dimensional appearance and porosity using synchrotron radiation. J. Bone Miner. Res., Vol. 19, N°. 5, p. 794-801.
Burghardt, A.J.; Wang, Y.; Elalieh, H.; Thibault, X.; Bikle, D.; Peyrin, F. & Majumdar, S. (2007). Evaluation of fetal bone structure and mineralization in IGF-I deficient mice using synchrotron radiation microtomography and Fourier transform infrared spectroscopy. Bone, Vol. 40, N°. 1, p. 160–168.
Chappard, C.; Peyrin, F.; Bonnassie, A.; Lemineur, G.; Brunet-Imbault, B.; Lespessailles, E. & Benhamou, C.L. (2006). Subchondral bone micro-architectural alterations in osteoarthritis: a synchrotron micro-computed tomography study. Osteoarthritis Cartilage, Vol. 14, N°. 3, p. 215–223.
Chevalier, F.; Laval-Jeantet, A.M.; Laval-Jeantet, M. & Bergot, C. (1992). CT image analysis of the vertebral trabecular network in vivo. Calcified Tissue International, Vol. 51, p. 8-13.
Cloetens, P.; Pateyron-Salomé, M.; Buffière, J.; Peix, G.; Baruchel, J.; Peyrin, F. & Schlenker, M. (1997). Observation of microstructure and damage in materials by phase sensitive radiography and tomography. J. Appl. Phys., Vol. 81, p. 5878–5886.
Cooper, D.M.; Thomas, C.D.; Clement, J.G. & Hallgrímsson, B. (2006). Three-dimensional microcomputed tomography imaging of basic multicellular unit-related resorption spaces in human cortical bone. Anat. Rec. A Discov. Mol. Cell. Evol. Biol., Vol. 288, N°. 7, p. 806-816.
Cooper, D.M.; Turinsky, A.; Sensen, C. & Hallgrimsson, B. (2007). Effect of voxel size on 3D micro-CT analysis of cortical bone porosity. Calcif. Tissue Int., Vol. 80, N°. 3, p. 211-219.
Cortet, B.; Cohn, D.; Dubois, P.; Delcambre, B. & Marchandise, X. (1995). Les differentes methodes d’analyse quantitative de la structure osseuse trabeculaire. Rev. Rhum. [French edition], Vol. 62, p. 841-855.
Dibos, F. & Koepfler, G. (2000). Global total variation minimization. SIAM Journal on Numerical Analysis, Vol. 37, p. 646-664.
Donoho, D. & Coifman, R. R. (1995). Translation Invariant De-Noising. Wavelets and Statistics, A. Antoniadis and G. Oppenheim, Eds. New York: Springer-Verlag, p. 125--150.
Engelke, K.; Lohmann, M.; Dix, W.R. & Graeff, W. (1989). A system for dual energy microtomography of bones. Nuclear Instruments and Methods in Physics Research, Vol. 274, p. 380-389.
Engelke, K.; Mastmeyer, A.; Bousson, V.; Fuerst, T.; Laredo, J.D. & Kalender W.A. (2009). Reanalysis precision of 3D quantitative computed tomography (QCT) of the spine. Bone, Vol. 44, N°. 4, p. 566-572.
Feldkamp, L.A.; Goldstein, S.A.; Parfitt, A.M.; Jesion, G. & Kleerekoper, M. (1989). The direct examination of three-dimensional bone architecture in vitro by computed tomography. J. Bone Miner. Res., Vol. 4, p. 3-11.
Hengsberger, S.; Enstroem, J.; Peyrin, F. & Zysset, P. (2003). How is the indentation modulus of bone tissue related to its macroscopic elastic response? A validation study. J. Biomech., Vol. 36, N°. 10, p. 1503– 1509.
Hildebrand, T. & Rüegsegger, P. (1997a). A new method for the model independent assessment of thickness in three-dimensional images. J. Microsc., N°. 185, p. 67-75. Hildebrand, T. & Rüegsegger, P. (1997b). Quantification of bone microarchitecture with the
Structure Model Index. Comp. Meth. Biomech. Biomed. Eng., Vol. 1, p. 15-23.
Hipp, J.A. & Simmons, C.A. (1997). Method-based differences in the automated analysis of the three-dimensional morphology of trabecular bone. J. Bone Miner. Res., Vol. 12, p. 942-947.
Kinney, J.H.; Lane, N.E. & Haupt, D. L. (1995). In vivo, Three-dimensional microscopy of trabecular bone. J. Bone Miner. Res., Vol. 10, p. 264-270.
Kinney, J.H.; Ryaby, J.T.; Haupt, D.L. & Lane, N.E. (1998). Three-dimensional in vivo morphometry of trabecular bone in the OVX rat model of osteoporosis. Technol. Health Care, Vol. 6, N°. 5-6, p. 339-350.
Labiche, J.-C.; Maton, O.; Pascarelli, S.; Newton, M.A.; Ferre, G.C.; Curfs, C.; Vaughan, G.; Homs, A. & Carreiras, D.F. (2007). The FReLoN camera as a versatile X-ray detector for time resolved dispersive EXAFS and diffraction studies of dynamic problems in materials science, chemistry, and catalysis. Rev. Sci. Instrum., N°. 091301.
Langer, M.; Cloetens, P.; Guigay, J.P. & Peyrin, F. (2008). Quantitative comparison of direct phase retrieval algorithms in in-line phase tomography. Med. Phys., Vol. 35, p. 4556-4566.
Larrue, A.; Rattner, A.; Laroche, N.; Vico, L. & Peyrin, F. (2007). Feasibility of micro-crack detection in human trabecular bone images from 3D synchrotron microtomography. Proc. IEEE Eng. Med. Biol. Soc., p. 3918-3921.
Laval-Jeantet, A.M.; Chevalier, F.; Bergot, C., Laval-Jeantet, M.; Peyrin, F. & Houssard, J.P. (1993). La structure trabéculaire vertébrale en tomodensitométrie. Architecture et resistance mecanique osseuses, Marcelli, C; Sebert, J.L., Eds. Paris : Masson, p. 82-91. Mallat, S. (1997). A Wavelet Tour of Signal Processing, San Diego, CA: Academic Press.
Martín-Badosa, E.; Amblard, D.; Nuzzo, S.; Elmoutaouakkil, A.; Vico, L. & Peyrin, F. (2003a). Excised bone structures in mice: imaging at three-dimensional synchrotron radiation micro CT. Radiology, Vol. 229, N°. 3, p. 921-928.
Martín-Badosa, E.; Elmoutaouakkil, A.; Nuzzo, S.; Amblard, D.; Vico, L. & Peyrin, F. (2003b). A method for the automatic characterization of bone architecture in 3D mice microtomographic images. Computerized Medical Imaging and Graphics, Vol. 27, N°. 6, p. 447-458.
Meunier, P.J. & Boivin, G. (1997). Bone Mineral Density Reflects bone mass but also the degree of mineralization of bone: therapeutic implications. Bone, Vol. 21, p. 373-377. Mokso, R.; Cloetens, P.; Maire, E.; Ludwig, W. & Buffière, J.-Y. (2007). Nanoscale zoom
tomography with hard X rays using Kirkpatrick–Baez optics. Appl. Phys. Lett., Vol. 90, N°. 144104.
Mundinger, A.; Wiesmeier, B.; Dinkel, E.; Helwig, E.; Beck, A. & Schulte-Moenting, J. (1993). Quantitative image analysis of vertebral body architecture-improved diagnosis in osteoporosis based on high-resolution computed tomography. Br. J. Radiol., Vol. 66, p. 209-213.
Nuzzo, S.; Lafage-Proust, M.H.; Martin-Badosa, E.; Boivin, G.; Thomas, T.; Alexandre, C. & Peyrin, F. (2002a). Synchrotron Radiation Microtomography Allows the Analysis of Three-Dimensional Micro-architecture and Degree of Mineralization of Human Iliac Crest Biopsies: Effects of Etidronate Treatment. J. Bone Miner. Res., Vol. 17, N°. 8, p. 1372-1382.
Nuzzo, S.; Peyrin, F.; Cloetens, P.; Baruchel, J. & Boivin G. (2002b). Quantification of the degree of mineralization of bone in three dimension using Synchrotron Radiation Microtomography. Med. Phys., Vol. 19, N°. 11, p. 2672-2681.
Nuzzo, S.; Peyrin, F.; Martín-Badosa, E.; Lafage-Proust, M.H. & Boivin, G. (2001). Assessment of Bone Mineral Content from 3D Synchrotron Radiation Microtomography Images. IEEE Transactions On Nuclear Science, Vol. 48, N°. 3(Pt2), p. 859 –863.
Nuzzo, S.; Peyrin, F.; Martín-Badosa, E.; Lafage-Proust, M.H. & Boivin, G. (2003). Quantitative analysis of mineral bone variation in 3D Synchrotron Radiation Microtomography images. J. Bone Miner. Res., Vol. 18, N°. 4, p. 760-768.
Odgaard, A. & Gundersen, H.J.G. (1993). Quantification of connectivity in cancellous bone, with special emphasis on 3D reconstructions. Bone, Vol. 14, p. 173-182.
Parfitt, A.M.; Drezner, M.K.; Glorieux, F.H.; Kanis, J.A.; Malluche, H.; Meunier, P.J.; Ott, S.M. & Recker, R.R. (1987). Bone Histomorphometry: Standardization of Nomenclature, Symbols, and Units. J. Bone Miner. Res., Vol. 2, N°. 6, p. 595-610. Parfitt, A.M.; Mathews, C.H.; Villanueva, A.R.; Kleerekoper, M.; Frame, B. & Rao, D.S.
(1983). Relationships between surface, volume, and thickness of iliac trabecular bone in aging and in osteoporosis. Implications for the microanatomic and cellular mechanisms of bone loss. J. Clin. Invest., Vol. 72, N°. 4, p. 1396-1409.
Peter, Z.; Bousson, V.; Bergot, C. & Peyrin F. (2008). A constrained region growing approach based on watershed for the segmentation of low contrast structures in bone micro-CT images. Pattern Recognition, Vol. 41, N°. 7, p. 2358-2368.
Peyrin, F. (2009). Investigation of bone with synchrotron radiation imaging: from micro to nano. Osteoporos. Int., Vol. 20, N°. 6, p. 1057-1063.
Peyrin, F.; Attali, D.; Chappard, C. & Benhamou, C.L. (2010). New geometric parameters for the description of three-dimensional bone structures from very high resolution microtomography images. Med. Phys., Vol. 37, N°. 8, p. 4364-4376.
Peyrin, F.; Peter, Z.; Larrue, A.; Bonnassie, A. & Attali, D. (2007). Local geometrical analysis of 3D porous network based on medial axis: application to bone micro-architecture microtomography images. Image Analysis & Stereology, Vol. 26, N°. 3, p. 179-185. Peyrin, F.; Salome, M., Cloetens, P., Laval-Jeantet, A.M.; Ritman, E. & Rüegsegger, P.
(1998a). Micro-CT examinations of trabecular bone samples at different resolutions : 14, 7 and 2 micron level. Technology and Health Care, Vol. 6, p. 391-401.
Peyrin, F.; Salome, M.; Dupont, F.; Laval-Jeantet, A.M.; Cloetens, P. & Baruchel, J. (1998b). 3D Synchrotron Radiation microtomography imaging : characterisation of bone architecture. Image and Multidimensional Digital Signal Processing. Proceedings of IEEE SP society. Niemann, H.; Seidel, H.P.; Girod, B., Eds.; Alpbach, Austria, p. 55-58.
Peyrin, F.; Salome, M.; Nuzzo, S.; Cloetens, P.; Laval-Jeantet, A.M. & Baruchel, J. (2000). Perspectives in three-dimensional analysis of bone samples using synchrotron radiation microtomography. Cell. Mol. Biol., Vol. 46, p. 1089-1102.
Pothuaud, L.; Laib, A.; Levitz, P.; Benhamou, C.L. & Majumdar, S. (2002). Three-dimensional-line skeleton graph analysis of high-resolution magnetic resonance images: a validation study from 34-µm-resolution microcomputed tomography. J. Bone Miner. Res., Vol. 17, N°. 10, p. 1883-1895.
Salome, M.; Peyrin, F.; Cloetens, P.; Odet, C.; Laval-Jeantet, A.M.; Baruchel, J. & Spanne, P. (1999). A synchrotron radiation microtomography system for the analysis of trabecular bone samples. Med. Phys., Vol. 26, N°. 10, p. 2194 - 2204.
Schneider, P.; Stauber, M.; Voide, R.; Stampanoni, M.; Donahue, L.R. & Müller, R. (2007). Ultra-structural properties in cortical bone vary greatly in two inbred strains of mice as assessed by synchrotron light based micro- and nano-CT. J. Bone Miner. Res., Vol. 22, N°. 10, p. 1557–1570.
Wehrli, F.W.; Gomberg, B.R.; Saha, P.K.; Song, H.K.; Hwang, S.N. & Snyder, P.J. (2001). Digital topological analysis of in vivo magnetic resonance microimages of trabecular bone reveals structural implications of osteoporosis. J. Bone Miner. Res., Vol. 16, N°. 8, p. 1520-1531.
Weitkamp, T.; Tafforeau, P.; Boller, E.; Cloetens, P.; Valade, J.-P.; Bernard, P.; Peyrin, F.; Ludwig, W.; Helfen, L. & Baruchel, J. (2010). Status and evolution of the ESRF beamline ID19. Proc ICXOM20, Karlsruhe, Germany, 2009, in X-RAY OPTICS AND MICROANALYSIS, PROCEEDINGS Book Series AIP Conference Proceedings, Vol. 1221, p. 33-38.
Yao, W.; Balooch, G.; Balooch, M.; Jiang, Y.; Nalla, R.K.; Kinney, J.; Wronski, T.J. & Lane, N.E. (2006). Sequential treatment of ovariectomized mice with bFGF and risedronate restored trabecular bone microarchitecture and mineralization. Bone, Vol. 39, N°. 3, p. 460–469.
Edited by Prof. Noriyasu Homma
ISBN 978-953-307-234-0 Hard cover, 290 pages
Publisher InTech
Published online 04, April, 2011 Published in print edition April, 2011
InTech Europe
University Campus STeP Ri Slavka Krautzeka 83/A 51000 Rijeka, Croatia Phone: +385 (51) 770 447 Fax: +385 (51) 686 166 www.intechopen.com
InTech China
Unit 405, Office Block, Hotel Equatorial Shanghai No.65, Yan An Road (West), Shanghai, 200040, China Phone: +86-21-62489820
Fax: +86-21-62489821
The x-ray computed tomography (CT) is well known as a useful imaging method and thus CT images have continuingly been used for many applications, especially in medical fields. This book discloses recent advances and new ideas in theories and applications for CT imaging and its analysis. The 16 chapters selected in this book cover not only the major topics of CT imaging and analysis in medical fields, but also some advanced applications for forensic and industrial purposes. These chapters propose state-of-the-art approaches and cutting-edge research results.
How to reference
In order to correctly reference this scholarly work, feel free to copy and paste the following:
Zsolt-Andrei Peter and Françoise Peyrin (2011). Synchrotron Radiation Micro-CT Imaging of Bone Tissue, Theory and Applications of CT Imaging and Analysis, Prof. Noriyasu Homma (Ed.), ISBN: 978-953-307-234-0, InTech, Available from: http://www.intechopen.com/books/theory-and-applications-of-ct-imaging-and-analysis/synchrotron-radiation-micro-ct-imaging-of-bone-tissue