HAL Id: hal-03203041
https://hal.archives-ouvertes.fr/hal-03203041
Submitted on 20 Apr 2021
HAL is a multi-disciplinary open access archive for the deposit and dissemination of sci-entific research documents, whether they are pub-lished or not. The documents may come from teaching and research institutions in France or abroad, or from public or private research centers.
L’archive ouverte pluridisciplinaire HAL, est destinée au dépôt et à la diffusion de documents scientifiques de niveau recherche, publiés ou non, émanant des établissements d’enseignement et de recherche français ou étrangers, des laboratoires publics ou privés.
Distributed under a Creative Commons Attribution - NonCommercial| 4.0 International
Skin autofluorescence predicts cancer in subjects with
type 2 diabetes
Ninon Foussard, Alice Larroumet, Marine Rigo, Kamel Mohammedi, Laurence
Baillet-Blanco, Pauline Poupon, Marie Monlun, Maxime Lecocq, Anne-Claire
Devouge, Claire Ducos, et al.
To cite this version:
Ninon Foussard, Alice Larroumet, Marine Rigo, Kamel Mohammedi, Laurence Baillet-Blanco, et al.. Skin autofluorescence predicts cancer in subjects with type 2 diabetes. BMJ Open Diabetes Research & Care, BMJ Journals, 2021, 9 (1), pp.e001312. �10.1136/bmjdrc-2020-001312�. �hal-03203041�
Open access Open access
Skin autofluorescence predicts cancer in
subjects with type 2 diabetes
Ninon Foussard ,1 Alice Larroumet ,1 Marine Rigo,1 Kamel Mohammedi,1 Laurence Baillet- Blanco,1 Pauline Poupon,1 Marie Monlun ,1 Maxime Lecocq,1
Anne- Claire Devouge ,1 Claire Ducos,1 Marion Liebart,1 Quentin Battaglini,1
Vincent Rigalleau1,2
1Nutrition- Diabetology, CHU
de Bordeaux, Hôpital Haut- Lévêque, Pessac, France
2INSERM U1219–Bordeaux
Population Health Research Center, Bordeaux, France Correspondence to Dr Ninon Foussard; ninonfoussard@ yahoo. fr
To cite: Foussard N,
Larroumet A, Rigo M, et al. Skin autofluorescence predicts cancer in subjects with type 2 diabetes.
BMJ Open Diab Res Care
2021;9:e001312. doi:10.1136/ bmjdrc-2020-001312 Received 25 February 2020 Revised 11 February 2021 Accepted 26 February 2021 Original research
© Author(s) (or their employer(s)) 2021. Re- use permitted under CC BY- NC. No commercial re- use. See rights and permissions. Published by BMJ.
ABSTRACT
Introduction Subjects with type 2 diabetes have an
excess risk of cancer. The potential role of advanced glycation end products (AGEs) accumulated during long- term hyperglycemia in cancer development has been suggested by biological studies but clinical data are missing. AGEs can be estimated by measuring the skin autofluorescence. We searched whether the skin autofluorescence could predict new cancers in persons with type 2 diabetes.
Research design and methods From 2009 to 2015,
we measured the skin autofluorescence of 413 subjects hospitalized for uncontrolled or complicated type 2 diabetes, without any history of cancer. The participants were followed for at least 1 year and the occurrences of new cancers were compared according to their initial skin autofluorescences.
Results The participants were mainly men (57.9%), with
poorly controlled (HbA1c 72±14 mmol/mol or 8.7%±1.8%) and/or complicated type 2 diabetes. Their median skin autofluorescence was 2.6 (2.2–3.0) arbitrary units. Forty- five new cancer cases (10.9%) were registered during 4.8±2.3 years of follow- up: 75.6% of these subjects had skin autofluorescence higher than the median (χ2: p=0.001). By Cox regression analysis adjusted for age, gender, body mass index, history of smoking and renal parameters, skin autofluorescence >2.6 predicted a 2.57- fold higher risk of cancer (95% CI 1.28 to 5.19, p=0.008). This association remained significant after excluding the eight cancers that occurred in the 4 years after inclusion (OR 2.95, 95% CI 1.36 to 6.38, p=0.006). As a continuous variable, skin autofluorescence was also related to new cancers (OR 1.05, 95% CI 1.01 to 1.10, p=0.045).
Conclusions Skin autofluorescence, a potential marker
of glycemic memory, predicts the occurrence of cancer in subjects with type 2 diabetes. This relation provides a new clinical argument for the role of AGEs in cancer. Their estimation by measuring the skin autofluorescence may help select subjects with diabetes in cancer screening programs.
INTRODUCTION
Subjects with type 2 diabetes have an excess risk of cancer by +20%–25%1: mainly
colorectal, liver, pancreas, and breast cancers.2
Obesity and the growth- promoting effects of insulin contribute to this risk,3 but they do
not explain +29% excess cancers in type 1
diabetes as recently reviewed.4 It is not known
whether chronic hyperglycemia may favor cancer by itself. Glucose is the main nutrient for cancer cells.5 High glucose levels can also
induce epigenetic changes enhancing their growth characteristics even after return to normoglycemic conditions: a ‘hyperglycemic memory’ phenomenon may occur in these cells,6 as described for the vascular
complica-tions of diabetes.
Advanced glycation end products (AGEs) generated during years of chronic hyper-glycemia are an important molecular basis for metabolic memory.7 Numerous
biolog-ical studies suggest a potential role for
Significance of this study
What is already known about this subject?
► Subjects with type 2 diabetes have an excess risk of cancer. It is not known whether chronic hyperglyce-mia may favor cancer by itself.
► Advanced glycation end products (AGEs), accumu-lated during long- term hyperglycemia, can be esti-mated by skin autofluorescence. The potential role in cancer development of AGEs has been suggested by biological studies but clinical data are missing.
What are the new findings?
► Subjects with type 2 diabetes who developed cancer had higher initial skin autofluorescence than those who did not.
► This association remained significant after multiad-justments and after exclusion of subjects who devel-oped cancer early after inclusion.
► Skin autofluorescence, a potential marker of glyce-mic memory, predicts the occurrence of cancer in subjects with type 2 diabetes.
► This relation provides a new clinical argument for the role of AGEs in cancer.
How might these results change the focus of research or clinical practice?
► Estimating AGEs by measuring the skin autofluo-rescence may help select subjects with diabetes in cancer screening programs.
on April 20, 2021 by guest. Protected by copyright.
http://drc.bmj.com/
Pathophysiology/complications
AGEs in the development of cancer. Methylglyoxal, a common AGE precursor and a product of the Mail-lard reaction, exerts pro- tumorous effects.8 The later
generated N-ε-(carboxymethyl)- lysine activates the growth of pancreatic cancer cells.9 The interaction of
AGEs with their receptors (RAGE) promotes epithelial- mesenchymal transition, inflammation, and angiogen-esis.10 The advanced glycation of the extracellular matrix
makes it stiffer, rigid, disorganized and dysfunctional, which helps the migration of cancer cells.10 The
accumu-lation of AGEs may be an important contributor to the effect of lifestyle- associated risk factors for cancer,11 but
clinical data arguing for this hypothesis are missing. Due to their fluorescent properties, the long- term accumulation of AGEs in tissues can be assessed by the simple, non- invasive measurement of the skin autofluo-rescence (SAF),12 a marker of glucose memory.13 In type 2
diabetes, the SAF predicts microangiopathic and macro-angiopathic complications.14 15 Does it predict cancer?
In 413 subjects with poorly controlled type 2 diabetes, free of cancer, we measured the SAF during years from 2009 to 2015. Thereafter, we registered new cancer cases until 1 September 2019, and we analyzed their relations with the initial autofluorescence.
METHODS Subjects
From years 2009 to 2015, a total of 413 persons with type 2 diabetes were consecutively included. They were all hospitalized in the Diabetology Unit of the Centre Hospi-talier Universitaire of Bordeaux (France) for uncon-trolled or complicated type 2 diabetes. We only included subjects who were later followed for at least 1 year. Thirty- four more subjects were excluded because they already had a cancer history (figure 1).
Data
At the time of inclusion, we recorded the main clinical characteristics of the participants: age, gender, body mass index (BMI), history of smoking, duration of diabetes,
presence of diabetic retinopathy or a foot ulcer. Macro-angiopathy was defined as a previous cardiovascular event: myocardial infarction, stroke or gangrene, or a previous revascularization procedure. Biological exam-inations were performed on blood and urine samples: HbA1c, serum creatinine, albumin excretion rates (AER). Glomerular filtration rates (GFR) were estimated by the Chronic Kidney Disease Epidemiology Collabora-tion formula.
Measurement of the SAF
The cutaneous accumulation of the AGEs was estimated from the SAF using an AGE Reader (DiagnOptics, Gron-ingen, The Netherlands). The AGEs detectable by their fluorescent property represent a subset of the AGEs. The device illuminated 1 cm2 of the forearm skin. We checked
that there were no scars and no application of cream16 on
the studied site. SAF values were calculated by dividing the mean emitted light intensity (excitation light source ranging from 420 to 600 nm) by the mean reflected exci-tation light intensity from the skin (over 300–420 nm). People with Fitzpatrick phototypes V and VI were not included due to their skin pigmentation, which had ultra-violet reflectance of <10%. The results were expressed in arbitrary units (AU).
Registering of new cancer cases
Searching for new cancers, we examined the medical files registered by the Centre Hospitalier Universitaire of Bordeaux until September 2019. The follow- up was stopped at the last visit in our institution. Registering was stopped on 1 September 2019.
Statistical analysis
The results are presented as mean±SD for continuous variables, median and IQRs for the SAF and the AERs, and as percentages for categorical variables. The char-acteristics of the subjects who developed a cancer were compared with the remaining free of cancer subjects by t- tests for continuous variables and χ2 for categorical
vari-ables. The free of cancer survival curves were compared between subjects categorized as having higher versus lower than the median SAF at inclusion, by Kaplan- Meier survival analysis, and we performed a Cox regression anal-ysis to adjust for potential confounders: age, gender, BMI, history of smoking, and renal parameters. To reduce the possibility of reverse causality, this analysis was repeated after exclusion of cancer cases occurring during the first 4 years after the inclusion.
RESULTS
Characteristics of the population
Four hundred and thirteen subjects were included, their main characteristics are reported in table 1. They were mainly men (57.9%), 62±9 years old, with obesity (BMI 32.5±6.0). 41.4% had history of smoking. Their type 2 diabetes (duration: 14±10 years) was poorly controlled (HbA1c 72±14 mmol/mol or 8.7%±1.8%) and/or
Figure 1 Flow chart. sAF, skin autofluorescence.
on April 20, 2021 by guest. Protected by copyright.
http://drc.bmj.com/
complicated (26.6% with diabetic retinopathy, 44.6% with diabetic kidney disease, 34.9% with macroangiopathy).
Skin autofluorescence
Their SAF was 2.6 (2.2–3.0) AU. As depicted in table 2, by multivariate regression analysis, the SAF was related to the age, the duration of diabetes, history of smoking, and negatively related to the estimated GFR. It was not related to the HbA1c.
New cancer cases
Forty- five new cancer cases (10.9%) were registered during the follow- up (4.8±2.3 years). The localizations were pulmonary (n=12), hepatic (n=8), colon (n=4), cutaneous (n=4), renal (n=3), prostatic (n=3), esoph-ageal (n=2), and individual cases for stomach, cholan-giocarcinoma, breast, endometrial, urothelial, thyroid, glioblastoma, lymphoma, chronic lymphoid leukemia. The subjects with new cancers are compared with the others in table 1. They were 4 years older, more men (both p<0.05), they did not differ in their BMI, diabetes duration and HbA1c, nor in the prevalence of diabetic vascular complications. Their SAF was higher (p<0.05).
Relation between SAF and new cancer cases
Thirty- four of new cancer cases (75.6%) occurred in subjects with SAF higher than the median value: 2.60 AU (p=0.001 by χ2). The cancer- free survival curves
according to such a high SAF are depicted in figure 2
(log rank: 12.4; p=0.0004).
The relation between new cancers and a high SAF was analyzed by Cox regression analysis, adjusted for age, gender, BMI, history of smoking, AER and estimated GFR, as depicted in table 3. A high SAF predicted a 2.57- fold higher risk of cancer (95% CI 1.28 to 5.19, p=0.008) after these adjustments. As a continuous variable, the SAF was also related to new cancers (OR 1.05, 95% CI 1.01 to 1.10, p=0.045).
These analyses were repeated after excluding the eight new cancer cases that occurred during the first 4 years of follow- up to reduce the possibility of reverse causality. A high SAF predicted an adjusted 2.95- fold higher long- term risk of cancer (95% CI 1.36 to 6.38, p=0.006). As a continuous variable, the SAF was also related to new cancers after 4 years (OR 1.07, 95% CI 1.01 to 1.13, p=0.016).
SAF and new cancers according to gender
The SAFs did not differ according to gender, neither in participants who did not develop a new cancer: 2.62±0.63 AU for men vs 2.62±0.60 for women, nor in those who developed a cancer: 2.82±0.71 AU for men (n=33) vs 2.90±0.75 for women (n=12). Adjusted for age, high SAF (>2.6 AU) was related to new cancers in men (OR 2.39, 95% CI 1.05 to 5.45), which did not reach significance for women, who were less represented (OR 1.72, 95% CI 0.51 to 5.76).
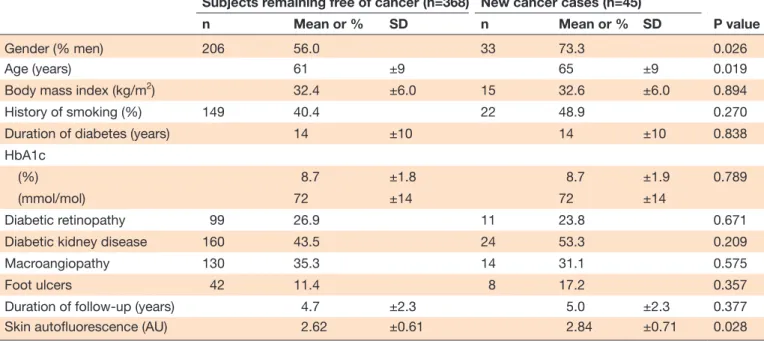
Table 1 Characteristics of the population and new cancer cases (n=413)
Subjects remaining free of cancer (n=368) New cancer cases (n=45)
P value
n Mean or % SD n Mean or % SD
Gender (% men) 206 56.0 33 73.3 0.026
Age (years) 61 ±9 65 ±9 0.019
Body mass index (kg/m2) 32.4 ±6.0 15 32.6 ±6.0 0.894
History of smoking (%) 149 40.4 22 48.9 0.270
Duration of diabetes (years) 14 ±10 14 ±10 0.838
HbA1c
(%) 8.7 ±1.8 8.7 ±1.9 0.789
(mmol/mol) 72 ±14 72 ±14
Diabetic retinopathy 99 26.9 11 23.8 0.671
Diabetic kidney disease 160 43.5 24 53.3 0.209
Macroangiopathy 130 35.3 14 31.1 0.575
Foot ulcers 42 11.4 8 17.2 0.357
Duration of follow- up (years) 4.7 ±2.3 5.0 ±2.3 0.377
Skin autofluorescence (AU) 2.62 ±0.61 2.84 ±0.71 0.028
P value=univariate logistic regression.
AU, arbitrary unit; HbA1c, glycated hemoglobin.
Table 2 Determinants of the skin autofluorescence, by multivariate regression analysis
ß P value
Age (years) +0.185 0.001
Estimated glomerular filtration
rate (mL/min/1.73 m2) −0.258 0.0001
History of smoking +0.130 0.004
Duration of diabetes (years) +0.106 0.023
on April 20, 2021 by guest. Protected by copyright.
Pathophysiology/complications
DISCUSSION
During a 4.8 years of follow- up, we registered 45 new cancer cases among 413 subjects with type 2 diabetes, initially free of any cancer. The subjects who developed a cancer were older, 73% were men, they did not differ from the others in their initial BMI, duration of diabetes, HbA1c, nor in the prevalence of the vascular complica-tions of diabetes. Their initial SAF was higher, and 75% of
cancers occurred in subjects with higher than the median autofluorescence. By Cox regression analysis, a high SAF was associated with a 2.5- fold higher risk of cancer, adjusted for age, gender, BMI, history of smoking, and renal parameters.
AGEs and cancer
This relation provides a new clinical argument for the role of AGEs in cancer. AGEs generated during years of chronic hyperglycemia are an important molecular basis for metabolic memory.7 Chronic hyperglycemia can
epigenetically modify gene expression profiles in cells, and these changes may persist after return to normo-glycemic conditions.6 This ‘hyperglycemic memory’
phenomenon may occur and participate in the acquisi-tion of a cancerous phenotype in these cancer cells. The SAF values, calculated by dividing the mean emitted light intensity by the mean reflected excitation light inten-sity from the skin, with an AGE Reader, do not directly measure the AGE content in tissues, but correlate to the concentrations of AGEs in skin biopsies.12 Numerous
biological studies suggest that AGEs accumulated in tissues favor cancer,8–10 and some clinical reports also
argue for their role: high concentrations of AGEs in the serum have been related to later breast17 and rectal
cancers,18 but these serum concentrations must be
distin-guished from the concentrations of AGEs in tissues, where these tissue AGEs directly exert their biological
Figure 2 Cancer- free survival curves according to skin autofluorescence (sAF). AU, arbitrary unit.
Table 3 The relation between a high skin autofluorescence (>2.60 AU) and new cancer cases, by Cox regression analysis (n=45)
OR 95% CI P value
Gender (male) 1.98 0.95 to 4.12 0.067
Age (years) 1.06 1.01 to 1.11 0.006
Body mass index (kg/m2) 1.00 0.95 to 1.05 0.91
History of smoking 1.33 0.71 to 2.50 0.36
Albumin excretion rate
(mg/24 hours) 1.00 1.00 to 1.00 0.32 Estimated glomerular filtration rate (mL/ min/1.73 m2) 1.00 0.99 to 1.02 0.32 High skin autofluorescence (>2.6 AU) 2.57 1.28 to 5.19 0.008
AU, arbitrary unit.
on April 20, 2021 by guest. Protected by copyright.
http://drc.bmj.com/
effects. The AGE- RAGE axis is probably more activated in tissues when AGEs are not bound to soluble RAGE (s- RAGE), and s- RAGE is reduced before some digestive cancers,19 conditioned by variants of the RAGE gene.20
The relation between the SAF and skin cancer has already been reported in the specific context of organ transplant recipients, considered as a reflect of photodamage.21
Only four of our subjects developed a skin cancer, and the accumulation of AGEs seems a much more plausible mechanism for the development of solid cancers deeper than skin cancers, in the context of diabetes. Hypergly-cemia and glycation lead to the production of AGEs and increase RAGE signaling, suspected to be involved in the development and spread of cancers. The expression of RAGE and AGEs appears to be proportional to malig-nancy and metastatic potential of cancers. The activation of this AGE- RAGE signaling pathway has been suggested as a biomarker in the prediction of cancer predisposi-tion.22 This AGEs/RAGE interaction may be reflected by
SAF.23
Chronic hyperglycemia and cancer
The high risk of cancer in subjects with type 2 diabetes is not shared by their siblings and spouses, which suggests that it relates to the disease by itself, rather than to genetic or environmental factors.24 Our new cancer cases
did not occur in persons with higher diabetes duration, higher HbA1c, nor more diabetic vascular complications. More cancer cases occurred in the standard versus inten-sive treatment arms of trials of glucose control: 380 vs 357 in the randomized controlled trials (RCTs) including participants with type 2 diabetes,25 14 vs 7 in the Diabetes
Control and Complications Trial (DCCT)/Epidemiology of Diabetes Interventions and Complications study for type 1 diabetes,26 but these differences were not
signif-icant. In the Swedish registry of type 2 diabetes, cancer was the second cause of death after cardiovascular causes, and death of any cause was more frequent with high HbA1c, but the relation between HbA1c and cancer was not reported.27 In the Swedish twin study, diabetes in
mid- life was associated to later cancers of the pharynx, small intestine and liver, with a dose- dependent relation to diabetes duration.28 The relation between SAF and
diabetes duration was significant in our population, but not with the HbA1c. Chronic hyperglycemia may there-fore not be the sole explanation for the higher SAF in our participants with type 2 diabetes who developed a cancer.
Other mechanisms relating SAF and cancer
The accumulation of AGEs can result from high input from exogenous sources. Although dietary AGEs exert biological effects,29 we are not aware of any report relating
them to cancer. The SAF is reduced in subjects who eat a Mediterranean diet,30 which may reduce the risk of
cancer.31 AGEs are present in tobacco, and smoking
relates to a high SAF,32 as we found. The relation between
SAF and cancer was however adjusted for smoking in our participants. The accumulation of AGEs in tissues
may also be due to their reduced removal, as proposed for chronic kidney diseases (CKD). The SAF was nega-tively related to the estimated GFR in our subjects, as previously reported,33 and it is known to be higher in
CKD, even non- diabetic.34 Diabetic kidney disease is not
thought to increase the risk of cancer35 but relations
with estimated GFR and proteinuria have been reported outside diabetic context.36 The relation between the SAF
and cancer persisted after adjustment for renal parame-ters in our subjects. The more specific removal of AGEs occurs through enzymatic degradation by the glyoxa-lase, the upregulation of this enzyme is hypothesized as a repair response to the high AGE precursor levels.37
Some variants of the RAGE gene have been related to s- RAGE levels and cancer susceptibility.20 A fast acetylator
genotype has been related to a lower skin fluorescence in two cohorts (DCCT and LifeLines cohort study).38
We can therefore speculate that the accumulation of AGEs driven from chronic hyperglycemia may differ according to the genetic background, with an increased risk of cancer when this accumulation prolongs with age and diabetes duration. SAF can increase with age.39 40
In our study, the SAF was related to the age by multivar-iate regression analysis. However, the relation between new cancers and a high SAF remained significant after adjustment for age. Furthermore, in our study, BMI was 32.4±6.0 kg/m² for subjects remaining free of cancer and 32.6±6.0 kg/m² for subjects with cancer, without significa-tive difference between the two groups. Due to a relation between BMI and SAF suggested by a recent study41 and
the implication of BMI in type 2 diabetes and in cancer,42
an adjustment for BMI was performed, and the relation between SAF and new cancer case remained significant after adjustment.
Practical implications
The relation with the SAF suggests routes for the preven-tion of cancer in persons with diabetes, with possible practical implications. As it increases with age, it does not seem possible to reduce the SAF that measures AGE cross- linking in the skin, but we can aim to slow down its progression, and to reduce the circulating levels of AGEs. Glucose control may help, as relations between the SAF and the HbA1c have been reported,15 mainly for HbA1c
from previous years.13 14 However, in type 2 diabetes, the
progression of SAF weakly relates to the HbA1c,43 and
intensively treated participants with type 2 diabetes did not reduce their mortality from cancer during RCTs.25
It would be interesting to know whether a change in the incidence of cancer appeared in the post- trial periods, as reported for mortality.44 In persons with type 1 diabetes,
we have reported that the progression of SAF was more pronounced if diabetic nephropathy was present, and less pronounced under treatment with continuous subcutaneous insulin infusion, which suggests that reducing glucose variability may help.45
Nephroprotec-tion can be another track, if the high autofluorescence in CKD predicts cancer, which remains to be determined.
on April 20, 2021 by guest. Protected by copyright.
Pathophysiology/complications
We have reported that SAF quickly increases during an acute renal failure.46 Acute kidney injuries predict major
cardiovascular events in type 2 diabetes,47 but we do not
know whether they may predict cancer. Smoking cessa-tion and a healthy diet are probably useful. Because the measurement of SAF is simple, non- invasive, quick and cheap, it may help to select subjects for early cancer screening as far as possible for some localizations: colon, liver, skin.3
Limitations
SAF is not a direct measurement of AGE and it may be influenced by other fluorophores in the skin; neverthe-less, SAF does correlate with pentosidine, a common AGE, in skin biopsies. Our population only included subjects with type 2 diabetes, and further work will be required to search whether our data may apply to the general cancer population. Our record of new cancer cases was limited to those that were registered in the medical files of our institution. We registered only one breast cancer, and it seems probable that some women developed a breast cancer, were treated in another hospital and lost of our sight. The incidence of cancer was however high in our subjects: 22/1000 person- years, in the high range of previous reports: 7–28/1000 person- years,25 so we probably did not miss many cases. We do not have reliable information about metformin use among our participants, whereas it may reduce cancer risk in type 2 diabetes.48 Metformin may block early glyca-tion reacglyca-tion and alter the AGE- RAGE axis.49 However, the SAF does not seem to differ in patients treated compared with not treated by metformin.50 Although the SAFs were higher among the 12 women who developed a cancer, they did not significantly differ from the other 162 women. Further work will however be required if we want to determine whether the relation with autofluores-cence differs according to gender, and to the localization of cancer, which also needs more cases.
CONCLUSION
In summary, our study shows that a high SAF predicts 2.5- fold more new cancers during the years after its measure-ment in subjects with type 2 diabetes. This argues for the role of accumulated AGEs in tissues, and glucose memory, in the increased risk of cancer in type 2 diabetes, which should not be solely attributed to obesity and hyperinsu-linemia. Lifestyle changes (healthy diet, smoking cessa-tion), nephroprotection and glucose control may help reduce the accumulation of AGEs and the risk of cancer. The simple and non- invasive measurement of the SAF may help select subjects in cancer screening programs.
Contributors NF is the corresponding author, researched the data and wrote the manuscript. AL, MR, MM, MLe, ACD, CD, MLi and QB researched the data and reviewed the manuscript. KM, LBB and PP reviewed the manuscript. VR researched the data and wrote the manuscript.
Funding The authors have not declared a specific grant for this research from any funding agency in the public, commercial or not- for- profit sectors.
Competing interests None declared. Patient consent for publication Not required.
Ethics approval All the participants gave an informed consent to participate in the study, which was approved by the Comité de Protection des Personnes Sud- Ouest et Outre- Mer III (DC 2014/102).
Provenance and peer review Not commissioned; externally peer reviewed. Data availability statement Data are available upon reasonable request. All data relevant to the study are included in the article. Deidentified participant data of patients of the Diabetology Unit, Hospital Bordeaux, France. VR (0000-0002-5175-6479 ORCID) is the guarantor of the work.
Open access This is an open access article distributed in accordance with the Creative Commons Attribution Non Commercial (CC BY- NC 4.0) license, which permits others to distribute, remix, adapt, build upon this work non- commercially, and license their derivative works on different terms, provided the original work is properly cited, appropriate credit is given, any changes made indicated, and the use is non- commercial. See: http:// creativecommons. org/ licenses/ by- nc/ 4. 0/. ORCID iDs
Ninon Foussard http:// orcid. org/ 0000- 0003- 1317- 5662 Alice Larroumet http:// orcid. org/ 0000- 0002- 0416- 9175 Marie Monlun http:// orcid. org/ 0000- 0002- 2376- 2935 Anne- Claire Devouge http:// orcid. org/ 0000- 0003- 2335- 4648
REFERENCES
1 Vigneri P, Frasca F, Sciacca L, et al. Diabetes and cancer. Endocr Relat Cancer 2009;16:1103–23.
2 Giovannucci E, Harlan DM, Archer MC. Gapstur Sm, and al. diabetes and cancer: a consensus report. Cancer Journal for Clinicians 2010;60:207–21.
3 Handelsman Y, LeRoith D, Bloomgarden Z, et al. Einhorn D, and al. diabetes and Cancer—An AACE/ACE consensus statement. Endocrine Practice 2013;19:675–93.
4 Sona MF, Myung S- K, Park K, et al. Type 1 diabetes mellitus and risk of cancer: a meta- analysis of observational studies. Jpn J Clin Oncol 2018;48:426–33.
5 Vander Heiden MG, Cantley LC, Thompson CB. Understanding the Warburg effect: the metabolic requirements of cell proliferation. Science 2009;324:1029–33.
6 Park J, Sarode VR, Euhus D, et al. Neuregulin 1- HER axis as a key mediator of hyperglycemic memory effects in breast cancer. Proc Natl Acad Sci U S A 2012;109:21058–63.
7 Testa R, Bonfigli AR, Prattichizzo F, et al. The “metabolic memory” theory and the early treatment of hyperglycemia in prevention of diabetic complications. Nutrients 2017;9:437.
8 Bellier J, Nokin M- J, Lardé E, et al. Methylglyoxal, a potent inducer of ages, connects between diabetes and cancer. Diabetes Res Clin Pract 2019;148:200–11.
9 Menini S, Iacobini C, de Latouliere L. The advanced glycation end- product Nϵ -carboxymethyllysine promotes progression of pancreatic cancer: implications for diabetes- associated risk and its prevention: AGEs as a diabetes- related risk factor for pancreatic cancer. J Pathol 2018;245:197–208.
10 Rojas A, Añazco C, González I, et al. Extracellular matrix glycation and receptor for advanced glycation end- products activation: a missing piece in the puzzle of the association between diabetes and cancer. Carcinogenesis 2018;39:515–21.
11 Turner DP. Advanced glycation end- products: a biological
consequence of lifestyle contributing to cancer disparity. Cancer Res 2015;75:1925–9.
12 Meerwaldt R, Graaff R, Oomen PHN, et al. Simple non- invasive assessment of advanced glycation endproduct accumulation. Diabetologia 2004;47:1324–30.
13 Rajaobelina K, Cougnard- Gregoire A, Delcourt C, et al.
Autofluorescence of skin advanced glycation end products: marker of metabolic memory in elderly population. J Gerontol A Biol Sci Med Sci 2015;70:841–6.
14 Gerrits EG, Lutgers HL, Kleefstra N, et al. Skin autofluorescence: a tool to identify type 2 diabetic patients at risk for developing microvascular complications. Diabetes Care 2008;31:517–21. 15 Meerwaldt R, Lutgers HL, Links TP, et al. Skin autofluorescence is
a strong predictor of cardiac mortality in diabetes. Diabetes Care 2007;30:107–12.
16 Da Moura Semedo C, Webb M'Balu, Waller H, et al. Skin autofluorescence, a non- invasive marker of advanced glycation
on April 20, 2021 by guest. Protected by copyright.
http://drc.bmj.com/
end products: clinical relevance and limitations. Postgrad Med J 2017;93:289–94.
17 Walter KR, Ford ME, Gregoski MJ, et al. Advanced glycation end products are elevated in estrogen receptor- positive breast cancer patients, alter response to therapy, and can be targeted by lifestyle intervention. Breast Cancer Res Treat 2019;173:559–71.
18 Kong SY, Takeuchi M, Hyogo H, et al. The association between Glyceraldehyde- Derived advanced glycation end- products and colorectal cancer risk. Cancer Epidemiol Biomarkers Prev 2015;24:1855–63.
19 Chen L, Duan Z, Tinker L, et al. A prospective study of soluble receptor for advanced glycation end- products and colorectal cancer risk in postmenopausal women. Cancer Epidemiol 2016;42:115–23. 20 Huang Q, Mi J, Wang X, et al. Genetically lowered concentrations
of circulating sRAGE might cause an increased risk of cancer: meta- analysis using Mendelian randomization. J Int Med Res 2016;44:179–91.
21 Togsverd- Bo K, Philipsen PA, Hædersdal M, et al. Skin autofluorescence reflects individual seasonal UV exposure, skin photodamage and skin cancer development in organ transplant recipients. J Photochem Photobiol B 2018;178:577–83.
22 Palanissami G, Paul SFD. Rage and its ligands: molecular interplay between glycation, inflammation, and hallmarks of Cancer—a review. Horm Canc 2018;9:295–325.
23 krha J, oupal J, Loni Ekali G. Kalousová M, and al. skin
autofluorescence relates to soluble receptor for advanced glycation end- products and albuminuria in diabetes mellitus. Journal of Diabetes Research 2013;2013:1–7.
24 Liu X, Hemminki K, Försti A, et al. Cancer risk in patients with type 2 diabetes mellitus and their relatives: type 2 diabetes mellitus and cancer. Int J Cancer 2015;137:903–10.
25 Johnson JA, Bowker SL. Intensive glycaemic control and cancer risk in type 2 diabetes: a meta- analysis of major trials. Diabetologia 2011;54:25–31.
26 Orchard TJ, Nathan DM, Zinman B, et al. Association between 7 years of intensive treatment of type 1 diabetes and long- term mortality. JAMA 2015;313:45.
27 Tancredi M, Rosengren A, Svensson A- M, et al. Excess mortality among persons with type 2 diabetes. N Engl J Med 2015;373:1720–32.
28 Bao C, Pedersen NL, Yang R, et al. Diabetes in midlife and risk of cancer in late life: a nationwide Swedish twin study: midlife diabetes and later life cancer risk in twins. Int J Cancer 2018;143:793–800. 29 Clarke RE, Dordevic AL, Tan SM, et al. Dietary advanced glycation
end products and risk factors for chronic disease: a systematic review of randomised controlled trials. Nutrients 2016;8:125. 30 Sánchez E, Betriu Àngels, Salas- Salvadó J, et al. Mediterranean
diet, physical activity and subcutaneous advanced glycation end- products' accumulation: a cross- sectional analysis in the ILERVAS project. Eur J Nutr 2020;59:1233–42.
31 Mentella MC, Scaldaferri F, Ricci C, et al. Cancer and Mediterranean diet: a review. Nutrients 2019;11:2059.
32 van Waateringe RP, Mook- Kanamori MJ, Slagter SN, et al. The association between various smoking behaviors, cotinine biomarkers and skin autofluorescence, a marker for advanced glycation end product accumulation. PLoS One 2017;12:e0179330.
33 Rigalleau V, Cougnard- Gregoire A, Nov S, et al. Association of advanced glycation end products and chronic kidney disease with
macroangiopathy in type 2 diabetes. J Diabetes Complications 2015;29:270–4.
34 Fraser SDS, Roderick PJ, McIntyre NJ, et al. Skin autofluorescence and all- cause mortality in stage 3 CKD. CJASN 2014;9:1361–8. 35 Wong G, Zoungas S, Lo S, et al. The risk of cancer in people
with diabetes and chronic kidney disease. Nephrology Dialysis Transplantation 2012;27:3337–44.
36 Mok Y, Matsushita K, Ballew SH, et al. Kidney Function, Proteinuria, and Cancer Incidence: The Korean Heart Study. American Journal of Kidney Diseases 2017;70:512–21.
37 Rabbani N, Xue M, Weickert MO, et al. Multiple roles of glyoxalase 1- mediated suppression of methylglyoxal glycation in cancer biology—Involvement in tumour suppression, tumour growth, multidrug resistance and target for chemotherapy. Semin Cancer Biol 2018;49:83–93.
38 Eny KM, Lutgers HL, Maynard J, et al. Gwas identifies an NAT2 acetylator status tag single nucleotide polymorphism to be a major locus for skin fluorescence. Diabetologia 2014;57:1623–34. 39 Semba RD, Nicklett EJ, Ferrucci L. Does accumulation of advanced
glycation end products contribute to the aging phenotype? J Gerontol A Biol Sci Med Sci 2010;65:963–75.
40 Koetsier M, Lutgers HL, de Jonge C, et al. Smit AJ, and al. reference values of skin autofluorescence. Diabetes Technology & Therapeutics. may 2010;12:399–403.
41 Sánchez E, Baena- Fustegueras JA, de la Fuente MC, et al. Advanced glycation end- products in morbid obesity and after bariatric surgery: when glycemic memory starts to fail. Endocrinología, Diabetes y Nutrición 2017;64:4–10.
42 Bjørge T, Häggström C, Ghaderi S, et al. Bmi and weight changes and risk of obesity- related cancers: a pooled European cohort study. Int J Epidemiol 2019;48:1872–85.
43 Gerrits EG, Lutgers HL, Kleefstra N, et al. Skin advanced glycation end product accumulation is poorly reflected by glycemic control in type 2 diabetic patients (ZODIAC-9). J Diabetes Sci Technol 2008;2:572–7.
44 Holman RR, Paul SK, Bethel MA, et al. 10- Year follow- up of intensive glucose control in type 2 diabetes. N Engl J Med 2008;359:1577–89.
45 Rajaobelina K, Helmer C, Vélayoudom- Céphise F- L, et al. Progression of skin autofluorescence of AGEs over 4 years in patients with type 1 diabetes. Diabetes Metab Res Rev 2017;33:e2917.
46 Lavielle A, Rubin S, Boyer A, et al. Skin autofluorescence in acute kidney injury. Crit Care 2017;21:24.
47 Monseu M, Gand E, Saulnier P- J, et al. Acute kidney injury predicts major adverse outcomes in diabetes: synergic impact with low glomerular filtration rate and albuminuria. Diabetes Care 2015;38:2333–40.
48 Zhang K, Bai P, Dai H, et al. Metformin and risk of cancer among patients with type 2 diabetes mellitus: a systematic review and meta- analysis. Prim Care Diabetes 2021;15:52–8.
49 Adeshara KA, Bangar NS, Doshi PR, et al. Action of metformin therapy against advanced glycation, oxidative stress and
inflammation in type 2 diabetes patients: 3 months follow- up study. Diabetes Metab Syndr 2020;14:1449–58.
50 Krul- Poel YHM, Agca R, Lips P, et al. Vitamin D status is associated with skin autofluorescence in patients with type 2 diabetes mellitus: a preliminary report. Cardiovasc Diabetol 2015;14:89.
on April 20, 2021 by guest. Protected by copyright.