HAL Id: hal-01237249
https://hal.inria.fr/hal-01237249
Submitted on 2 Dec 2015
HAL is a multi-disciplinary open access
archive for the deposit and dissemination of
sci-entific research documents, whether they are
pub-lished or not. The documents may come from
teaching and research institutions in France or
abroad, or from public or private research centers.
L’archive ouverte pluridisciplinaire HAL, est
destinée au dépôt et à la diffusion de documents
scientifiques de niveau recherche, publiés ou non,
émanant des établissements d’enseignement et de
recherche français ou étrangers, des laboratoires
publics ou privés.
A texture-based pixel labeling approach for historical
books
Maroua Mehri, Petra Gomez-Krämer, Pierre Héroux, Alain Boucher, Rémy
Mullot
To cite this version:
Maroua Mehri, Petra Gomez-Krämer, Pierre Héroux, Alain Boucher, Rémy Mullot. A texture-based
pixel labeling approach for historical books. Pattern Analysis and Applications, Springer Verlag, 2015,
pp.1-40. �10.1007/s10044-015-0451-9�. �hal-01237249�
Pattern Analysis and Applications manuscript No. (will be inserted by the editor)
A Texture-based Pixel Labeling Approach for Historical Books
Maroua Mehri · Petra Gomez-Kr¨amer ·Pierre H´eroux · Alain Boucher · R´emy Mullot
Received: date / Accepted: date
Abstract Over the last few years, there has been tremendous growth in the automatic processing of digitized historical documents. In fact, finding reliable systems for the interpretation of ancient documents has been a topic of major interest for many libraries and the prime issue of research in the document analysis community. One important challenge is to refine well-known approaches based on strong a priori knowledge (e.g. the document image content, layout, typography, font size and type, scanning resolution, image size, etc.). Nevertheless, a texture analysis approach has consistently been chosen to segment a page layout when information is lacking on document structure and content. Thus, in this article a framework is proposed to investigate the use of texture as a tool for automatically determining homogeneous regions in a digitized historical book and segmenting its contents by extracting and analyzing texture features independently of the layout of the pages. The proposed framework is parameter-free and applicable to a large variety of ancient of books. It does not assume a priori information regarding document image content and structure. It consists of two phases: a texture-based feature extraction step and unsupervised clustering and labeling task based on the consensus clustering, hierarchical ascendant classification, and nearest neighbor search algorithms. The novelty of this work lies in the clustering of extracted texture descriptors to find automatically homogeneous regions, i.e. graphic and textual regions, by using the clustering approach on an entire book instead of processing each page individually. Our framework has been evaluated on a large variety of historical books and achieved promising results.
Keywords Digitized historical books · Pixel labeling · Texture · Autocorrelation · Multiresolution · Purity per block
1 Introduction
The development of the Internet and electronic publishing, the prospects offered by the standardization of documen-tary techniques and broadcast media, and increased storage capacity and transmission rates, raise questions and pose specific challenges concerning the preservation and reproduction of historical collections. Thus, in order to guaran-tee a lasting preservation of historical collections and to provide a world-wide access to material which needs to be protected from too frequent handling, libraries have conducted large digitization programs with cultural heritage documents. The European1and American2Ministries of Culture support digitization programs and encourage the development of digital libraries which offer new services such as on-line consulting of ancient documents, fragile Maroua Mehri · Petra Gomez-Kr¨amer · Alain Boucher · R´emy Mullot
L3I, University of La Rochelle, Avenue Michel Cr´epeau, 17042, La Rochelle, France Tel.: +33-5 46 45 82 62
Fax: +33-5 46 45 82 42
E-mail: {maroua.mehri, petra.gomez, alain.boucher, remy.mullot}@univ-lr.fr Pierre H´eroux
LITIS, University of Rouen, Avenue de l’Universit´e, 76800, Saint-Etienne-du-Rouvray, France Tel.: +33-2 32 95 50 11
Fax: +33-2 32 95 50 22
E-mail: [email protected]
1 http://www.culture.gouv.fr/culture/mrt/numerisation/ 2 http://www.archives.gov/digitization/
books and rare collections, information retrieval, etc. Thus, new technologies have revolutionized the world of librarianship and printing [1]. Numerous research projects, such as HisDoc3, DocExplore4, Europeana5, DEBORA6, BAMBI7, MADONNE8, NaviDoMass9, Passe-Partout10and GRAPHEM11are looking at the digitization of Euro-pean and American ancient heritage resources. The French digital library Gallica12, the British library13and the John F. Kennedy library14, have been established for the purpose of preserving and exploiting this cultural heritage. For instance, the European project DEBORA aims to develop networked libraries by improving accessibility to the 16thcentury books of Italy, France and Portugal [2, 3]. One of the aims of DocExplore is to construct a document analysis framework which provides computer-based access and analysis of historical manuscripts. The aim of the HisDoc project is to design generic processing approaches and tools for historical manuscripts which are independent of the scripting language [4]. The goal of the MADONNE project is to develop a toolkit that can be used to index heritage documents and categorize book pages [5]. A project on indexing handwritten historical manuscripts15has been developed by Rath et al. and supported by the “Center for Intelligent Information Retrieval” at the University of Massachusetts Amherst16and the National Science Foundation17[6]. They are using a part of the George Washington collection18at the library of Congress19to evaluate their technique.
However, a lack of comprehensive and strategic management tools has become an obstacle to optimizing the exploitation of heritage documents. There has been an increase in special needs for information retrieval in digital libraries and document layout analysis [7–9]. Le Bourgeois et al. highlighted the need to design “intelligent” digitizers which can limit manual intervention and perform easy and high quality digitization of document images [2]. Therefore, with the support of the ANR (French National Research Agency20) and the collaboration of many research laboratories, we are working on a project named DIGIDOC (Document Image diGitisation with Interactive DescriptiOn Capability)21. Specifically, the aim of the DIGIDOC project is to develop new ways of interacting with scanners and new tools for analyzing documents throughout the acquisition process, from scanning the document to knowledge representation and management of the digitized ancient document content.
Thus, to achieve better interaction with scanners, we need to design a computer-aided categorization tool, able to classify digitized book pages according to several criteria, mainly the layout structure or typographic characteristics of their content. For this purpose, we propose to characterize digitized pages of ancient books with a set of regions of homogeneous texture and their topological relationships that helps modeling the layout structure, separating text from non-text regions, partitioning or categorizing pre-localized text blocks into columns, headings, paragraphs, lines, words, notes (head-notes and foot-notes) and abstracts, etc. Our goal is to extract as automatically as possible textural features that segment an ancient book or a collection of historical documents into spatially disjoint homogeneous regions or similar content regions and characterize its content according to a topological representation of homogenous regions, without formulating a hypothesis concerning the document structure or layout (e.g. column layout) or the typographical parameters (e.g. font size and type) of the document. By characterizing each digitized page of ancient book with a set of regions of homogeneous texture and their topological relationships, a model or a signature can be designed for each book page. The obtained signatures help deducing the similarities of book page structure or layout and/or content. Indeed, the structure and content of book pages can be compared and subsequently the designed signatures which model structure and content book pages
3 https://diuf.unifr.ch/main/hisdoc/ 4 http://www.docexplore.eu 5 http://www.europeana.eu 6 http://cordis.europa.eu/libraries/en/projects/debora.html 7 http://www.ilc.cnr.it/viewpage.php/sez=ricerca/id=97/vers=ing 8 http://madonne.univ-lr.fr 9 http://navidomass.univ-lr.fr 10 http://www3.unil.ch/BCUTodai/app/todaiGetIntro.do?uri=todaiInfo&page=todaiLogo.html 11 http://liris.cnrs.fr/graphem/ 12 http://gallica.bnf.fr 13 http://www.bl.uk 14 http://www.jfklibrary.org/ 15 http://ciir.cs.umass.edu/irdemo/hw-demo/ 16 http://ciir.cs.umass.edu/ 17 http://www.nsf.gov/ 18 http://memory.loc.gov/ammem/gwhtml/gwhome.html 19 http://www.loc.gov/ 20 http://www.agence-nationale-recherche.fr/en/
21 The DIGIDOC project is referenced under ANR − 10 −CORD − 0020. For more details, http://www.agence-nationale-recherche. fr/en/anr-funded-project/?tx_lwmsuivibilan_pi2[CODE]=ANR-10-CORD-0020
can be classified according to their structure and content. Thus, book pages with similar structure/layout or/and content can be classified or grouped. Figure 1 provides an overview of the objectives of this work.
Page 1 Page 23 Si m ila r Signature 1 Signature 23 Book
Fig. 1: Overview of the objectives of this work.
Recently, the issues of document image analysis have been considered as texture segmentation and classification [10]. Moreover, some similarities of document content type have been deduced from many book pages [11, 12]. In addition, based on the assumption that texture can characterize a document content type which is usually repeated on many pages of the same book, we propose a framework that works on entire book scale instead of processing each page individually. Thus, in this article by combining several points related to texture-based segmentation that have been reported separately in the literature particularly on synthetic, medical and natural images, we attempt to represent a book page using a set of homogeneous blocks defined by similar texture attributes and their topology. Indeed, a pixel labeling framework for digitized historical books is proposed in this article. The proposed framework ensures the pixel-based characterization of the content of an entire book by extracting and analyzing the texture information from each page. It is automatic, parameter-free and can be adapted to all kinds of books. It is independent of document layout, typeface, font size, orientation, image size, digitizing resolution and intensity, etc. It is also insensitive to noise. Moreover, it does not require any manual inspection or a priori knowledge regarding document image content and structure or layout.
The originality of our contribution lies in the automatic analysis of some characteristics of book pages (regarding their content and/or layout) to find homogeneous regions (i.e. graphic and textual regions) by extracting and clustering texture features on an entire book instead of processing each page individually, with no assumption concerning the book page structure or layout (e.g. column layout) or the typographical or graphical properties (e.g. font size and type) of the digitized book pages. Indeed, even if the typographical or graphical features are not known in advance, they can be captured by exploiting the regularities of the associated textures through the whole book pages. So, in a first step, a clustering of texture features which are extracted from a subsampling in the entire book aims at identifying the texture information that is present in book pages. The clustering method that is applied has the ability to automatically determine the number of clusters or homogeneous regions. This knowledge is then used in a second step to segment each book page individually.
The remainder of this article is structured as follows: Section 2 reviews related works on historical document segmentation. This section also gives an insight to texture-based image segmentation methods, their use in the context of historical document image segmentation, and clustering approaches when the number of clusters is not known in advance. In Section 3, the proposed framework for the characterization of the content of an entire book by extracting and analyzing the texture information from each page is described. In Section 4, we outline the experimental protocol by describing the experimental corpus, the defined ground truth and the used clustering and classification metrics for an evaluation of accuracy. To evaluate the performance of the proposed framework,
several clustering and classification metrics are computed and discussed in Section 5. Qualitative results are also given to demonstrate its performance. Our conclusions and future work are presented in Section 6.
2 Related works
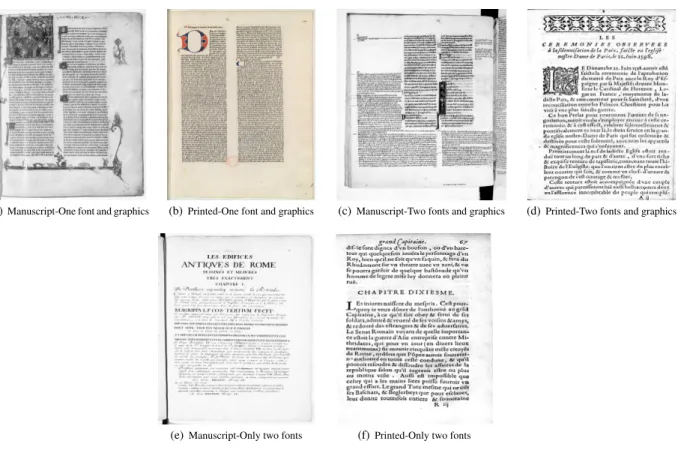
Historical documents have many particularities such as a large variability of the page layout: noise and degradation (caused by copying, scanning and aging), page skew, complicated layout, random alignment, specific fonts, the presence of embellishments, variations in spacing between the characters, words, lines, paragraphs and margins, overlapping object boundaries, and the superimposition of information layers (stamps, handwritten notes, noise, back-to-front interference, etc.) [9, 13]. Figure 2 illustrates some particularities of historical documents.
Fig. 2: Illustration of some particularities of historical documents (e.g. superimposition of information layers (stamps, handwritten notes, noise, back-to-front interference, etc.), page skew etc.)
Thus, processing this kind of document is not a straightforward task and usually includes several stages: pre-processing, analysis, characterization and recognition [14]. A variety of approaches based on a priori knowledge of segmentation of ancient documents have been proposed in the literature.
In the context of the Philectre project, Andr´e et al. extracted drop caps (i.e. the first letters at the beginning of a paragraph) and text regions from the foreground layer of the analyzed document using edge detection for dark regions (i.e. low mean gray level) followed by a thresholding phase that takes into account the local and global adjacent neighboring pixels [15]. Secondly, they used a vertical and horizontal projection phase based on a few thresholds (average height and line spacing) and specified rules for the extraction of columns and lines. Finally, they performed a connected-component labeling based on a defined projection interval. This approach was based on a knowledge-acquisition phase to determine the relevant characteristics of a sample set of historical documents. A well-researched survey dedicated to text line segmentation of historical documents was presented by Likforman-Sulem et al. [16]. Most of the existing approaches are based on connectivity features, projection (XY-CUT) [17], Run Length Smearing Algorithm (RLSA) [18] and Hough techniques [19] which are suitable for clear lines. These approaches require thresholds to define inter-line or inter-block distances and adjustments for character alignment and line justification. In addition, a pre-processing phase is necessary to remove background noise (superfluous information appearing from the verso) and non-textual regions. Bela¨ıd and Ouwayed proposed a multi-oriented text line extraction approach of ancient Arabic documents based on image meshing technique,
energy distribution of Cohen’s class and connected component analysis techniques [20]. They defined a few rules depending on the orientations presented in their documents. Nikolaou et al. proposed adaptive RLSA and skeleton segmentation paths for text line, word and character segmentation of historical and degraded machine-printed documents [21]. Although the proposed algorithm worked efficiently for a wide variety of degraded documents, they defined several thresholds in the used segmentation techniques.
Without a given model of the layout for medieval manuscripts, Le Bourgeois et al. proposed a data-driven layout segmentation approach based on connected components [2]. Their method required several parameters, estimated thresholds determined by the user and stored in the model, and also required several pre-processing steps: a binarization step, an image noise reduction filter and the frame removal task based on mathematical morphology [22–24]. To localize the main body of the text from Arabic manuscripts, they also estimated the average size of text symbols by computing the average size of all connected components. Then, they computed a text probability value for each connected component. Finally, they estimated an automatic threshold for each profile (horizontal and vertical) obtained from the entire image. They considered their algorithm to be a useful tool to detect the main body of a text, even for Latin manuscripts, but it did not work with large annotation areas in the margins.
Likforman-Sulem presented an overview of different approaches used with ancient documents to separate text and graphic regions [14]. For instance, Granado et al. extracted text and graphic regions from ancient books using mathematical morphology [23]. In the case of medieval documents, an accurate morphological analysis of connected components was investigated to separate text/non-text regions [15]. Mengucci and Granado presented a mathematical morphology approach for the segmentation of figures/text characters from pages of Renaissance books (16thcentury) [25]. These approaches require a selection of morphological parameters and filter thresholds (e.g. directional closings, size of the structuring element, etc.) based on given heuristics (e.g. size and appearance of connected components).
Le Bourgeois and Emptoz, as part of the European project DEBORA, analyzed and segmented ancient books using morphology, texture and a bottom-up model [2, 3]. They succeeded in segmenting the physical layout except for some errors, which appeared when there were lines of text that were touching, due to a lack of a priori knowledge and the highly complex layout of the document. They separated text from non-text regions by combining texture, component shapes and alignments. The recognition of drop caps and strips was based on a a priori model designed using information about size, location, surrounding neighborhoods, etc. Ramel et al. evaluated various traditional methods used for segmentation of historical printed documents [26]. They highlighted the limits of the traditional methods to segment historical documents. Thus, they proposed a hybrid segmentation algorithm based on connected components for user-driven page layout analysis of historical printed books. The proposed algorithm used two maps: a shape map for foreground information analysis based on connected component technique and a background map for white area analysis. Then, the classification of the extracted blocks by using connected component analysis technique, was built according to scenarios defined by the user.
Therefore, based on strong a priori knowledge such as the repetitiveness of document structure in a corpus (i.e. the blocks shape, the uniformity in horizontal and/or vertical spacings, and/or the assumptions about textual and graphical characteristics such as font size, etc.), the existing approaches are not effective. In addition, there are certain limitations of these methods. Firstly, several parameters and thresholds must be adjusted. Secondly, those methods are sensitive to noise and not robust to slanted texts. The drawbacks of those approaches are their dependence on the font size, character space, character size, inter-character spacing, document orientation and line and column space, etc. Furthermore, the performance of this family of document structure analysis approaches depends on the particular layout and document idiosyncrasies. Finally, for complex and degraded historical document images, it is a difficult task to set empirical rules, domain specific constraints, and thresholds.
Hence, Crasson and Fekete highlighted the real need for automatic processing of digitized historical documents (document layout analysis and text/non-text separation) to facilitate the analysis and navigation in the corpus of ancient manuscripts [27]. Kise stated that the analysis of pages with constrained layouts (e.g. rectangular and Manhattan) and clean document images has almost been solved while the analysis of ancient documents is still an open problem due to their particularities (e.g. noise and degradation, presence of handwriting, overlapping layouts and great variability of the page layout, etc.). He also precised that the most relevant methods used to analyze pages with overlapping or unconstrained layouts are based on signal properties of page components by investigating texture-based features and techniques [28]. Thus, in this work we explore various aspects of the texture features in historical documents in order to assist the analysis of images by characterizing a document layout through a set of homogeneous regions. Given that there is significant degradation and with no hypothesis concerning the document structure/layout or the typographical parameters of the document, the use of texture analysis techniques for historical document segmentation has become an appropriate choice. In order to ensure a distinction between different text fonts and various kinds of graphics, two assumptions are made [29]. First, the textual regions in
a digitized document are considered as textured areas, while its non-text content is considered as regions with different textures. Secondly, text with a different font is also distinguishable.
In this work, essentially we address the problem of the analysis and characterization of historical documents. These phases specifically relate to two important tasks:
– The feature extraction methods assign to each analyzed image a visual signature that describes its content. – The feature space structuring methods partition the analyzed image into regions which have homogeneous
characteristics and similar properties with respect to the extracted features.
2.1 Feature extraction methods
The feature extraction and analysis techniques provide important information about similar and homogeneous content regions that ensure the characterization of the layout and the structure. Chen and Blostein claimed that the choice of document features depends on the document recognition stage and categorized them into three classes [30]:
– Image features are extracted from the analyzed image as a signature computed on the entire image and based on color, texture and/or shape.
– Structural features are deduced from a physical or logical layout analysis.
– Textual features are obtained from Optical Character Recognition (OCR) or from documents.
In this work, we are interested in the image features which are the most suitable for the segmentation of a historical page layout [31–33]. Image feature extraction approaches have been divided into three main types [34]: – Global approaches consider the analyzed image as a signature computed on the entire image and based on
color, texture and/or shape.
– Local approaches analyze local descriptors around different interest points detected on the analyzed image. – Spatial approaches represent regions and their neighboring relationships by a graph.
Below, the global approaches to feature extraction are detailed because they are the most suitable and widely used for the analysis of digitized historical documents [31–33]. Moreover, they are independent of topological information and the region stability of segmentation algorithms. In this context, a class of segmentation methods based on texture feature extraction and analysis has been proposed recently and is considered as an alternative for complex document structure analysis [35]. Segmentation methods based on texture analysis are pixel-based and do not require either a priori knowledge of the document layout or a priori information on the semantic and physical characteristics of the document category. These methods generally characterize documents with a complex layout in order to segment their content into homogeneous blocks based on extracted textural descriptors. In addition, they do not assume that information about the layout is available and they can be used with any kind of document (e.g. check, manuscript, printed document, journal, newspaper, etc.). A general definition of texture has been given as a measure of the variation in intensity, measuring properties such as smoothness, coarseness and regularity [36]. Texture has also been defined as a suitable measure for the analysis of the block contents of the physical layout [35]. Texture analysis methods have been used in image segmentation to extract textural characteristics.
Texture-based segmentation methods can be classified into two categories [37]:
– Region-based approaches are used to identify uniform, similar or homogeneous textured regions.
– Boundary-based approaches are used to analyze the differences in texture in adjacent or neighborhood sur-rounding regions.
Since our objective is to find regions with similar textural content, we opt for a region-based approach exploiting textural features. A variety of approaches for characterizing image texture have been proposed. Jain et al. demonstrated the effectiveness of a texture-based approach for different types of document image processing tasks (i.e. text-graphic separation, address-block location, etc.) [38]. Texture feature extraction and analysis methods is classified into four categories [39, 40]:
– Statistical methods are used to analyze the spatial distribution of gray levels by computing local indices in the image and deriving a set of statistics from the distribution of the local features. The Grey Level Co-occurrence Matrix (GLCM) is one of the standard statistical segmentation methods that are based on texture analysis [41]. – Geometrical methods are used to describe intricate patterns, and to retrieve and describe texture primitives. Texture primitives may be extracted using a difference-of-Gaussian filter, for example [42]. These methods attempt to characterize the primitives and find rules governing their spatial organization.
– Model-based methods are used to compute a parametric generative model based on the intensity distribution of texture primitives. A widely used class of probabilistic models is: Conditional Random Fields (CRF) [43], Markov Random Fields (MRF) [44], Gaussian Markov Random Fields (GMRF) [45], fractals [46] and Local Binary Patterns (LBP) [47], etc.
– Frequency methods are used to investigate the overall frequency content of an analyzed image. The most widely used frequency methods are Gabor filters [38, 48], Fourier transform [49], wavelet transform [49, 50] and moment-based texture segmentation [51].
Some approaches are used to investigate the local properties of an analyzed image (e.g. GMRF, LBP, etc.). Other methods are based on statistical and/or spatial and/or frequency representations (e.g. wavelet transform, Gabor filters, etc.).
During the last two decades, several studies have sought to characterize and index ancient documents using their content to explore textural analysis [31, 32, 52, 53]. Some studies looked at the whole ancient document [31], while others examined graphic images such as drop caps [52]. Uttama et al. introduced a drop cap segmentation method [52]. The proposed method was based on a combination of different texture analysis approaches (e.g. GLCM [41] and the autocorrelation function [54, 55], etc.). Others developed texture-based feature extraction algorithms that were designed for the analysis of historical documents such as the ancient document image characterization approach proposed by Journet et al. [31]. The computed texture features were based on the autocorrelation function and frequencies. This method provided good information on the principal orientations and periodicities of the texture and could characterize the content of images without making assumptions about the image structure or its properties.
The use of the autocorrelation function is not new in the document analysis community. Numerous studies have identified a number of autocorrelation features for segmenting ancient and contemporary documents images [31, 32, 53, 56–59]. Autocorrelation results have been used to construct a rose of directions [60]. Eglin et al. determined the number of Gabor filters by selecting relevant directions, deduced from the rose of directions, in order to select interesting patterns for noise reduction and classification of handwritings in ancient manuscripts [56]. For old document analysis, Journet et al. defined three autocorrelation features which some descriptors were derived from the rose of directions. The extracted features computed over the neighborhood of each pixel (foreground and background), were as follows: the main orientation of the rose of directions, the intensity value of the autocorrelation function for the main orientation and the variance in the intensities of the rose of directions, except for the main orientation [31]. Grana et al. used the autocorrelation matrix to distinguish between textual and pictorial regions in historical manuscripts [58]. Garz and Sablatnig presented a multi-scale texture-based approach for text region recognition in ancient manuscripts [57]. They extracted the three autocorrelation features proposed by Journet et al. [31] by applying three scales by means of overlapping sliding windows. Then, they introduced shifted copies of the proposed textural features proposed by Journet et al. [31] such that the main orientation is at 0◦to ensure the comparison of different roses of directions and the invariance to skewed text lines. Ouji et al. introduced two other texture attributes, also in relation to the autocorrelation function: the mean stroke width and height of an image for contemporary document image segmentation [59].
Texture feature extraction is designed to represent document content through a set of descriptive features that are computed or extracted. There have been a lot of texture analysis studies that use a variety of descriptors based on the statistical and spectral properties of texture. In principle, any texture-based method can be used to extract textural descriptors. Here, we extract texture features from the autocorrelation function for several reasons:
First, a comparative study on the choice of the texture feature category has been elaborated, which ensures the best, most constructive trade-off between best performance, reduced number of parameter settings and thresholds and lowest computation time [61,62]. For instance, the co-occurrence descriptors are statistics computed from the GLCM elements defined in a specified direction and separated by a particular distance. Texture feature methods based on GLCM feature analysis have been proposed in the literature to identify script and language from documents [63, 64]. One of the groups concluded that the GLCM features gave the worst overall performance for script identification [64]. The Gabor features are extracted using the multichannel 2-D Gabor filtering technique. A 2-D Gabor filter is a linear selective band-pass filter that is dependent on two parameters: spatial frequency and orientation. By extracting Gabor features, different studies have investigated to identify scripts, font-faces and font-styles [65, 66]. Jain et al. showed the effectiveness of using a multichannel Gabor filtering-based texture segmentation approach for the segmentation and classification of documents [67]. Despite the widespread application of Gabor filters to texture analysis, one of its most serious disadvantages is its high computational cost since it consists of convolving the whole document at each orientation and at each frequency [68].
Secondly, the extraction of the autocorrelation features requires less parameter settings compared to the descriptors computed from Gabor filters and GLCM. Indeed, with no hypothesis concerning the document layout or the typographical parameters of the document, the choice of appropriate thresholds and parameters is a very difficult task.
Finally, the high performance of segmentation experiments that are based on the autocorrelation function used on documents convinces us to work with autocorrelation features in order to reach our objective of determining homogeneous regions in an analyzed document with no hypothesis concerning the document layout or the typographical parameters of the document. The autocorrelation descriptors highlight interesting information on the principal orientations and periodicities of texture allowing characterizing the content of images without any assumption on the page structure and its characteristics. It has also been demonstrated that they work even for skewed images and handwritten text. In addition, they have been proved relevant and robust to noise, unconstrained document layouts and page skew [31, 32, 53, 56–59].
2.2 Feature space structuring methods
The partition task of the set of unlabeled data (obtained from the feature extraction phase) into groups or clusters is necessary to segment the analyzed image into regions which have homogeneous characteristics and similar properties with respect to the extracted features. This task is considered as a feature space structuring technique. Feature space structuring methods involve two phases:
– The clustering phase or unsupervised classification partitions a set of unlabeled data into homogeneous groups or clusters. Samples of each cluster share common characteristics, which usually correspond to proximity criteria, defined by introducing measures of distance between clusters and samples.
– The classification phase classifies a new object according to a set of predefined classes. Clustering algorithms can be classified into two categories:
– Hard clustering methods distribute data into different clusters, where each data point belongs to exactly one cluster.
– Fuzzy clustering methods consider that the allocation of data points to clusters is not binary, i.e. each data point may belong to more than one cluster with a set of membership levels. One of the most widely used fuzzy clustering algorithms is the Fuzzy C-Means algorithm (FCM) [69].
In this work, we are interested in the hard clustering algorithms since many parameters must be specified in the case of the fuzzy clustering methods. Several standard hard clustering methods have been proposed in the literature. Hard clustering methods are divided into five categories [70]:
– Partitioning methods (e.g. k-means clustering (k-means) [71], Partitioning Around Medoids (PAM) [72], CLustering LARge Applications (CLARA) [72], etc.) distribute the dataset according to the proximities of feature space deducted from the content of the analyzed image.
– Hierarchical methods (e.g. AGglomerative NESting (AGNES) [72], DIvisive ANAlysis clustering (DIANA) [72], Hierarchical Ascendant Classification (HAC) [73], etc.) are widely used data analysis tools that produce a hierarchy of clusters based on a measure of similarity between groups of data points.
– Density-based methods (e.g. DBSCAN [74], OPTICS [75], EM [76], etc.) are designed to reveal clusters of arbitrary shapes based on the local densities of a point set after introducing the appropriate values of the input parameters (neighborhood radius, etc.).
– Grid-based methods (e.g. STING [77], WaveCluster [78], etc.) quantize the space into a finite number of cells without taking into consideration data density and distribution, and then perform clustering operations (neighborhood cells, etc.) on the quantized space.
– Neural network-based methods (e.g. Self-Organizing Maps (SOM) [79], Feed-Forward Network (FFN) [80], etc.) partition data into similar subsets with the aid of an artificial neural network [81].
Nevertheless, for a certain class of hard clustering algorithms and conventional clustering techniques [82–85], the number of clusters in a dataset must be specified. Several types of methods can be used to estimate the correct number of clusters. A link-based cluster ensemble framework was used to select the correct number of clusters after evaluating the clustering results of a variety of functional methods based on both internal and external criteria [86]. Ray and Turi determined the number of clusters for color image segmentation in a clustering algorithm by finding the minimum of the intra-cluster and inter-cluster distance [87]. An approach to determine the cluster boundaries
in the hierarchical clustering based on within-class variance and between-class variance has been reported [88]. Another technique has been proposed for the analysis of changes in silhouette values [89] computed from clusters built by using k-means [71] and an optimization technique such as genetic algorithms [90]. Moreover, v-fold cross-validation applied to clustering [91], was performed for a range of numbers of clusters in k-means or EM clustering, then, depending on the average distance of the observations (in the cross-validation or testing samples) from their cluster centers (for k-means clustering), the number of clusters was estimated. Otherwise, by varying all combinations of the number of clusters, distance measures and clustering methods, the changes in various clustering evaluation indices can be examined [92]. Kryszczuk and Hurley proposed a framework for cluster number estimation based on decision-level fusion of multiple clustering validity indices [93]. They proved that no single clustering validity indice consistently outperformed others, particularly for high dimensional datasets. Bolshakova and Azuaje proposed a weighed voting technique based on three clustering algorithms and two cluster validation indices to improve the prediction of the number of clusters [94].
To better represent images and improve the performance of Content-Based Image Retrieval (CBIR), Yu et al.suggested to use a classical clustering approach (e.g. the k-means algorithm) as a pre-processing step, for image clustering [95]. Recently, clustering of personal album images has been investigated as an instance of application of image clustering [96]. Wang et al. proposed a Web-based annotation method flowed by a graph-based semi-supervised learning approach to provide firstly the conceptual labels to personal album image clusters and then to distribute the obtained conceptual labels from image clusters to the whole photo album WNHC12-CSUR. Yu et al. presented an adaptive hypergraph learning approach for transductive image classification framework [95]. The proposed approach provided a simultaneous learning of the labels of unlabeled images and the weights of hyperedges based on images and their nearest neighbors. Other graph-based manifold learning proposals have been suggested to improve image clustering and classification such as the Sparse Patch Alignment Framework (SPAF) [97] and High-order Distance-based Multiview Stochastic Learning (HD-MSL) [98]. However, the graph-based manifold learning technique has provided good results in extracting features for image classification, this way of using of the unsupervised/semi-supervised graph-based methods is beyond the scope of our work. Indeed, in the context of our work, we opt for a non-supervised texture analysis approach for meeting the need to segment a book page layout in the conditions of noise presence or significant document image degradation and in the context of lacking information on the document structure such as the document layout and the typographical parameters.
2.3 A short review of texture-based approaches for historical books
A few texture-based segmentation approaches used with historical documents have been developed. To our knowledge, the only non-supervised texture-based approach used with historical books was proposed by Journet et al.It was based on an unsupervised clustering technique using extracted texture features which were computed from six pages of the same book. To assign the same label to pixels of six book pages which share similar textural characteristics, the clustering was performed on all extracted texture features of pixels of six book pages [31]. They extracted two different kinds of texture descriptors for each pixel: three autocorrelation features which were derived from the rose of directions and two frequency attributes by using a multi-scale analysis for classifying historical document image pixels into text, graphics and background. The first frequency descriptor computes the ink/paper transitions obtained by performing the average per-line sum of the difference between the pixel intensity value and its left neighbor. The frequency second attribute calculates the white spaces obtained by performing the XY-CUT algorithm and computing the mean of the average per-line and per-column sums of pixel intensities over an analyzed area. Then, by using the CLustering LARge Applications (CLARA) [72], an unsupervised clustering algorithm, the extracted texture descriptors were clustered and pixels were separated into different content clusters. Moreover, the number of homogeneous regions was assumed to be known in advance. They noted 83% and 92% mean good classification rates for the graphical and text pixels, respectively with 180 minutes in total per document as time required to process a page (feature extraction and pixel clustering tasks) [99].
However the Journet et al.’s texture-based approach yielded good results on ancient documents containing several textural classes (e.g. text, graphics and background), one main disadvantage is that there is a need of user intervention for setting the number of expected clusters, as a consequent of using a classical unsupervised clustering [31]. Then, the most serious disadvantages of their approach is its high computational cost caused by the texture feature extraction step which was processed on all page pixels (i.e. the foreground and background pixels). Finally, to assign the same label to pixels of six book pages which shares similar textural characteristics, the clustering approach was only performed on six pages of the same book instead of all book pages, which can lead assigning
different labels to each resulting cluster of two different sets of six pages of the same book (characterizing by similar textural properties).
Thus, in this article a texture-based pixel labeling framework is proposed for the segmentation and char-acterization of digitized historical book content which addresses the challenges of the existing state-of-the-art methods.
3 Proposed framework
For the segmentation and characterization of digitized historical book content, our goal is to determine a region or group of pixels which share similar properties or characteristics on the basis of which they are grouped. These characteristics may be based on the localization of the pixels and their surroundings, color, intensity or texture. In this article, we will focus only on texture-based features. The use of a texture-based approach in our work has been shown to be effective with skewed and degraded images [100]. We propose a framework which automatically extracts texture descriptors and involves a multiresolution/multiscale approach. This approach can segment and characterize the content of digitized historical book. In particular, it can discriminate between the different classes of the foreground layers of a digitized document based on texture descriptors. The extraction of texture-based features helps to describe the document layout and structure by analyzing the texture feature space computed from digitized historical book content, i.e. by mapping the differences in the spatial structures of digitized documents into differences in gray value for each page. The texture features are automatically extracted from the analyzed document at several resolutions. The extracted features are then used in a parameter-free unsupervised clustering approach to determine the homogeneous regions that are defined by similar textural descriptors. The proposed framework is pixel-based and does not require a priori knowledge of the document structure/layout or the typographical parameters of the document. Moreover, the number of homogeneous or similar content regions do not need to be known in advance as it is determined automatically. Thus, this framework is automatic, parameter-free and applicable to a large variety of historical books. It is independent of document layout, typeface, font size, orientation, digitizing resolution, etc. Moreover, it does not require any manual inspection.
The originality of this framework lies in the texture feature analysis that is used to find homogeneous regions by utilizing a clustering approach on an entire book instead of processing each page individually. The proposed framework is supported by the fact that pages of the same book usually present strong similarities in the organization of the document information (i.e. the book page layout or structure), and in the graphical (e.g. embellishment, engraving or pictures) and typographical (e.g. font size and type) features throughout the digitized book pages. Indeed, the texture information (e.g. the typographical or graphical properties) which is often repeated and recurrently present in many book pages, can be deduced by exploiting the regularities of the associated textures through the whole book pages. Thus, a clustering step is performed on texture features which are extracted from a subsampling in the entire book aims at identifying these book characteristics which are then used to help to segment each page image.
The proposed framework starts with a texture feature extraction step. Secondly, a number of foreground pixels from pages of the same book are selected randomly and their textural descriptors are subsequently extracted in order to estimate the number of homogeneous or similar content regions in the book. The estimated number of homogeneous regions in our samples of foreground pixels is determined automatically (block 2, Figure 3). Finally, the textural features for each page are used in a clustering approach by taking into account the estimation of the number of homogeneous or similar content regions (block 1, Figure 3).
Figure 3 illustrates the four main tasks of the proposed framework. Block 2 on Figure 3 is used to estimate the number of homogeneous regions from the extracted textural features analyzed in the whole book. Block 1 on Figure 3 integrates an unsupervised task which automatically labels content pixels with the same cluster identifier as used with the book content in order to determine and characterize the homogeneous regions in the digitized book (block 3, Figure 3).
Figure 4 illustrates the detailed schematic block representation of the proposed framework. The proposed framework consists of the following three tasks:
1) Texture feature extraction (Section 3.1),
2) Estimation of the number of homogeneous regions (Section 3.2), 3) Pixel clustering and labeling (Section 3.3).
Fig. 3: Flowchart of the proposed pixel labeling framework of digitized historical book content.
Fig. 4: Detailed schematic block representation of the proposed pixel labeling framework of digitized historical book content.
3.1 Texture feature extraction
The first stage of the framework is to compute the texture features (Figure 3). Due to the drawbacks of approaches that are based on strong a priori knowledge, cited in Section 2, approaches based on texture feature extraction and analysis are more suitable for documents with a complex layout. In addition, it has been demonstrated that texture-based approaches work effectively with no hypothesis concerning the document layout (physical structure) or the typographical parameters (logical structure) of document structure [31, 32]. The aim of the feature extraction methods is to extract a set of features from the analyzed image to represent and characterize its content.
3.1.1 Foreground pixel selection
In order to reduce data cardinality and obtain a significant gain in computation time and memory, the autocorrelation descriptors are computed only on the selected foreground pixels. As an example, for a full historical page document (1965 × 2750 pixels), scanned at 300 dpi, the number of the selected foreground pixels is equal to 26086. Thus, the rate of the selected foreground pixels is over 2001 of a document image pixels. In this work, our goal is to have an overview of the page content by finding regions with similar textural content as easily, quickly and automatically as possible rather than a fine characterization. Additionally, the texture of the foreground is more interesting to categorize the type of document content.
The foreground pixel selection step is performed using a standard parameter-free binarization method, the Otsu method, to retrieve only those pixels representing information of the foreground (noise, text fields, graphics, etc.) [101]. However, using of the Otsu method is beyond the scope of our work, it has provided good results [64]. They used the Otsu method to segment and extract text regions from a document. Shijian and Tan binarized document images using the Otsu global thresholding method to retrieve character pixels and subsequently identify scripts and languages of noisy and degraded documents [102]. Several comparative studies of segmentation text/background or binarization methods for degraded historical documents have been reviewed [103, 104]. These studies do not agree on the best method and none has been shown to be perfect and suitable for historical documents, even local binarization approaches. Using a global thresholding approach, the Otsu method provides an adequate and fast means of binarization to retrieve only foreground pixels and extract texture features from only the selected foreground pixels.
3.1.2 Multiresolution analysis
The texture feature extraction is performed using analysis windows of varying sizes in order to adopt a multiresolu-tion/multiscale approach. The analysis window can be [37, 105]:
– Pixel-wise: each pixel is assigned to an analysis window, which ensures overlapping blocks or regions. – Block-wise: the analyzed document is partitioned into non-overlapping blocks.
The pixel-wise technique is chosen since it gives more reliable values and ensures more accurate determination of texture boundary, however it has a high demand in memory and computational time. Using a multiresolution approach in document image analysis [106–109] and pyramid methods in image processing [110, 111], rich information (e.g. for gray level distribution) can be produced since we can perceive differently textural characteristics at varying scales.
A multiresolution analysis was proposed by selecting concentric windows with different sizes in order to characterize the images drawn from historical documents using texture analysis [112]. Another example of the use of multiresolution analysis with ancient documents was proposed by Journet et al. who computed their textural features by varying the window sizes [31]. Mehri et al. extracted texture feature from the selected foreground pixels of the gray-level document images at four different sizes of sliding windows: (16 × 16), (32 × 32), (64 × 64) and (128 × 128) to adopt a multiscale approach [61]. In this article, the extraction of autocorrelation descriptors per block is performed at four different sizes of sliding windows: (16 × 16), (32 × 32), (64 × 64) and (128 × 128). 3.1.3 Autocorrelation descriptors
The autocorrelation function is particularly used with synthetic textural images. It is considered a similarity measure between a dataset and a shifted copy of the data and is used to find periodic patterns and characterize pattern similarity [54, 55]. In a digitized document, the textual and non-text regions (blank spaces, graphics and noise, etc.) have different textured areas [29]. The autocorrelation function RI(α,β )(x,y) is computed along the horizontal and vertical axes of the analysis window I of an image according to the following equation:
(1) RI(α,β )(x,y) =
∑
α ∈Ω∑
β ∈Ω I(x, y)I(x + α, y + β ) = FFT−1[FFT [I(x, y)] FFT∗[I(x, y)]]where I(x + α, y + β ) is the translation of the analysis window of an image I(x, y) by α and β pixels along the horizontal and vertical axes, respectively, defined on the plane Ω. FFT , (.)∗, and (.)−1denote the Fast Fourier Transform, complex conjugate, and inverse transform, respectively.
The rose of directions, which is a derivative of the autocorrelation function, is deduced from the autocorrelation function [60]. It is a polar diagram derived from the analysis of the autocorrelation results and reveals the significant orientations of the texture in the analyzed image block. It highlights interesting information concerning the principal orientations and periodicities of the texture, characterizing the content of images without any assumption about page structure and its characteristics. The rose of directions has recently been used with historical documents [31, 32, 53, 56, 57]. In order to identify the main orientation of the analyzed image, the rose of directions is computed for each orientation by summing up the different values of the autocorrelation function (equation (1)):
RI(x,y)(Θi) =
∑
DiRI(α,β )(x,y) (2)
where Θi∈ [0, 180] is the selected orientation of the set of possible orientations Di, which is represented by a straight line passing through (x, y) and the angle Θi. The rose of directions is normalized in one of the above studies in order to select only the relative variations of all contributions for each direction [31]. The relative sum R0(x,y)I (Θi) is defined as: R0(x,y)I (Θi) = RI(x,y)(Θi) − RImin RI max− RImin (3) where RImax6= RI
min, RIminand RImaxrepresent the minimum and maximum values of RI(x,y)(Θi), respectively, both of which are computed on the analysis window of an image I(x, y).
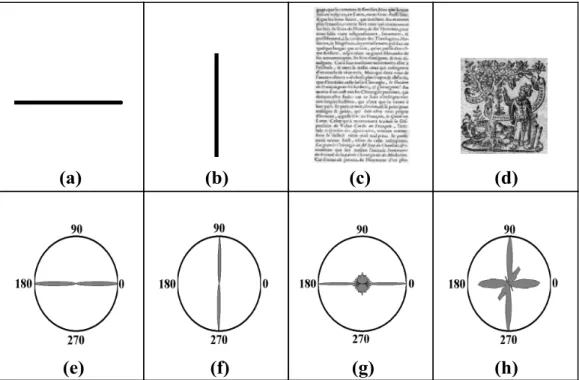
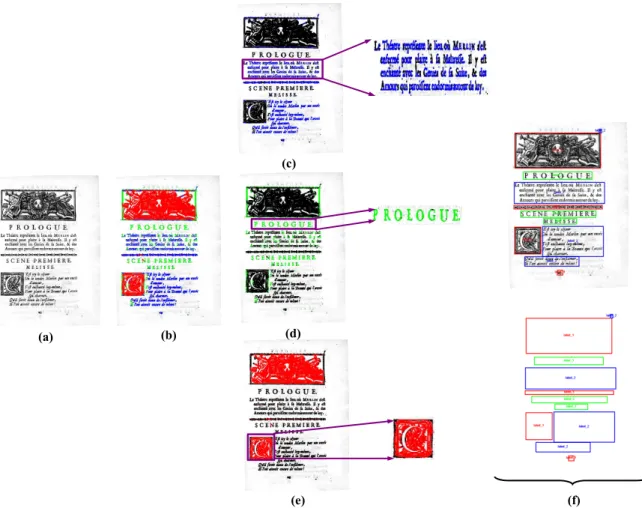
To illustrate the performance of the rose of directions in discriminating between textual and graphical regions in the document, and to determine the main orientation of a texture, Figure 5 shows the rose of directions obtained with four different textures. As can be seen, the shape of the rose is different for each type of texture. For textual regions such as (c), the shape of the rose depends on the orientation of the text and the main information. The horizontal orientation (0◦and 180◦) is clearly identifiable in (g). For drawing (d), the rose of directions (h) is deformed.
(f)
(e)
(g)
(h)
(a)
(b)
(c)
(d)
Fig. 5: Examples of the rose of directions. {(a),(b),(c),(d)} are the original images and {(e),(f),(g),(h)} their respective roses of directions.
The various forms and shapes of the rose of directions which are obtained from the variety of textures contained in ancient grayscale documents do not help us to define a template of the rose of directions for each type of texture. Nevertheless, computing the rose helps us to extract significant and relevant indices for texture features. Journet et
al.defined three texture features related to orientation in order to analyze the digitized document and to describe its content [31].
– Main angle of the rose of directions
The first texture feature F(x,y)(1) corresponds to the main angle of the rose of directions extracted from its maximal intensity (Figure 6(a)). It is normalized by the deviation from the horizontal angle in order to avoid handling circular data. It is given by:
F(x,y)(1) = 180 − argmax Θi∈[0,180] (R0(x,y)I (Θi)) (4)
– Intensity of the autocorrelation function for the main orientation
The second texture feature F(x,y)(2) corresponds to the intensity of the autocorrelation function for the main orientation (equation (4)), which is computed on the non-normalized value of the autocorrelation function (equation (2)). This feature evaluates the anisotropy of an image I(x, y) since the rose of directions associates the gray level of pixels in a specific direction. It is computed as:
F(x,y)(2) = RI(x,y)( argmax Θi∈[0,180]
(R0(x,y)I (Θi))) (5)
– Variance of the intensities of the rose of directions
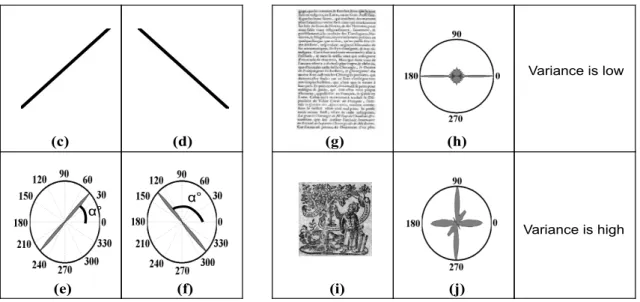
The third texture index F(x,y)(3) characterizes the overall shape of the rose. F(x,y)(3) is the variance of rose intensities, except for the orientation of maximal intensity. A low F(x,y)(3) means that the main orientation is significantly more prevalent than the other orientations. However, a high variance signifies that the rose is deformed and that there are a large number of orientations that are present to different extents (graphic blocks) (Figure 6(b)). Hence, the third texture descriptor is defined by:
F(x,y)(3) = σ2(R0(x,y)I (Θi)) (6)
where Θi∈ [0, 180] \{argmaxΘi∈[0,180](R 0I
(x,y)(Θi))} and σ represents the standard deviation estimator. The standard deviation estimator σ is computed as:
σ2= 1 n− 1 n
∑
i=1 (R0(x,y)I (Θi))2− n n− 1(µ) 2 (7)where µ and n are the mean value and the 179 orientation values, respectively.
In addition to the three texture features that are associated with the orientation of the autocorrelation function, we compute two other texture attributes which were first introduced by Ouji et al. [59] and seem to be relevant for contemporary documents and specifically with typographic characteristic characterization and chromatic/achromatic decomposition. The two texture descriptors are also related to the autocorrelation function through the mean stroke width and height of an image [59]. Ouji et al. computed these features in the horizontal and vertical directions [59]. Mehri et al. computed the mean stroke width and height along the axis of the main angle of the rose of directions to accurately estimate the main stroke thickness along specific directions [53]. In this article, the estimation of mean stroke width and height along specific directions is processed according to the work presented by Mehri et al. [53].
– Mean stroke width along specific directions
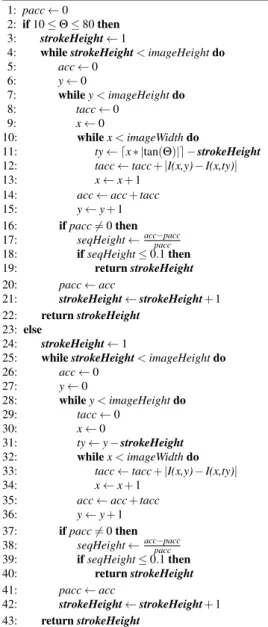
The next texture index corresponds to the estimation of mean stroke width along specific directions F(x,y)(4). It is deduced from a derivative of the autocorrelation function along the axis of the main angle of the rose of directions Θ (equation (4)) if Θ ∈ [10, 80] (equation (8)), otherwise the mean stroke width is estimated along the horizontal axis (equation (9)). If the growth rate of the sequence Swidth(equations (8) and (9)) is lower than 10%, we estimate the mean stroke width, otherwise we continue to compute the sequence Swidthuntil we reach the horizontal borders of the sliding window. Swidthis defined to be:
Swidth=
∑
Θ∈[10,80] |I(x, y) − TΘ (α,0)(I( y |tan(Θ)|, y))| (8)(f) (e)
(c) (d)
α° α°
(a) Main angle of the rose of directions.
(i) (j)
(g) (h)
Variance is low
Variance is high
(b) Variance of the intensities of the rose of directions.
Fig. 6: Examples of main angle and variance of intensities of the rose of directions. {(c),(d)} are the original images and {(e),(f)} are their rose of directions, respectively. The main orientation on the rose of directions corresponds to the direction of the information contained in the analyzed image. {(g),(i)} are the original images and {(h),(j)} are their rose of directions, respectively. The variance of intensities for the roses is high for graphic regions and low for text regions. Swidth=
∑
Θ∈[0,9]∪[81,180] |I(x, y) − TΘ (α,0)(I(x, y))| (9) where TΘ(α,0)(I(., .)) is the translation of the analysis window of an image I by α pixels along the axis of the main angle of the rose of directions Θ = F(x,y)(1) .
The estimation of mean stroke width along specific directions F(x,y)(4) is defined according to the algorithm 1. – Mean stroke height along specific directions
The computation of the last texture attribute is similar to that of the fourth texture index F(x,y)(4). F(x,y)(5) is an estimation of the mean stroke height computed along the axis of the main angle of the rose of directions Θ (equation (4)) if Θ ∈ [10, 80] (equation (10)), otherwise the mean stroke height is estimated along the vertical axis (equation (11)). If the growth rate of the sequence Sheight defined in equations (10) and (11) is lower than 10%, the mean stroke height is estimated, otherwise we continue to compute the sequence Sheightuntil we reach the vertical borders of the analyzed sliding window. Sheight is defined to be:
Sheight=
∑
Θ∈[10,80] |I(x, y) − TΘ (0,β )(I(x, x ∗ |tan(Θ)|))| (10) Sheight=∑
Θ∈[0,9]∪[81,180] |I(x, y) − TΘ (0,β )(I(x, y))| (11) where TΘ(0,β )(I(., .)) is the translation of the analysis window of an image I by β pixels along the axis of the main angle of the rose of directions Θ = F(x,y)(1) .
The estimation of mean stroke height along specific directions F(x,y)(5) is defined according to the algorithm 2. Figure 7 illustrates the mean stroke width and height differences of two fonts (normal and bold text characters) along the axis of the main angle of the rose of directions.
Algorithm 1 Estimation of mean stroke width along specific directions 1: pacc ← 0
2: if 10 ≤ Θ ≤ 80 then 3: strokeWidth ← 1
4: while strokeWidth < imageWidth do
5: acc← 0 6: y← 0 7: while y < imageHeight do 8: tacc← 0 9: x← 0 10: tx←l|tan(Θ)|y m− strokeWidth 11: while x < imageWidth do 12: tacc← tacc + |I(x,y) − I(tx,y)|
13: x← x + 1
14: acc← acc + tacc
15: y← y + 1
16: if pacc 6= 0 then 17: seqWidth←acc−paccpacc 18: if seqWidth ≤ 0.1 then 19: return strokeWidth 20: pacc← acc 21: strokeWidth ← strokeWidth + 1 22: return strokeWidth 23: else 24: strokeWidth ← 1
25: while strokeWidth < imageWidth do
26: acc← 0 27: y← 0 28: while y < imageHeight do 29: tacc← 0 30: x← 0 31: while x < imageWidth do 32: tx← x − strokeWidth 33: tacc← tacc + |I(x,y) − I(tx,y)|
34: x← x + 1
35: acc← acc + tacc
36: y← y + 1
37: if pacc 6= 0 then 38: seqWidth←acc−paccpacc 39: if seqWidth ≤ 0.1 then 40: return strokeWidth 41: pacc← acc 42: strokeWidth ← strokeWidth + 1 43: return strokeWidth
N
N
Width
α°
(a)
(b)
(c)
Height
Fig. 7: Estimation of the mean stroke width and height along specific directions. {(a),(b)} are the original images and (c) their rose of directions. (a) depicts a normal text character while (b) illustrates a bold text character. As the main orientation of the rose of directions is oblique (c), the mean stroke width and height are estimated along the oblique axis.
Algorithm 2 Estimation of mean stroke height along specific directions 1: pacc ← 0
2: if 10 ≤ Θ ≤ 80 then 3: strokeHeight ← 1
4: while strokeHeight < imageHeight do
5: acc← 0 6: y← 0 7: while y < imageHeight do 8: tacc← 0 9: x← 0 10: while x < imageWidth do 11: ty← dx ∗ |tan(Θ)|e − strokeHeight 12: tacc← tacc + |I(x,y) − I(x,ty)|
13: x← x + 1
14: acc← acc + tacc
15: y← y + 1 16: if pacc 6= 0 then 17: seqHeight←acc−pacc pacc 18: if seqHeight ≤ 0.1 then 19: return strokeHeight 20: pacc← acc 21: strokeHeight ← strokeHeight + 1 22: return strokeHeight 23: else 24: strokeHeight ← 1
25: while strokeHeight < imageHeight do
26: acc← 0 27: y← 0 28: while y < imageHeight do 29: tacc← 0 30: x← 0 31: ty← y − strokeHeight 32: while x < imageWidth do 33: tacc← tacc + |I(x,y) − I(x,ty)|
34: x← x + 1
35: acc← acc + tacc
36: y← y + 1
37: if pacc 6= 0 then 38: seqHeight←acc−paccpacc 39: if seqHeight ≤ 0.1 then 40: return strokeHeight 41: pacc← acc
42: strokeHeight ← strokeHeight + 1 43: return strokeHeight
3.1.4 Feature extraction process
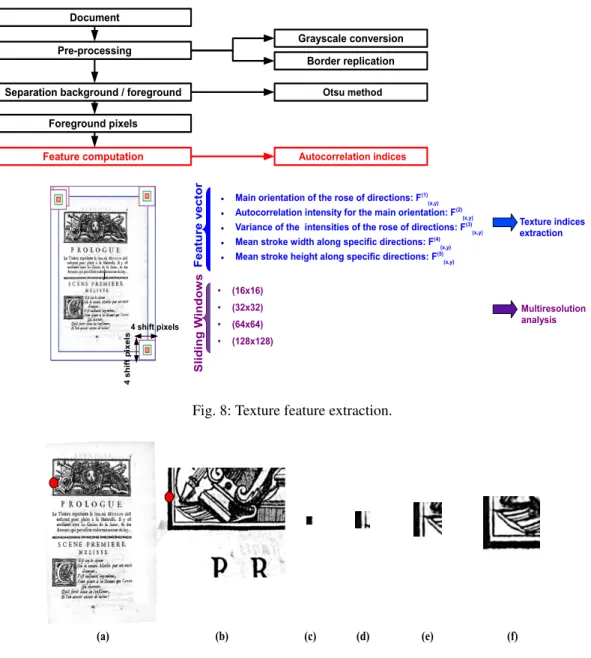
Extracting these autocorrelation indices using a sliding window gives a total of 20 features, i.e. 20 numerical values (5 texture indices × 4 sliding window sizes) which are computed for each selected foreground pixel from the digitized document. The extraction of the textural descriptors is performed on each grayscale document image. Figure 8 depicts the different pre-processing steps of the proposed step of texture feature extraction, based on the autocorrelation function and multiresolution analysis. The autocorrelation features are computed for analysis windows of different sizes in order to adopt a multiscale approach. The sliding window is shifted horizontally and vertically to scan the entire image. To deal with pixels at image borders when computing texture features on the whole image, a border replication step is used.
Figure 9 illustrates an example of four different sizes of sliding windows: (16 × 16), (32 × 32), (64 × 64) and (128 × 128), and shows that each window provides additional information on the textural properties.
The optimal size of each sliding window, respecting a constructive compromise between computation time and pixel labeling quality (reliable measurement and texture boundary), is determined experimentally. Computation time is highly dependent on the resolution, the size of the analyzed document and the number of foreground pixels retrieved. As an example, for a full historical page document (1965 × 2750 pixels), scanned at 300 dpi, it took
Document Pre-processing Feature computation Grayscale conversion Border replication j 4 s h if t p ix e ls 4 shift pixels S li d in g W in d o w s ● (16x16) ● (32x32) ● (64x64) ● (128x128) Otsu method
Separation background / foreground
F e a tu re v e c to r Autocorrelation indices Foreground pixels
● Main orientation of the rose of directions: F(1)
(x,y)
● Autocorrelation intensity for the main orientation: F(2)
(x,y)
● Variance of the intensities of the rose of directions: F(3)
(x,y)
● Mean stroke width along specific directions: F(4)
(x,y)
● Mean stroke height along specific directions: F(5)
(x,y)
Texture indices extraction
Multiresolution analysis
Fig. 8: Texture feature extraction.
(b) (c) (d) (e) (f)
(a)
Fig. 9: Example of four different sizes of sliding windows: (a) original image with a selected pixel position, (b) image zoom, (c) (16 × 16) window, (d) (32 × 32) window, (e) (64 × 64) window and (f) (128 × 128) window.
about 2 minutes to process the feature extraction. The experiment is run on a SGI Altix ICE 8200 cluster (1 CPU and 2 gigabytes allocated memory on a Quad-Core X [email protected] running Linux).
3.2 Estimation of the number of homogeneous regions
As already seen on the framework figure (Figure 3), our objective is to find homogeneous regions defined by similar texture features. So at this stage (block 2, Figure 3) we need to use a clustering algorithm to partition the analyzed document into regions with similar properties or characteristics as deduced from the analysis of the extracted texture features presented in Section 3.1.
Previous work identified a number of approaches for determining the correct number of clusters in a dataset [113]. Simpson et al. have recently proposed an effective method, known as Consensus Clustering (CC), to estimate the optimal number of clusters in biological data [114]. With the help of the CC technique, Mehri et al. estimated the number of clusters from a number of samples of foreground pixels to determine the number of homogeneous regions defined by similar autocorrelation indices in an ancient book [32]. Thus, we use the CC in this work to estimate the number of homogenous or similar content regions.
The CC consists of performing a consensus matrix by iterating multiple runs of clustering algorithms with random and re-sampled clustering options [115]. Thus, the consensus matrix analyzes the consistency of the clustering results from five different clustering algorithms: AGglomerative NESting (AGNES) [72], DIvisive ANAlysis clustering (DIANA) [72], Partitioning Around Medoids (PAM) [72], k-means clustering (k-means) [71] and Hierarchical Ascendant Classification (HAC) [73]. So, by weighting the different clustering methods in order to mitigate extremes in consensus values that could result from the sensitivity of some algorithms, a merge consensus matrix is performed which ensures the stability of the obtained clusters. Finally, the optimal number of clusters corresponds to the largest change in area under the cumulative density curve for the merge consensus matrix. It has been shown that hierarchical clustering methods are highly sensitive to outliers while partitioning methods are relatively insensitive. Simpson et al. therefore used a merged consensus clustering by applying a weighted averaging of the clustering results to estimate the number of clusters [114].
Thus, the number of clusters in a set of randomly selected foreground pixels is estimated from a few randomly selected pages of a book using the CC method. This method is only used for a set of randomly selected pixels of a few pages selected randomly from the same book. Due to memory constraints and long computational time of the CC method, we first test it on a set of 1000 and 2000 randomly selected pixels from 10 pages selected randomly from the same book.
Variations in clustering for both hierarchical clustering and partitioning methods can be taken into consideration by associating non-uniform weights. With this approach, prior information is introduced into the clustering process by assigning higher weights to the most robust clustering methods. Thus, by weighting different clustering methods, extremes are mitigated in consensus values that can be created by the sensitivity of some algorithms, meaning that outliers can be dealt with differently within datasets, thus improving the quality of classification. So a weight of 18is assigned to each hierarchical clustering method (AGNES, DIANA and HAC), and a higher weight of 14 is assigned to each partitioning clustering algorithm (PAM and k-means) [114]. By using this merge consensus clustering technique, the consensus matrices are the results deduced from clustering experiments using different algorithms and/or conditions. The merging of clustering results between different methods provides an averaged clustering robustness, i.e. a merge consensus matrix M. Hence, the optimal number of clusters kopt in a dataset can be estimated by finding the value of k computed from the merge consensus matrix M across a range [2, 10] of possible values of k. The Cumulative Density Function (CDF(c)) is computed on the unique elements of the merge consensus matrix M sorted in descending order and defined over the range c = [0, 1]. Thus, the CDF(c) is defined using equation (12).
CDF(c) =∑i< j1M(i, j)≤c Ns(Ns−1)
2
(12) where Nsis the number of selected observations or samples and1 is an indicator or a characteristic function defined on a set M(i, j) ≤ c.
The Area Under the Cumulative density curve (AUC) is then computed from the CDF (equation (12)) of the consensus matrix across a range [2, 10] of possible values of k using equation (13).
AUC=
m
∑
i=2[xi− xi−1]CDF(xi) (13)
where xiis the current element of the CDF and m is the number of elements [114].
Finally, the optimal number of clusters koptcorresponds to the largest change ∆k in the AUC (equation (13)).
3.3 Pixel clustering and labeling
Since the feature extraction phase and the estimation of the optimal number of homogeneous kopttask have been performed, we need to characterize the content of an entire book and find the kopthomogeneous regions defined by similar texture indices in a whole book. The goal of the third task of the proposed framework (block 1, Figure 3) is to structure the texture feature space within a hierarchical or partitioning clustering technique in order to group pixels sharing similar characteristics to identify and characterize similar regions or groups of pixels.
3.3.1 Pixel clustering
In this work, we opt for a standard and reliable hard clustering algorithm, given its optimal trade-off between low complexity, accuracy of the results, reduced number of parameter settings and the requirement for a clustering