Publisher’s version / Version de l'éditeur:
Vous avez des questions? Nous pouvons vous aider. Pour communiquer directement avec un auteur, consultez la première page de la revue dans laquelle son article a été publié afin de trouver ses coordonnées. Si vous n’arrivez pas à les repérer, communiquez avec nous à [email protected].
Questions? Contact the NRC Publications Archive team at
[email protected]. If you wish to email the authors directly, please see the first page of the publication for their contact information.
https://publications-cnrc.canada.ca/fra/droits
L’accès à ce site Web et l’utilisation de son contenu sont assujettis aux conditions présentées dans le site LISEZ CES CONDITIONS ATTENTIVEMENT AVANT D’UTILISER CE SITE WEB.
IESNA Annual Conference [Proceedings], pp. 19-41, 2004-07-01
READ THESE TERMS AND CONDITIONS CAREFULLY BEFORE USING THIS WEBSITE. https://nrc-publications.canada.ca/eng/copyright
NRC Publications Archive Record / Notice des Archives des publications du CNRC :
https://nrc-publications.canada.ca/eng/view/object/?id=cd994959-9433-4994-b443-0661f92a1817 https://publications-cnrc.canada.ca/fra/voir/objet/?id=cd994959-9433-4994-b443-0661f92a1817
Archives des publications du CNRC
This publication could be one of several versions: author’s original, accepted manuscript or the publisher’s version. / La version de cette publication peut être l’une des suivantes : la version prépublication de l’auteur, la version acceptée du manuscrit ou la version de l’éditeur.
Access and use of this website and the material on it are subject to the Terms and Conditions set forth at
Effect of dimming control on office worker satisfaction and
performance
Effect of dimming control on office worker satisfaction and
performance
Newsham, G.; Veitch, J.; Arsenault, C.;
Duval, C.
NRCC-47069
A version of this document is published in / Une version de ce document se trouve dans :
IESNA Annual Conference Proceedings, Tampa, Florida, July 25-28, 2004, pp. 19-41
Guy Newsham, Jennifer Veitch, Chantal Arsenault, Cara Duval Institute for Research in Construction, M24
National Research Council Canada Ottawa, ON, K1A 0R6
Tel: (613) 993-9607; Fax: (613) 954-3733 [email protected]
ABSTRACT
This experiment was conducted in a mock-up office-space laboratory. One hundred and eighteen participants worked for a single day under one of four lighting designs. They had no control over the lighting until the latter half of the afternoon, when all participants were offered some form of individual dimming lighting control. During the working day participants performed a variety of simulated office tasks, as well as completing a number of questionnaires on topics such as mood, satisfaction, and discomfort.
Results related to questionnaire outcomes were consistent and convincing. After lighting control was offered there were significant improvements in mood, room appraisal, lighting satisfaction, glare dissatisfaction, environmental satisfaction, satisfaction with performance, self-assessed productivity, and visual discomfort. Further, our results suggest that it is not control in itself that is important, but exercising control to achieve preferred conditions. Participants who made the biggest changes to lighting conditions after they were given control tended to register the biggest improvements in mood, satisfaction and discomfort outcomes; those who made little change registered no improvements in outcomes.
Task performance results were more equivocal. On many tasks, performance did significantly improve after control was introduced, but we attribute these improvements primarily to known practice effects. We recommend field studies over the longer term to test whether mood and satisfaction effects persist, and whether performance effects emerge.
1. INTRODUCTION
Surveys consistently indicate that building occupants both desire more control over their environment, including lighting, and believe that such control is linked to important health and performance outcomes. A survey of office workers [Steelcase, 1999] showed that three out of four people wanted more control over their lighting, and that half wanted dimming control. Further, a large majority of workers believed that improved lighting would improve their mood and efficiency. Similarly, questionnaire data from UK office buildings suggests that the more control of their environment people perceive they have, the more productive they think they are [Bordass et al., 1993].
Several recent field and laboratory studies have demonstrated that individual lighting control is associated with satisfaction benefits and energy savings. Maniccia et al. [1999] conducted a field study collecting data from 58 individual offices with dimming control in a single building. Lighting energy savings between 7 and 23% were attributed to the manual lighting controls. Occupants reported that the primary reason for adjusting light levels was to match the lighting to the task. Jennings et al. [2000] also conducted a field study in a large office building. Manual controls were available in two forms: bi-level switching of a 3-lamp fixture, or continuous dimming. Lighting energy savings of 23% and 28% were attributed to the two manual control options, respectively. Again, there was a wide range of preferences for lighting conditions. Moore et al. [1999] studied use of individual lighting controls in 11 UK office buildings. Again, preferences for lighting levels varied widely between individuals, and average lighting power use was between 10 and 70% compared to the maximum installed load. A study in French office buildings with manual controls [Escuyer & Fontoynont, 2001] reinforced the above findings. Preferences for
light levels varied, individuals often chose light levels according to tasks, and manual dimming was reported as being a desirable control feature.
Boyce et al. [2000] conducted a study in mock-up individual offices with three lighting designs: a typical fixed system of ceiling-recessed parabolic fixtures delivering 490 lx on the desktop; identical dimmable fixtures with maximum desktop illuminance of 680 lx; and a greater number of identical dimmable fixtures with maximum desktop illuminance of 1240 lx. In the case of the lower output dimmable system, the mean preferred illuminance was about 10% lower than for the fixed system, translating into energy savings. Individual preferences for light level varied over a wide range, and individuals tended to change their light levels according to the tasks they were doing. Offices with control had higher ratings of lighting quality and comfort, and tasks were rated as less difficult in rooms with controls.
In a recent field experiment, Boyce, Veitch et al. [2003] exposed over 250 people to one of six different lighting conditions for a full day in an open-plan office space constructed on one floor of a real office building. Two of the six conditions had some form of manual control. In one condition, experienced by 33 people, occupants had three-level switching control over a desk lamp, while ambient lighting from direct/indirect luminaires was fixed. In another condition, experienced by 56 people, occupants had dimming control over the down portion of a
direct/indirect luminaire suspended over the middle of their workstation. Most people used their control only once, near the start of the day, to choose a preferred condition. People with dimming control were particularly satisfied with their ability to achieve desired conditions. For those with dimming control, the median desktop illuminance was lower than recommended practice, with concomitant energy savings. In addition, people with dimming control showed more sustained motivation over the workday, and improved performance on a measure of attention.
Veitch & Newsham [2000a] conducted a study in a mock-up open-plan office space in which participants had control over four lighting circuits. Overhead and perimeter parabolic fixtures and a partition-mounted indirect fixture were all independently dimmable, and an undershelf task light could be switched on or off. Forty-seven matched pairs of people participated, occupying the space for a day and completing various simulated office tasks and questionnaires. One of the pair got control of the lighting at the start of the day, with the other participant receiving the same lighting; no further control was permitted. At the end of the day the second participant used the dimmers to express their own preferred lighting conditions. Individual preferred light levels varied widely, but on average choices used 10-15% less power than that recommended by prevailing energy codes [Canadian Codes Centre, 1997].
Newsham & Veitch [2001] performed further post-hoc analyses on these data and concluded that it is not simply the availability of lighting control that is important to occupants, it is using it to create conditions that match the occupant’s personal preference. They examined data from participants who made their preferred lighting choice at the end of the day only. Participants whose daytime light levels were closest to their own preference had significantly better ratings of mood (pleasure), lighting satisfaction, and environmental satisfaction during the day.
The experiment described in this report was designed to further explore the benefits of individual lighting control in a controlled laboratory experiment. Specifically we designed the experiment to replicate the findings of Newsham & Veitch [2001], that matching conditions to personal
preferences produces benefits1. The experiment addressed several research questions: 1. What are occupants’ preferred luminous conditions?
2. What is the effect of getting lighting control on mood, satisfaction, and task performance? 3. What is the effect of working under non-preferred lighting conditions on mood,
satisfaction, and task performance?
1
A pilot study, which served to refine the design of the experiment in this paper, showed
significant improvements in satisfaction with lighting after the introduction of dimmer control over ambient lighting [Newsham et al., 2002].
This experiment had additional goals. It also had elements designed to address the effect of different lighting designs on mood, satisfaction, task performance and energy use, with particular regard to task lighting and systems that provide more choice in vertical luminance [Newsham et al., 2003; Newsham et al., 2004]. However, this paper will focus on the effects of individual dimming control; lighting design effects will be reported elsewhere.
2. METHODS & PROCEDURES 2.1 The Experimental Space
The experimental space was 7m x 4.9m (20’ x 16’) and 2.75m (9’) high, with a standard
suspended ceiling T-bar system. Within this space were two workstations approx. 2.7m x 2.9m (8’ 9” x 9’ 6”), and a corridor area (Figure 1). The workstations were formed using two of the outside walls of the room and two 1.7m (5’ 7”) height partition walls. Mirrors were installed across the width of each of the full-height walls, extending from the ceiling down to a depth of 0.45m (18”). These mirrors create a general feeling of a larger space, and effectively infinite ceiling. There was a control station external to the experimental space. The control station allowed override control of all lighting circuits, provided for data acquisition, and also housed the lighting switchgear. Table 1a describes the major surfaces in the space, and their reflectances.
2.2 The Lighting Designs
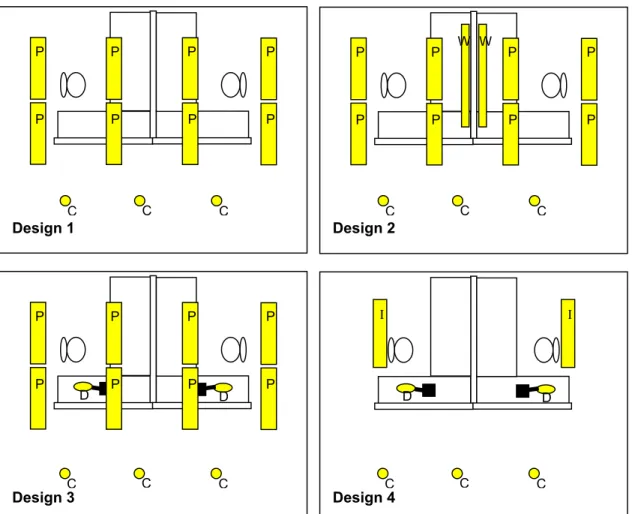
Four lighting designs were used in this experiment. Figure 2 shows a schematic layout for each design. Identical luminaires have the same letter code, and are described by this letter code in Table 1b below.
Table 1a. Description of the major surfaces in the experimental space, and their reflectances.
Surface Description Reflectance
Partitions Grey fabric 0.51
Walls Grey-painted gypsum 0.82
Desktop Grey plastic-coated steel 0.63
Carpet Grey carpet tile 0.15
Ceiling White gypsum tile 0.85
Table 1b. Description of the luminaires used.
Letter
Code Description
P 1’ x 4’ deep-cell parabolic louvre fixtures, recessed in the ceiling. 2 x 32W T8 lamps (3500K); Electronic dimming ballast (5-110%). I 10” x 4.5’ Direct/indirect fixtures, suspended 18” from the ceiling.
2 x 32W T8 lamps (3500K); Electronic dimming ballast (5-110%). W Partition washer: 3 x 2’, cantilevered from partition
1 x 17W T8 lamp each (3500K) + 50% neutral density filter Electronic dimming ballast (5-110%).
D Angle-arm task light; 1 x 18Wquad CFL (4100K) C Pot light for corridor area.
1 x 50W PAR 20 Halogen floodlight.
Each of the 4 lighting designs was set at one of 4 initial output conditions. For Designs 1, 2, and 3 we aimed to produce initial illuminance conditions at a representative point on the desktop (see Figure 3) of 200, 400, 600, and 800 lx. Design 4 was not capable of generating as much light on
the desktop as the other designs; in this case our aim was to generate equally-spaced conditions of 150, 200, 250 and 300 lx.
Figure 1. Photograph of experimental space from entrance.
C C C C Design 2 C Design 1 C P P W W P P P P P P P P P P P P P P D D Design 4 C C C I I Design 3 C C C P D P D P P P P P P
2.3 Participants
This project, involving human participants, was approved by our organization’s Research Ethics Board. Participants were recruited from a local temporary-employment agency. The agency pre-screened potential participants to ensure that they met the following criteria: minimum 18 years of age; normal or corrected-to-normal vision; normal hearing; no mobility impairments; experience with Windows™-based software; and, a minimum score on the agency’s word fluency test (to ensure that all participants were sufficiently fluent in English to complete the tasks). Participants were paid at their normal rate for a day’s work. Participants were randomly assigned, in gender-matched pairs, to lighting conditions.
Given the expected small to medium size effects with experimental manipulations of this kind, a power analysis suggested a target sample size of 96 (6 participants for each of the 4 initial conditions for each of the 4 lighting designs). In fact, complete data were collected from 118 participants. Participant characteristics, collected via an on-screen questionnaire, are shown in Appendix A.
2.4 Experimental Procedure
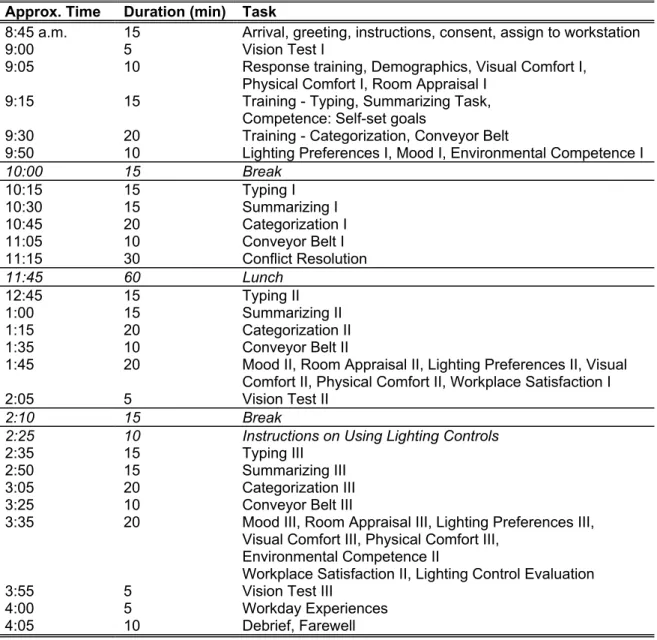
Table 2 shows the model experimental schedule followed with each participant, though the actual time spent on each task varied somewhat between participants because several aspects of the day (e.g. questionnaires, instruction screens) were not done in a fixed length of time. The morning coffee break was preceded by instructions, practice sessions for some performance tasks, the first administration of the Vision Test, as well as the first administration of some questionnaires. The rest of the day was divided into three parts (pre-lunch, pre-afternoon break, post-afternoon break) with similar repetitions of tasks. Excluding practices, most tasks and questionnaires were repeated at three times of day, therefore time-of-day was a three-level within-subject variable.
The participants were initially greeted by the experimenter and briefed on the experiment – note the experiment was described as being about office spaces in general, not specifically about lighting. Participants were able to make adjustments to their office chair and keyboard tray, but not to the computer screen brightness, tilt or position because of the effect of these choices on important visibility-related outcomes. Participants were also not allowed to adjust the position of luminaires (if applicable). For the remainder of the session the participant was guided by instructions presented on the computer screen.
When participants returned from an afternoon coffee break on-screen instructions informed them that they now had control over the lighting assigned to their workstation. In Design 1 this meant dimming control over the recessed parabolics (one circuit). In Design 2 this meant dimming control over the recessed parabolics (one circuit), and the partition washer (one circuit). In Design 3 this meant dimming control over the recessed parabolics (one circuit), and the ability to move the arm of the task light. In Design 4 this meant dimming control over the suspended direct/indirect fixture (one circuit), and the ability to move the arm of the task light. Instructions on how to use the on-screen dimming controls provided were given on the computer. On-screen dimmers were calibrated with the native response function of the ballasts to provide 15 – 99% of full light output with a linear response.
2.5 Simulated Office Tasks and Questionnaires
The tasks and questionnaires completed by the participants are described below:
Vision Test. We measured contrast sensitivity using custom software. A target grating was
presented on the computer screen, and the participant’s task was to indicate, as fast as they could, whether they saw a target or not by pressing a ‘Yes’ or ‘No’ key on the keyboard. The target was varied by foreground:background contrast, orientation (lines horizontal or vertical), and
size (width of the grating lines within the fixed-size target). We recorded both accuracy and speed of detection. This was the only task for which we controlled task-eye geometry.
Participants positioned their head in a chin cup, which was 40” (1.02m) from the ground, and 20” (0.51m) from the computer screen.
Table 2. Model experimental schedule for each participant. Note, Roman numerals indicate a repeat presentation of a task or questionnaire.
Approx. Time Duration (min) Task
8:45 a.m. 15 Arrival, greeting, instructions, consent, assign to workstation
9:00 5 Vision Test I
9:05 10 Response training, Demographics, Visual Comfort I, Physical Comfort I, Room Appraisal I
9:15 15 Training - Typing, Summarizing Task, Competence: Self-set goals
9:30 20 Training - Categorization, Conveyor Belt
9:50 10 Lighting Preferences I, Mood I, Environmental Competence I
10:00 15 Break 10:15 15 Typing I 10:30 15 Summarizing I 10:45 20 Categorization I 11:05 10 Conveyor Belt I 11:15 30 Conflict Resolution 11:45 60 Lunch 12:45 15 Typing II 1:00 15 Summarizing II 1:15 20 Categorization II 1:35 10 Conveyor Belt II
1:45 20 Mood II, Room Appraisal II, Lighting Preferences II, Visual Comfort II, Physical Comfort II, Workplace Satisfaction I
2:05 5 Vision Test II
2:10 15 Break
2:25 10 Instructions on Using Lighting Controls
2:35 15 Typing III
2:50 15 Summarizing III
3:05 20 Categorization III
3:25 10 Conveyor Belt III
3:35 20 Mood III, Room Appraisal III, Lighting Preferences III, Visual Comfort III, Physical Comfort III,
Environmental Competence II
Workplace Satisfaction II, Lighting Control Evaluation
3:55 5 Vision Test III
4:00 5 Workday Experiences
4:05 10 Debrief, Farewell
Visual and Physical Comfort. Visual comfort was measured using a modification of the scale
developed by Wibom & Carlsson [1987]. The original scale asks respondents to indicate both the frequency and the intensity with which they experience eight symptoms of eye discomfort
(smarting, itching, gritty feeling, aches, sensitivity to light, redness, teariness and dryness). Frequency (never, daily, weekly...) is meaningless to this one-day test, so we used only the intensity rating (between 0 and 4). Scores were the sum of intensity ratings for the eight
symptoms; thus, they could range from 0-32. Immediately after the visual comfort questionnaire, participants were asked to report musculoskeletal comfort and symptoms such as headache that might be associated with postural changes in relation to lighting conditions. This scale was used in previous lighting research [Veitch & Newsham, 2000a], and is based on other scales in the
human factors literature. Here too, scores were the sum of intensity ratings on scales from 0-4 for nine symptoms, giving a possible range from 0-36.
Simple Cognitive/Clerical Performance. This was assessed using a typing task scored for speed
and accuracy. In this task, participants retyped three ~300-word passages from printed originals. The three passages were presented in differing font sizes: 8, 12, and 16 point, while the on-screen font size was always 12 point. The software required participants to type the text correctly; speed and number of errors were automatically recorded. Participants were asked to place the paper on a document holder (not adjustable), which was at a fixed location on the desk close to the computer screen.
Complex Cognitive Performance. There were three measures of this construct. All were based
on short articles on popular topics broadcast in the popular media. The selected articles were 200-300 words long.
1. Article Categorisation. The participant saw a 40-60-word summary of a given article (the first 3 or 4 sentences), shown in 12-point font on screen. Below the article was a list of 4 categories into which the article might be placed. In half of the summaries some text was highlighted indicating a key phrase to aid categorisation. Dependent measures were the time required to perform the categorisation and accuracy of categorisation (correct responses were established by independent ratings from three researchers).
2. Summary Evaluations. Clicking 'Done' after the categorisation question caused a rating question to appear, in which the participant indicated on a 0-100 slider their interest in reading the whole article based on the summary. Clicking ‘Done’ after this question caused the screen to refresh. The entire article appeared in another box, along with three more rating questions. Participants indicated their agreement with the following statements: "The summary contains all the important facts expressed in the full article"; "The summary is grammatically correct"; "The summary is well written". Responses were on a 5-point scale from Strongly Disagree to Strongly Agree (0-4).
3. Summary Extraction. Participants read an article on paper. A list of all the sentences
appearing in the article in sequential order then appeared on screen. Participants were asked to indicate the 4 most important sentences (by checking a box beside the chosen sentences). The dependent measure was the time taken.
Conflict Resolution. Participants read scenarios describing common workplace conflicts, then
responded using multiple choice to indicate their preferred conflict resolution styles: Competition, Accommodation, Collaboration, Compromise, or Avoidance. It was based on the 2-dimensional model of conflict proposed by Thomas [Kilmann & Thomas, 1977; Thomas, 1976].
Vigilance/Alertness. There was always an envelope icon on the computer screen in a fixed
location. Participants were instructed that when the icon changed colour and they heard a 'beep', they were to click on the icon as quickly as possible. The dependent variable was the time taken to respond to the event. These events occured at pre-determined random intervals (but not during any other timed task).
Motivation/Persistence. Symbols entered the screen from the left, travelling along a black line
similar to a conveyor belt. Certain symbols were designated as targets. When targets crossed the screen into a box called the 'removal area', participants were instructed to remove them as quickly as possible by pressing the spacebar on the computer keyboard. The speed that the symbols travelled gradually increased and participants were instructed to stop responding when they could no longer keep up. The dependent measure of persistence was the maximum speed at which they stopped responding. This measure is analogous to the paper-based task
developed by Feather [1962], in which participants try to complete impossible puzzles. We also measured the rate of correct target removal.
Environmental Competence. A new measure was adapted from Jones & Veitch [2000] for this
study. Jones & Veitch developed a 5-item scale to assess office workers' feelings of competence to create desirable environmental conditions in their usual workplaces; it is analogous to common scales measuring job competence [e.g., Wagner & Morse, 1975]. Participants indicated their agreement or disagreement with such statements as "I believe I know how to create good working conditions for myself." A four-item version of the scale demonstrated acceptable internal consistency reliability (.73, N=93).
Mood. Mood was assessed using the Russell and Mehrabian 3-Factor Mood Scale [Russell &
Mehrabian, 1977]. This is a well-documented psychological measure that has been used successfully in previous research to detect subtle emotional effects of experimental conditions [e.g., Veitch et al., 1991; Veitch & Newsham, 1998]. It provides scores on an 8-point scale for Pleasure, Arousal, and Dominance factors, each of which is the average of the scores on 6 semantic differential pairs relating to that factor.
Room Appraisal. The room appraisal measure was a set of 27 semantic differentials based on
well-known lighting research [Flynn et al., 1979; Loe et al., 1994]. Each adjective pair was presented on the computer at opposite ends of a sliding scale scored from 0 to 100. This set of scales was used by Veitch & Newsham [1998] and shown to be sensitive to differences in lighting design.
Lighting Preferences. We used the lighting quality scale developed by Veitch & Newsham
[2000a], which includes scales for lighting satisfaction and glare dissatisfaction.
Workplace Satisfaction. Three measures indicated overall workplace satisfaction. Overall
environmental satisfaction was measured using the four-item scale developed by Sundstrom et al. [1994], which has good internal consistency reliability and is sensitive to changes in lighting conditions [Newsham & Veitch, 2000a; Veitch & Newsham, 1998]. A similar set of four questions assessed participants' satisfaction with their performance during the experimental session. One further question asked the participants what effect the physical environment during the
experimental session had on their self-assessed productivity, in comparison to the settings where they usually work. Veitch & Newsham [1998] found that this measure was sensitive to changes in lighting conditions.
Workday Experiences. We asked specific questions about the difficulty of the tasks, and
open-ended questions about participant beliefs concerning the nature of the study and factors that might have affected them during the day. These measures provide guidance concerning any expectancies that might have biased participants. Participants were also asked to indicate their willingness to return for a second day of work like the one they had just completed, and their willingness to volunteer to complete additional questionnaires at home; the former measure has been shown to be sensitive to changes in lighting conditions [Baron et al., 1992].
Lighting Control Evaluation. We used a five-item scale that asked about the ease of use of the
lighting controls, the speed of response of the system, and the ability of the system to create preferred conditions. This questionnaire was primarily a manipulation check to ensure that the lighting control system was functioning as intended.
2.6 Physical Measurements
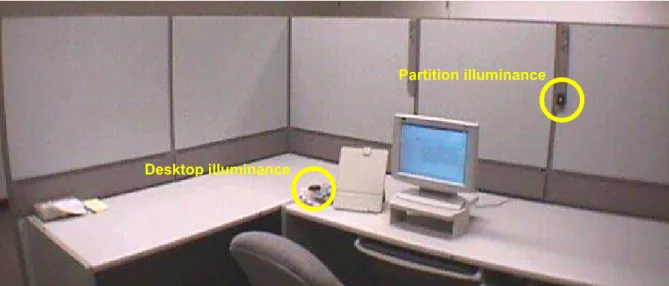
During the experimental session we recorded illuminance at two fixed positions in each workstation using Minolta T-10M illuminance meters. The measurement points are shown in Figure 3; these positions were chosen as typical desktop and partition illuminance spot
measurements. Readings were taken automatically every time a control action was taken by a participant, and were also triggered manually by the experimenter at the start of the day, and during breaks.
In addition, all control signals were recorded enabling us to recreate the various conditions after the session had been completed. This allowed us to do more detailed photometry, but this is not reported in this paper.
Desktop illuminance
Partition illuminance
Figure 3. Fixed photometric measurement points.
3. RESULTS
This experiment utilized a 4 x 4 x 3 (lighting design x starting illuminance x time-of-day) design, in which individual lighting control was added for the last part of the experimental day. Lighting design and starting illuminance were varied between subjects, and time-of-day was a within-subjects variable. In this paper we will focus on the main effect of time-of-day only.
3.1 What are occupants’ preferred luminous conditions?
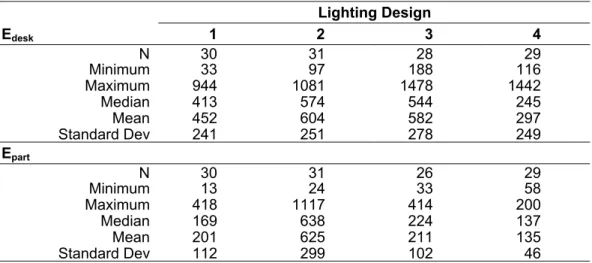
Table 3 gives descriptive statistics for the illuminance measured at the two fixed points on the desktop and partition (see Figure 3) at the end of the day. It is clear that the average preference varied by lighting design, not surprising given the different lighting equipment used. Chosen light levels also varied substantially between participants within a design. Nevertheless, it is
interesting to note that for the most common and conventional design, Design 1, the average chosen desktop illuminance was around 400 – 450 lux, typical of other studies [e.g. Veitch & Newsham, 2000a], and recommended practice [IESNA, 2000].
Table 3. Descriptive statistics for the illuminance measured at the end of the day, by lighting design. Lighting Design Edesk 1 2 3 4 N 30 31 28 29 Minimum 33 97 188 116 Maximum 944 1081 1478 1442 Median 413 574 544 245 Mean 452 604 582 297 Standard Dev 241 251 278 249 Epart N 30 31 26 29 Minimum 13 24 33 58 Maximum 418 1117 414 200 Median 169 638 224 137 Mean 201 625 211 135 Standard Dev 112 299 102 46
3.2 What is the effect of getting lighting control on mood, satisfaction, and performance? 3.2.1 Analysis Method
To answer this question we conducted a series of analyses of variance. When there was only one outcome the tests were univariate (ANOVAs). When there was more than one outcome the tests were multivariate (MANOVAs). Outcomes were grouped into MANOVAs according to themes; some were based on multiple outcomes from a single questionnaire or task, others involved outcomes from more than one questionnaire or task. In some cases simple
transformations were applied to outcome variables to improve the normality of data distribution. Following our common practice (and in order to avoid Type I statistical errors) we examined univariate effects within MANOVAs only if the overall MANOVA was significant.
In our overall analyses we examined within-subject time-of-day effects (which included the effect of introducing control), between-subject lighting design effects, and their interactions. In this paper we will report the main effects of time-of-day only. Interactions between time-of-day and lighting design did occur, but they were infrequent and did not substantially modify the
conclusions related to control introduction base on time-of-day main effects alone. Detailed information on the interactions is available in Newsham et al. [2003] and Newsham et al [2004]. Some performance tasks included within-subject variables particular to the task; e.g. contrast on the Vision Test, and font size for the Typing Task. These effects were tested, but the details are not reported in this paper; again, details are available in Newsham et al. [2003] and Newsham et al [2004]
With reference to Table 4, most outcomes were measured at three general times of day: • T1: am
• T2: pm – before control was introduced • T3: pm – after control was introduced
However, some outcomes were measured only twice (Environmental Competence at T1 and T3; Workplace Satisfaction at T2 and T3). When outcomes were measured at three times we conducted tests on two single degree-of-freedom contrasts: T1 vs. T2 and T2 vs. T3; when outcomes were measured at two times the effect was for a single degree-of-freedom contrast only. Workday Experiences were polled at T3 only, and therefore its analysis involved no time-of-day effects.
In the case of Visual and Physical Discomfort, responses were recorded at three times, but scores were heavily skewed towards the low end of the scale (few symptoms). Change scores provided a much better distribution, and so we tested for effects on (T2-T1) vs. (T3-T1). In most cases the tested questionnaire outcomes were simple means of appropriate individual questionnaire items. Room Appraisal involved an additional step. The common practice is to perform Factor Analysis on the responses to the individual items to generate a small number of composite scales for analysis. Our factor analysis yielded five scales related to Pleasantness, Variability, Informalness, Illumination, and Size; outcomes were the means of the individual items that loaded on these scales. The details of this factor analysis are given in Newsham et al. [2003].
For the Vision Test analysis we combined response times and accuracy scores to form a composite visual performance score. For the typing task the single dependent variable was correct characters typed per second. For Cognitive performance, there were a maximum of 10 trials of the Categorization and Summary tasks in each (non-practice) session. We analyzed outcomes from the first six trials in each session only, a number that everyone completed. Session scores were the mean score of the six trials within a session. There was one accuracy score, the accuracy of categorization, which ranged between 0 and 6 correct responses per session. This score was squared to improve normality (Catcorsq). There were three measures of speed. The first (Cattim) was the time taken to make the category decision. The second (Cattr) was the time taken to complete the entire categorization trial, including category decision. The third (Sumtim) was the time spent on the screen that introduced each summary extraction trial plus the time to complete the extraction trial. For the evaluations of the short summaries used in the Categorization Task, the session scores were the mean score of the six trials within that session.
There were two measures of Vigilance/Alertness. One was derived from the conveyor belt task: it was the average hit rate ((hits-false positives)/targets) at the third highest speed (~1.1
symbols/sec) in each trial. We chose this speed for analysis because the data showed that at this speed the task was challenging and participants were still responding as expected. Performance was averaged over the four trials in a single session to give a session average score. The other measure was the speed of response to the envelope prompt (response/sec). The session average score was the mean of two possible responses in each session.
We also examined outcomes related to Work Structure. Most of the tasks occurred in sets of several trials; for two tasks we have data on the length of time between trials. This is the period of time during which the introductory screen for the new trial appeared on the computer. For the typing and conveyor belt tasks this time could be used as a rest break, there was no work to be done and participants were free to wait as long as they wanted before continuing. In both cases the measurement was in seconds, and average scores were calculated for each session (across three trials in each session for typing, four for conveyor). Outliers with breaks longer than 50 seconds were removed. To improve the normality of the data, a log10 transformation was applied.
3.2.2 Results of Analysis
Table 4 summarizes the results of the analyses for mood and satisfaction, and Table 5
summarizes the results for task performance. Data of significant effects only are shown, data for non-significant tests are not shown. The results of the individual tests are described below. For ratings of Mood, both Dominance and Arousal were significantly increased at T3
(post-control) compared to T2 (pre-(post-control). Pleasure got significantly worse over the pre-control period from T1 to T2. Although the introduction of control did not produce a significant improvement at T3, the decline in Pleasure was arrested. The Dominance effect is a good manipulation check: we expected increased control over the environment would be associated with a feeling of increased dominance.
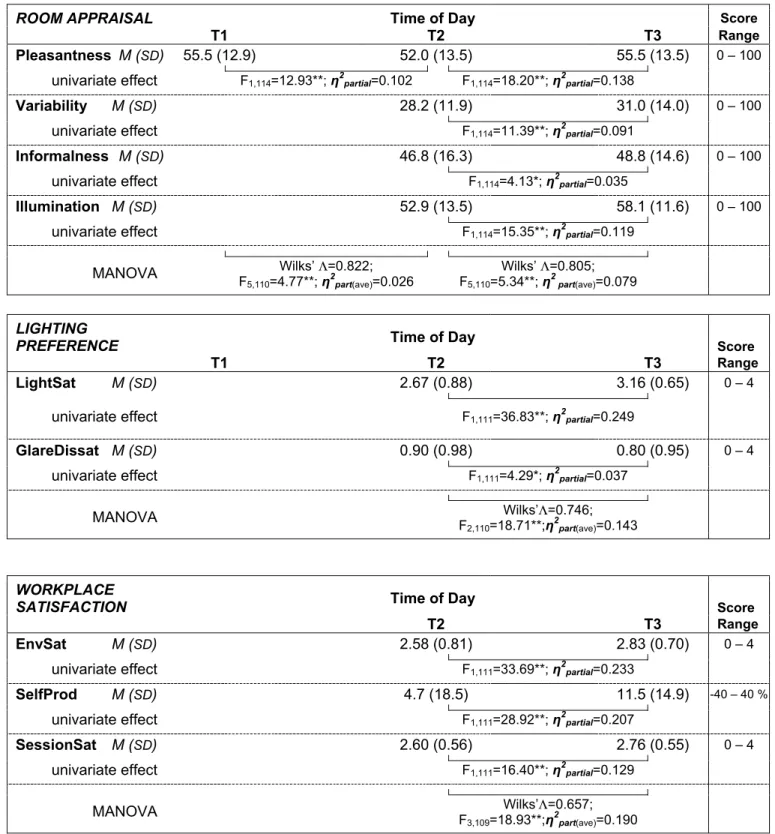
On ratings of Room Appraisal, we observed that ratings of Pleasantness declined significantly over the pre-control period from T1 to T2. However, there was a significant improvement in Pleasantness ratings at T3, post-control. This significant improvement in ratings at T3 compared to T2 was also seen for Variability, Informalness, and Illumination. Since it is lighting control that is provided, it is no surprise that the increase in Illumination rating was associated with one of the larger Room Appraisal effect sizes.
We saw results consistent with this observation on ratings of Lighting Preference. Ratings on the Lighting Satisfaction scale were significantly improved at T3, and this effect size was the largest of all the effects in our series of MANOVAs (η2partial=0.25). Glare Dissatisfaction was also
significantly lower post-control. The Glare effect is small; the space and lighting were designed to minimise glare, and the Glare Dissatisfaction ratings were generally very low at all times of the day. As a corollary, Lighting Satisfaction ratings were generally high, and skewed towards the positive end of the scale. Note that there was no significant change in these measures from T1 to T2, when the lighting conditions were constant.
A similar pattern of post-control improvements was observed for the Workplace Satisfaction scales. Ratings of Environmental Satisfaction, Self-assessed Productivity, and Session Satisfaction were all significantly higher at T3 compared to T2. It is encouraging to note that lighting control increases not just satisfaction with lighting, but satisfaction with the general environment and workplace also.
Finally, we also saw a significant improvement post-control for Visual Discomfort (there were no significant effects for Physical Discomfort). The results show that, relative to the discomfort prevailing at T1, there was significantly less (self-reported) visual discomfort at T3 compared to T2. This is important because it takes the positive effects of introducing lighting control beyond improved mood and satisfaction to improvements in what might be termed (at least short-term) health effects.
Table 4. Summary of the MANOVAs on mood and satisfaction outcomes. Data for statistically significant tests only are shown. *p < 0.05; ** p < 0.01
MOOD Time of Day Score
T1 T2 T3 Range Pleasure M (SD) 4.62 (1.34) 4.32 (1.31) 0 – 8 univariate effect F1,114=5.98*; η 2 partial=0.050 Dominance M (SD) 3.21 (1.02) 3.44 (1.14) 0 – 8
univariate effect F1,114=10.09**; η2 partial=0.121
Arousal M (SD) 3.55 (0.90) 3.84 (1.02) 0 – 8
univariate effect F1,114=6.84**; η2 partial=0.057
MANOVA F Wilks’ Λ=0.917;
3,112=3.38*; η2 part(ave)=0.026
Wilks’ Λ=0.870; F3,112=5.56**; η2 part(ave)=0.068
Table 4. Summary of mood and satisfaction MANOVAs, continued.
ROOM APPRAISAL Time of Day Score
T1 T2 T3 Range
Pleasantness M (SD) 55.5 (12.9) 52.0 (13.5) 55.5 (13.5) 0 – 100 univariate effect F1,114=12.93**; η2partial=0.102 F1,114=18.20**; η2partial=0.138
Variability M (SD) 28.2 (11.9) 31.0 (14.0) 0 – 100
univariate effect F1,114=11.39**; η2partial=0.091
Informalness M (SD) 46.8 (16.3) 48.8 (14.6) 0 – 100
univariate effect F1,114=4.13*; η2partial=0.035
Illumination M (SD) 52.9 (13.5) 58.1 (11.6) 0 – 100 univariate effect F1,114=15.35**; η 2 partial=0.119 MANOVA Wilks’ Λ=0.822; F5,110=4.77**; η2part(ave)=0.026 Wilks’ Λ=0.805; F5,110=5.34**; η2 part(ave)=0.079 LIGHTING
PREFERENCE Time of Day Score
T1 T2 T3 Range LightSat M (SD) 2.67 (0.88) 3.16 (0.65) 0 – 4 univariate effect F1,111=36.83**; η 2 partial=0.249 GlareDissat M (SD) 0.90 (0.98) 0.80 (0.95) 0 – 4 univariate effect F1,111=4.29*; η 2 partial=0.037 MANOVA Wilks’Λ=0.746; F2,110=18.71**;η2part(ave)=0.143 WORKPLACE
SATISFACTION Time of Day Score
T2 T3 Range
EnvSat M (SD) 2.58 (0.81) 2.83 (0.70) 0 – 4
univariate effect F1,111=33.69**; η2partial=0.233
SelfProd M (SD) 4.7 (18.5) 11.5 (14.9) -40 – 40 %
univariate effect F1,111=28.92**; η
2
partial=0.207
SessionSat M (SD) 2.60 (0.56) 2.76 (0.55) 0 – 4
univariate effect F1,111=16.40**; η2partial=0.129
MANOVA Wilks’Λ=0.657;
Table 4. Summary of mood and satisfaction MANOVAs, continued.
DISCOMFORT Time of Day Score
T1 T2 T3 Range
VislDisc M (SD) 2.15 (2.35) 4.17 (3.98) 3.27 (3.81) -32 – 32 univariate effect F1,114=13.70**; η2partial=0.107
MANOVA Wilks’Λ=0.891;
F2,113=6.94**; η2parl(ave)=0.061
On the Vision test there were significant effects on the time-of-day contrasts; performance increased significantly from T1 to T2, and from T2 to T3.
Results of the Typing task showed a similar pattern of significant time-of-day effects, again, performance increased significantly from T1 to T2, and from T2 to T3.
We formed two MANOVAs on Cognitive performance outcomes. The first MANOVA focussed on speed and accuracy outcomes. There were significant effects on the time-of-day contrasts. Accuracy improved significantly from T1 to T2, and from T2 to T3. Speed showed significant improvements over time as well: Cattr decreased from T1 to T2, and again from T2 to T3, as did Sumtim; Cattim showed a significant decrease from T2 to T3 only.
The second MANOVA focussed on evaluations of the short summaries used in the Categorization Task. Again, there were significant effects on time-of-day contrasts. Only Grammatic, the rating of whether the summary was grammatically correct, showed no significant univariate effect. Other univariate effects showed the same pattern. Interest, Factual and Well Written all declined from T1 to T2, then showed a significant increase from T2 to T3. This might indicate a ‘post-lunch dip’ [Carrier & Monk, 2000], or might be a function of the quality of the articles used at T2. For Vigilance/Alertness too, there was a significant effect on the time-of-day contrasts.
Performance on the conveyor belt task increased significantly from T1 to T2; there was no further significant effect from T2 to T3. There was no effect on the envelope response task.
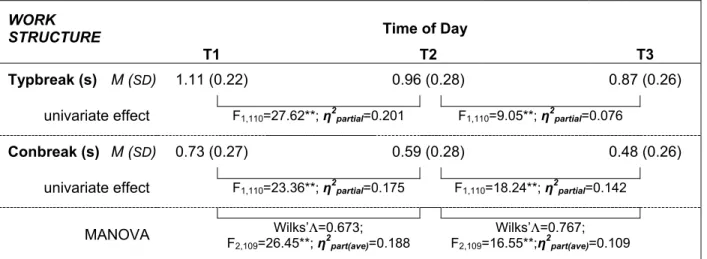
For Work Structure, both typing breaks and conveyor belt breaks decreased in length significantly from T1 to T2, and again from T2 to T3.
Table 5. Summary of the analyses of task performance outcomes. Data for statistically significant tests only are shown. *p < 0.05; ** p < 0.01.
VISION (correct/s) Time of Day
T1 T2 T3 M (SD) 0.810 (0.292) 1.069 (0.268) 1.123 (0.253) ANOVA F1,114=189.01**; η 2 partial=0.623 F1,114=18.57**; η 2 partial=0.140
TYPING (char/s) Time of Day
T1 T2 T3
M (SD) 2.66 (0.97) 2.86 (0.99) 2.92 (1.01) ANOVA F1,101=36.79**; η2partial=0.349 F1,101=4.23*; η2partial=0.040
Table 5. Summary of the analyses of task performance outcomes, continued.
COGNITIVE Time of Day Score
T1 T2 T3 Range
Catcorsq M (SD) 18.0 (6.9) 23.0 (7.5) 32.1 (5.7) 0 – 36
univariate effect F1,114=24.28**; η2partial=0.176 F1,114=126.48**; η2partial=0.526
Vcattim (s) M (SD) 20.2 (8.7) 16.2 (7.5) univariate effect F1,114=68.32**; η 2 partial=0.375 Cattr (s) M (SD) 96.8 (37.1) 87.2 (35.1) 77.3 (32.0) univariate effect F1,114=41.57**; η 2 partial=0.267 F1,114=45.02**; η 2 partial=0.283 Sumtim (s) M (SD) 130.9 (39.8) 122.1 (44.3) 105.1 (41.4) univariate effect F1,114=23.01**; η2partial=0.168 F1,114=86.84**; η2partial=0.432
MANOVA F Wilks’Λ=0.549;
4,111=22.79**;η2part(ave)= 0.156
Wilks’ Λ=0.282; F4,111=70.64**;η2part(ave)=0.404
COGNITIVE Time of Day Score
T1 T2 T3 Range
Interest M (SD) 60.5 (17.6) 48.7 (15.7) 54.6 (14.2) 0 – 100
univariate effect F1,114=44.75**; η2partial=0.282 F1,114=17.81**; η2partial=0.135
Factual M (SD) 2.46 (0.66) 2.21 (0.60) 2.49 (0.58) 0 – 4 univariate effect F1,114=18.46**; η 2 partial=0.139 F1,114=30.06**; η 2 partial=0.209 Well Written M (SD) 2.40 (0.58) 2.19 (0.55) 2.43 (0.54) 0 – 4 univariate effect F1,114=13.03**; η 2 partial=0.103 F1,114=24.15**; η 2 partial=0.175 MANOVA Wilks’Λ=0.651; F4,111=14.89**; η2par(ave)=0.136 Wilks’Λ=0.700; F4,111=11.90**;η2part(ave)=0.134
VIGILANCE Time of Day
T1 T2 T3 Hits (sym/s) M (SD) 0.333 (0.252) 0.391 (0.277)
univariate effect F1,93=8.46**; η2partial=0.083
MANOVA Wilks’ Λ=0.914; F2,92=4.31*; η
2
Table 5. Summary of the analyses of task performance outcomes, continued.
WORK
STRUCTURE Time of Day
T1 T2 T3 Typbreak (s) M (SD) 1.11 (0.22) 0.96 (0.28) 0.87 (0.26)
univariate effect F1,110=27.62**; η2partial=0.201 F1,110=9.05**; η2partial=0.076
Conbreak (s) M (SD) 0.73 (0.27) 0.59 (0.28) 0.48 (0.26) univariate effect F1,110=23.36**; η2partial=0.175 F1,110=18.24**; η2partial=0.142
MANOVA F Wilks’Λ=0.673;
2,109=26.45**; η2part(ave)=0.188
Wilks’Λ=0.767; F2,109=16.55**;η2part(ave)=0.109
3.3 What is the effect of working under non-preferred lighting conditions on mood, satisfaction and performance?
3.3.1 Analysis Method
Previous work [Newsham & Veitch, 2001] suggested that it is not having lighting control in itself that improves occupant mood and satisfaction, but the ability to create a luminous environment close to one’s own preference. Our test of this hypothesis was based on the following
proposition:
Participants who made the biggest changes in light levels post-control were the participants furthest from their own preferred luminous conditions pre-control; and,
these same participants will experience the biggest improvements in outcomes as a result.
At this stage we chose a simple measure of light level, the illuminance measured at the fixed desktop location, Edesk (see Figure 3) as an indicator of preferred luminous conditions. As a
measure of change in this variable we chose the difference between the value of Edesk at the end
of the day (representing the net result of several adjustments during the post-control period after the maximum exposure to conditions), and the fixed value prevailing during the entire pre-control period, this difference is denoted as ∆Edesk. We assumed that positive and negative values of
∆Edesk of the same magnitude predict similar effects on outcomes, and so we used the absolute
value of the change in Edesk, or |∆Edesk|. Finally, to achieve better normality we took the square
root, so our final predictor variable was |∆Edesk| 0.5
. For each of the outcome ratings we took the change between T3 and T2 as the dependent measure; we use a ∆ prefix to indicate these change scores.
Next we performed regressions of ∆(outcomes) vs. |∆Edesk| 0.5
, in which a significant relationship with positive slope would support our hypothesis. We began with ratings of Mood. However, initial exploration showed that including data from Lighting Design 4 was problematic. Participants’ ability to manipulate lighting conditions in Design 4 differed substantially in
magnitude compared to the other designs. In addition, Design 4 used a different ambient lighting system than the other three designs. Regression analyses benefit from a large degree of
variation in the predictor variable, with values well-distributed across that range. Desktop
illuminance conditions produced by Design 4 did not fit this description, and we therefore decided to exclude data from Design 4 from these regression analyses. After making this decision for the Mood ratings, we maintained it for the regressions on all other outcome variables.
3.3.2 Results of Analysis
Table 6 details the results of the regression analyses for the mood and satisfaction outcomes, Table 7 shows the results for the task performance outcomes (only statistically significant results are shown). All significant mood and satisfaction regressions have positive slope, supporting our hypothesis. That is, the bigger the change in light level made by the participants to meet their personal preference, the bigger the improvement in ratings of mood, satisfaction, and discomfort. Interestingly, the intercept for the Mood ratings is negative, indicating that for those who made no change in luminous conditions, ratings of Pleasure, Dominance and Arousal tended to decline from T2 to T3. Intercepts for other outcomes also tended to have negative values. Effect sizes were generally small, but it is not surprising that the biggest effect in terms of explained variance and β-weight was for the regression on Lighting Satisfaction. The Physical Discomfort regression was statistically significant. This is consistent with Allie & Palacios [2002], who observed
improvements in a similar discomfort score following ergonomics interventions in a field setting.
Table 6. Summary of the regression analysis for change in ratings vs. change in luminous conditions for mood and satisfaction outcomes. Only significant relationships are shown (p<.05).
In every case, the predictor variable was |∆Edesk| 0.5
.
Outcome Intercept (unstandardized)Slope β-weight
(standarized) F1,87 r 2 MOOD ∆ Pleasure - 0.423 0.044 0.274 7.06 0.075 ∆ Dominance - 0.147 0.029 0.234 5.05 0.055 ∆ Arousal - 0.243 0.037 0.237 5.17 0.056 ROOM APPRAISAL ∆ Pleasantness - 0.983 0.336 0.238 5.21 0.056 LIGHTING PREFERENCE ∆ LightSat - 0.266 0.050 0.362 13.08 0.131 WORKPLACE SATISFACTION ∆ EnvSat 0.042 0.016 0.225 4.50 0.051 ∆ SessionSat - 0.098 0.017 0.248 5.70 0.061 DISCOMFORT ∆ PhysDisc - 0.876 0.076 0.219 4.37 0.048
For the task performance outcomes, three dependent variables show significant regressions, two of the effects support our hypothesis, but the other does not. For typing at 8-point font, bigger changes in light level did foster bigger improvements in typing speed. However, the opposite was true for 16-point font, where bigger changes in light level were associated with bigger
deteriorations in typing speed. It might be true in some situations that performance on smaller fonts is more important than performance on larger fonts, but not all. The other significant effect is on Cattim, the time taken to categorize a short article. Bigger changes in light level were associated with bigger reductions in categorization time, which we interpret as an improvement in performance.
Given the small number of significant effects, the effect sizes, and the fact that one of the three effects opposed the hypothesis, support for our hypothesis related to task performance is weak at best.
Table 7. Summary of the regression analysis for change in performance vs. change in luminous conditions. Only significant relationships are shown. In every case, the predictor variable was |∆Edesk|
0.5
, the square-root of the absolute change in desktop illuminance between the start and end of the day. The outcome variables are the change in performance from T3 compared to T2.
Outcome Intercept Slope (unstandardized) β-weight
(standarized) F r 2 TYPING ∆ CPS (8-pt) - 0.378 0.014 0.217 (1,86) 4.24 0.047 ∆ CPS (16-pt) 0.217 - 0.021 - 0.283 (1,84) 7.29 0.080 COGNITIVE ∆ Cattim (sec) - 1.036 - 0.201 - 0.230 (1,87) 4.85 0.053 4. DISCUSSION
On mood and satisfaction outcomes there were many significant time-of-day effects in Table 4. These effects were consistent in showing significant improvements in mood, satisfaction and discomfort outcomes from T2 to T3. To interpret this with regard to the introduction of control we need to consider other data from experiments of this type. In other laboratory studies related to lighting in spaces without windows [Veitch & Newsham, 1998; Veitch & Newsham, 2000a], using the same Mood scores we have used here2, we have observed that, in the absence of
interventions designed to boost mood, mood scores will become more negative over the course of an experimental day. In this experiment we saw an increase in Dominance and Arousal from T2 to T3. For Pleasure, although we observed a decrease in rating from T1 to T2, this decrease was arrested from T2 to T3. It therefore seems reasonable to conclude that these improvements are primarily attributable to the positive effect of receiving and utilizing lighting control.
This conclusion is reinforced by the analyses shown in Table 6. We demonstrated that
participants who made the biggest changes to lighting conditions post-control tended to register the biggest improvements in mood and satisfaction outcomes, and, indeed, that those who made little change registered little or no improvements.
The interpretation of time-of-day effects on task performance outcomes is somewhat different, however. There were also consistent and significant improvements from T2 to T3 for task performance outcomes. At first sight, this might also be attributed to the provision of individual lighting control. However, we have evidence from other studies [Veitch & Newsham, 1998; Veitch & Newsham, 2000b; Boyce, Veitch et al., 2003] that there are practice effects associated with these tasks over relatively short exposure times, such that performance in this experiment would be expected to improve over the course of the day even in the absence of control. Therefore, the pertinent question is: did the introduction of dimming control improve performance beyond the inherent improvement due to practice?
One way we addressed this question was to compare our results to those from another, very similar, experiment. This experiment [Boyce, Veitch et al., 2003] used a one-day schedule of tasks almost identical to ours; they also employed temporary office workers as participants in typical partitioned office accommodation. We compared our data to those from one part of Boyce, Veitch et al.’s study in which participants did not have dimming control, and experienced one of two typical office lighting designs for the experimental day. 107 participants provided data in this part of the study.
2
Note, in these other lighting studies, mood was measured at two times of day only, which does limit the strength of comparison to this study.
Although the Boyce, Veitch et al. experiment was very similar to ours, it was not identical. Ours took place in a mock-up office laboratory, theirs took place in an office constructed on one floor of a real office building. Our space was windowless, theirs had distant view windows, although they were designed to provide very little illumination. In our experiment there were a maximum of two participants per day; in Boyce, Veitch et al. the maximum was nine participants per day. The schedule was split into four sessions like ours, with the first session designed as a practice session. However, the start times for each session were not identical, due to differing morning start times, and different coffee and lunch break durations. Boyce, Veitch et al. used several additional tasks that we did not use, such as a colour vision task and a group discussion task. Not every common task was administered the same number of times in each experiment. For example, Boyce, Veitch et al. administered the on-screen vision test only twice during the day. Finally, although the tasks were identical, the derived outcome variables did differ for a small number of tasks. However, despite these differences, there were many outcomes for which a direct comparison could be made between (the equivalent of) T2 and T3 performance in both studies.
We compared the size of effects in both studies. We considered two ways of looking at the size of effects: the difference in the mean performance between T2 and T3, and the variance in performance explained by the time-of-day effect (η2 partial). If introducing control provides a boost to task performance over the simple practice effect we would expect to see proportion of variance explained, and changes in mean score, to be higher in our experiment than in Boyce, Veitch et al. There were two outcomes (Interest and Conbreak) that showed significant improvement from T2 to T3 in this experiment but not in Boyce, Veitch et al. Conversely, there were two outcomes (Grammar and Envspd) that showed significant improvement from T2 to T3 in Boyce, Veitch et al. but not in this experiment. For outcomes where both experiments showed significant
improvement from T2 to T3, the mean improvement was greater for Boyce, Veitch et al. on four outcomes, greater for this experiment on two outcomes, and equal on one outcome. The variance explained was greater for Boyce, Veitch et al. on five outcomes, and greater for this experiment on two outcomes. To sum up, the outcomes from the two experiments are remarkably similar, and differences, where they occur, are small.
The second way to try to separate the practice effect from the effect of introducing control is through the regression analysis detailed in Table 7, above. If those participants who made the biggest changes to light level also registered the biggest improvements in performance this could argue for a control effect separate from the practice effect. However, the results did not support this. Overall then, there is little evidence that providing individual dimming control improved task performance over and above the known practice effect, for the short-term tasks we used in our experiment.
In terms of the practical implications of these results, the key question for both the satisfaction and task performance outcomes is whether our experimental findings would persist in the long-term in a real office setting. In other words, were the benefits we observed on mood, satisfaction and discomfort due to a short-term novelty effect in a laboratory, or would occupants with
dimming control over lighting in a real office feel better than those without such control, and continue to feel better? If the effect does persist, then it is also possible that benefits to task performance, which we did not see in the short-term laboratory study, would emerge over the longer-term after performance had stabilized with experience. Remember also that in a real setting the tasks people perform are different than the representative tasks we used in the experiment, and that these tasks may be more or less sensitive to lighting conditions. In a real setting there are also many other measures related to an organisation’s performance that we cannot address in a laboratory study, such as absenteeism, organizational commitment, or teamwork. There are still other measures that are more appropriately measured at the level of a business unit than at the level of an individual. For example, improved environmental
satisfaction has been correlated with job satisfaction and intent to leave an organisation, which in turn have been linked to corporate financial indicators [Veitch et al., 2002; Carlopio, 1996;
Oldham & Fried, 1987; Harter et al., 2002]. These considerations argue for a field study of the effects of having individual dimming control over lighting to address these longer-term, real-world effects. We suggest that such a field study be a priority for the lighting controls industry.
5. CONCLUSIONS
• Introducing individual lighting control improved ratings of mood, satisfaction and discomfort, but did not improve task performance.
• In concert with earlier work [Veitch & Newsham, 2000b; Newsham & Veitch, 2001], our results suggest that it is not simply the availability of control that brings benefits to the user, but exercising control to achieve preferred conditions. For practice this implies that control systems should be easily accessible, easy to understand, and able to effect substantial changes in conditions.
• Our results were obtained from a relatively short exposure in a mock-up office laboratory. We recommend a longer-term study in a real office setting to examine if the mood, satisfaction and discomfort benefits persists, and if benefits to task performance, or other outcomes important to organisations, emerge.
6. ACKNOWLEDGEMENTS
This work was sponsored by the National Research Council Canada (NRC), the Program on Energy Research & Development, and Public Works & Government Services Canada (PWGSC). The authors are grateful for the technical help provided by Roger Marchand (NRC) and Jana Svec (NRC). Thanks are also due for the support of Morad Atif (NRC), Ivan Pasini (PWGSC) and Karen Pero (PWGSC).
7. REFERENCES
Allie, P.; Palacios, N. 2002. “Steelcase Leap chair’s impact on office work effectiveness, productivity and health”. Steelcase Study Summary.
http://www.steelcase.com/en/pdf/knowledgepapers/LeapWhitePaper.pdf
Baron, R.A.; Rea, M.S.; Daniels S.G. 1992. “Effects of indoor lighting (illuminance and spectral distribution) on the performance of cognitive tasks and interpersonal behaviors: the potential mediating role of positive affect”, Motivation and Emotion, 16, pp. 1-33.
Bordass, W.; Bromley, K.; Leaman, A. 1993. “User and Occupant Control in Buildings”,
Proceedings of the International Conference on Building Design, Technology and Occupant Well-Being in Temperate Climates, Brussels.
Boyce, P.R.; Eklund, N.H.; Simpson, S.N. 2000. “Individual Lighting Control: Task Performance, Mood, and Illuminance”, Journal of the Illuminating Engineering Society, Winter, pp. 131-142. Boyce, P. R., Veitch, J. A., Newsham, G. R., Myer, M., & Hunter, C. (2003). Lighting quality and office work: A field simulation study (PNNL 14506). Richland, WA, USA: Pacific Northwest National Laboratory.
Canadian Codes Centre. 1997. Model National Energy Code of Canada for Buildings. Ottawa, ON, Canada: National Research Council.
Carlopio, J.R. 1996. "Construct validity of a physical work environment satisfaction questionnaire", Journal of Occupational Health Psychology, 1 (3), pp. 330-344.
Carrier, J.; Monk, T.H. 2000. “Circadian rhythms of performance: new trends,” Chronobiology
Escuyer, S.; Fontoynont, M. 2001. "Lighting controls: a field study of office worker’s reactions,"
Lighting Research and Technology, 33 (2), pp. 77-96.
Feather, N. T. (1962). “The study of persistence”. Psychological Bulletin, 59, pp. 94-115. Flynn, J. E.; Hendrick, C.; Spencer, T.; & Martyniuk, O. 1979. “A guide to methodology procedures for measuring subjective impressions in lighting”, Journal of the Illuminating
Engineering Society, 8, pp. 95-110.
Harter, J.K.; Schmidt, F.L.; Hayes, T.L. 2002. “Business-unit-level relationship between
employee satisfaction, employee engagement, and business outcomes: a meta-analysis”, Journal
of Applied Psychology, 87 (2), pp. 268-279.
IESNA. 2000. Lighting Handbook 9th Edition (Ed: Rea M), p. 10-13. New York, NY, USA: Illuminating Engineering Society of North America
Jennings, J.D.; Rubinstein, F.M.; DiBartolomeo, D.; Blanc, S.L. 2000. “Comparison of control options in private offices ...”, Journal of the Illuminating Engineering Society, Summer, pp 39-60. Jones, S. J.; Veitch, J. A. 2000. The effects of workplace control on employee satisfaction and
performance. Paper presented at the 108th Annual Convention of the American Psychological
Association, Washington, D.C., USA.
Kilmann, R. H.; Thomas, K. W. 1977. “Developing a forced-choice measure of conflict-handling behavior: The "MODE" instrument”. Educational and Psychological Measurement, 37(2), pp. 309-325.
Loe, D.L.; Mansfield, K.P.; Rowlands, E. 1994. “Appearance of lit environment and its relevance in lighting design: experimental study”, Lighting Research and Technology 26 (3), pp. 119-133. Maniccia, D.; Rutledge, B.; Rea, M.S.; Morrow, W. 1999. “Occupant Use of Manual Lighting Controls in Private Offices”, Journal of the Illuminating Engineering Society, Summer, pp. 42-56. Moore, T.; Carter, D.J.; & Slater, A.I. 1999. “A field study of occupant controlled lighting in offices”, Lighting Research and Technology, 34 (3), pp. 191-205.
Newsham, G.R., Veitch, J.A. 2001. "Lighting quality recommendations for VDT offices: a new method of derivation," Lighting Research and Technology, 33 (2), pp. 97-116.
Newsham, G.R., Arsenault, C., Veitch, J.A. 2002. "Preferred surface illuminances and the benefits of individual lighting control : a pilot study," Proceedings of the IESNA Annual Conference (Salt Lake City), pp. 101-113.
Newsham, G.R.; Veitch, J.A.; Arsenault, C., Duval, C. 2003. Lighting for VDT workstations 1: Effect of control on energy consumption and occupant mood, satisfaction and discomfort, IRC Research Report RR-165. Ottawa, ON, Canada: National Research Council.
Newsham, G.R.; Veitch, J.A.; Arsenault, C., Duval, C. 2004. Lighting for VDT workstations 2: Effect of control on task performance, and chosen photometric conditions, IRC Research Report RR-166. Ottawa, ON, Canada: National Research Council.
Oldham, G.R.; Fried, Y. 1987. "Employee reactions to workspace characteristics", Journal of
Applied Psychology, 72 (1), pp. 75-80.
Russell, J. A.; Mehrabian, A. 1977. Evidence for a three-factor theory of emotions. Journal of
Steelcase. 1999. “Office workers believe quality of lighting affects productivity and creativity”, on-line document:
http://www.steelcase.com/servlet/ToolsInsightsServlet?ACTION=3&SEC_ID=3&SUB_ID=8&MIN _ID=81&CONTENT_ID=159&NAME=knowledge+library
Thomas, K. 1976. “Conflict and conflict management”. M. Dunnette (Ed.), Handbook of industrial and organizational psychology (pp. 889-935). Chicago: Rand McNally.
Veitch, J. A.; Gifford, R.; & Hine, D. W. 1991. “Demand characteristics and full spectrum lighting effects on performance and mood”. Journal of Environmental Psychology, 11, pp. 87-95.
Veitch, J.A.; Newsham, G.R. 1998. “Lighting quality and energy-efficiency effects on task performance, mood, health, satisfaction and comfort”. Journal of the Illuminating Engineering
Society, 27 (1) Winter, pp. 107 -129.
Veitch, J.A.; Newsham, G.R. 2000a. "Exercised control, lighting choices, and energy use: an office simulation experiment," Journal of Environmental Psychology, 20 (3), September, pp. 219-237.
Veitch, J.A.; Newsham, G.R. 2000b. “Preferred luminous conditions in open-plan offices: Research and practice recommendations.” Lighting Research and Technology, 32, pp. 199-212. Veitch, J.A.; Farley, K.; Newsham, G.R. 2002. “Environmental Satisfaction in Open-Plan
Environments: 1. Scale Validation and Methods”. 63rd Annual Convention of the Canadian Psychological Association, (Vancouver).
Wagner, F. R.; Morse, J. J. 1975. “A measure of individual sense of competence”.
Psychological Reports, 36, pp. 451-459.
Wibom, R. I., & Carlsson, L. W. (1987). Work at video display terminals among office workers. In B. Knave & P. G. Wideback (Eds.), Work with Video Display Units 86 (pp. 357-367). Amsterdam, the Netherlands: Elsevier Science.
APPENDIX A
Table A1. Summary of participant characteristics.
Total Design # 1 2 3 4 Sex Male 60 15 15 15 15 Female 58 15 16 13 14 Age 18 to 29 91 22 27 19 23 30 to 39 11 4 1 5 1 40 to 49 11 4 1 3 3 50 to 59 4 0 1 1 2 60 to 69 1 0 1 0 0
Correction Lenses (Usual) None 41 11 10 11 9
Reading Glasses 9 3 2 1 3 Distance Glasses 31 6 8 8 9 Bi- or Trifocals 3 0 1 1 1 Gradual or Multi-focals 1 1 0 0 0
Contact lenses 33 9 10 7 7
Correction Lenses (Today) None 55 16 15 12 12
Reading Glasses 7 2 1 1 3 Distance Glasses 24 4 7 8 5 Bi- or Trifocals 4 0 1 1 2 Gradual or Multi-focals 2 1 0 1 0 Contact lenses 26 7 7 5 7
Hearing Impairment Yes 3 1 0 1 1
No 113 28 31 26 28
Hearing Aid Yes 1 0 0 0 1
No 117 30 31 28 28
Mousing Hand Left 2 0 0 0 2
Right 116 30 31 28 27
Mean years in Paid Workforce 7.7 6.5 7.7 8.4 8.5
Mean years with Temp Agency 0.6 0.5 0.4 0.5 1.1
Education Secondary/High School 13 4 5 0 4
Community College 22 5 5 8 4
Some University 28 7 11 2 8
Bachelor’s Degree 41 9 9 15 8
Graduate Degree 14 5 1 3 5