Publisher’s version / Version de l'éditeur:
Vous avez des questions? Nous pouvons vous aider. Pour communiquer directement avec un auteur, consultez la première page de la revue dans laquelle son article a été publié afin de trouver ses coordonnées. Si vous n’arrivez pas à les repérer, communiquez avec nous à PublicationsArchive-ArchivesPublications@nrc-cnrc.gc.ca.
Questions? Contact the NRC Publications Archive team at
PublicationsArchive-ArchivesPublications@nrc-cnrc.gc.ca. If you wish to email the authors directly, please see the first page of the publication for their contact information.
https://publications-cnrc.canada.ca/fra/droits
L’accès à ce site Web et l’utilisation de son contenu sont assujettis aux conditions présentées dans le site LISEZ CES CONDITIONS ATTENTIVEMENT AVANT D’UTILISER CE SITE WEB.
Proceedings of the International Congress on Acoustics: 04 April 2004, Kyoto,
Japan, pp. 1-4, 2004-04-01
READ THESE TERMS AND CONDITIONS CAREFULLY BEFORE USING THIS WEBSITE. https://nrc-publications.canada.ca/eng/copyright
NRC Publications Archive Record / Notice des Archives des publications du CNRC : https://nrc-publications.canada.ca/eng/view/object/?id=43918659-c44e-4ed9-8b5c-f7a0deaca1a7 https://publications-cnrc.canada.ca/fra/voir/objet/?id=43918659-c44e-4ed9-8b5c-f7a0deaca1a7
NRC Publications Archive
Archives des publications du CNRC
This publication could be one of several versions: author’s original, accepted manuscript or the publisher’s version. / La version de cette publication peut être l’une des suivantes : la version prépublication de l’auteur, la version acceptée du manuscrit ou la version de l’éditeur.
Access and use of this website and the material on it are subject to the Terms and Conditions set forth at
On predicting structure borne sound transmission from wood studs to
direct-attached gypsum board
On predicting structure borne sound transmission from wood
studs to direct-attached gypsum board
Nightingale, T.R.T.; Kohler, K.; Rohlfing, J.
NRCC-46789
A version of this document is published in / Une version de ce document se trouve dans :
Proceedings of the International Congress on Acoustics, Kyoto, Japan,
April 4-9, 2004, pp. 1-4
On predicting structure borne sound transmission from wood
studs to direct-attached gypsum board
T.R.T. Nightingale
§, Katrin Kohler
†and Jens Rohlfing
†§
Institute for Research in Construction, National Research Council, Ottawa, Canada K1A OR6
†Department of Bauphysik, University of Applied Science Stuttgart, Schellingstrasse 24, D-70174
Stuttgart, Germany
Trevor.nightingale@nrc.ca
Abstract
A number of assumptions and simplifications are introduced when applying the mobility approach to predict structure borne transmission from wood studs to gypsum board that is directly attached by screws or nails. This paper examines the error introduced by three of the many simplifications. It is shown that studs do deform volumetrically, and there is a strong dependence on contact area between the studs and gypsum board. Also transmission at ill-defined contact points between the fastening points becomes important when there are few fasteners. Assumptions that ignore these factors may introduce bias errors but these oppose each other so that it is possible to achieve reasonable agreement between measured and predicted results despite incorrect theoretical foundations.
1. Introduction
The mobility approach has been used by several authors when modelling the power flow between parallel plates that are coupled directly by rods [1] or ties [2], or by one or more fasteners to a beam [ 3 , 4 ]. These formulations assume:
1. Stud velocity constant across stud depth; 2. Power flow only at fasteners;
3. Power flow independent of contact area at drive point (stud to gypsum board);
4. Continuity of velocity at stud/gypsum board interface;
5. Power flow same for all fastener locations; and 6. Power flow proportional to number of fasteners. These allow the power transmission from a beam (stud) to a point-connected plate (gypsum board) to be written
as,
( )
2 2 1 2 2 1 12 Y Y Y e v N W + ℜ = (1)where N is the number of fastening points, and
v
12 is the space averaged RMS velocity of the stud, Y1 is themobility (inverse of impedance) for the stud, Y2 is the
mobility for the gypsum board. If assumptions 1 and 3 listed above are satisfied then ordinary mobilities,
which are based on thin plate theory may be used [1], namely,
( )
(
)
1 B 1 2 bhc 1 i Y = ρ + − (2) and,(
)
(
1 2 8 B h Y = ρ)
− (3)where ρ is the bulk modulus, h is the thickness, b is the width, B is the bending stiffness, and cB is the bending
wave speed. Eqns. 2 and 3 are for points located well away from an edge of the plate and beam and can be justified, only if assumption 5 holds.
The first three assumptions will be systematically evaluated by examining: 1.) the velocity level across the stud; 2.) transmission with and without fasteners; and 3.) sensitivity of transmission to contact area between the stud and gypsum board at fasteners.
The paper begins with a description of the wall assembly used to evaluate the assumptions and of the method used to assess structure borne transmission. To give an indication of level of agreement that might be expected when all six of the listed assumptions are satisfied, measured and predicted results are given for an idealized wall construction.
2. Specimen and evaluating transmission
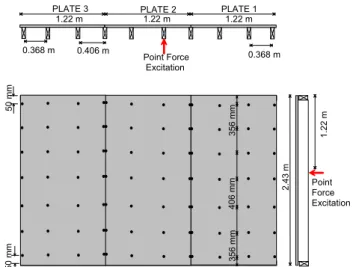
Figure 1 shows that the wall evaluated consists of a single layer of 16 mm Type X gypsum board attached to 35 x 85 mm clear western red cedar studs, spaced 406 mm on center, except at ends of the wall. A single point force was applied to one of the studs.
It is not practical to measure power transmission through a junction directly – indirect evaluation is necessary. Statistical energy analysis (SEA) may be used if both connected elements satisfy the conditions of a subsystem – modes are spaced equally in each frequency band and create a uniform energy density proportional to the damping. This allows one to write,
= = 12 2 1 2 2 12 1 1 2 2 2 2 1 m m W E m m v v η η ω η (4)
2
v
is space averaged RMS velocity, m is mass, W is transmitted power, E is energy, and ω is angular frequency, and η2 is the total loss factor (TLF) of thegypsum board. Because the mass of the stud and gypsum board is constant and the TLF of the gypsum board, η2, is reasonably constant for the fastener
conditions considered, the measured velocity ratio is proportional to the ratio of E1/W12 or inversely
proportional to the coupling loss factor, η12, between
the stud and gypsum board.
The velocity ratio of Eqn. 4 is usually expressed in decibels with the resulting quantity being referred to as velocity level difference (VLD), and can be loosely thought of as being a structural transmission loss since the coupling loss factor, η12, is proportional to the
structural power transmission coefficient. Thus, higher VLD indicates lower structure borne transmission. Measurements of VLD are obtained from differences in the space average stud levels (sampled using 14 points) and the gypsum board levels (sampled using 98 points). Laser vibrometer measurements indicate that the receive subsystem was not all three sheets of gypsum board, but only the sheet to which the excited stud was attached (plate 2 in Figure 1). Predictions of the VLD are obtained by substituting Eqn. 1 through 3 into 4 and evaluating using measured material properties.
1.22 m 1.22 m 1.22 m 0.406 m
PLATE 3 PLATE 2 PLATE 1
Point Force Excitation Point Force Point Force Excitation 2 .4 3 m 1 .2 2 m 5 0 m m 0.368 m 0.368 m 5 0 m m 4 0 6 m m 3 5 6 m m 3 5 6 m m
Figure 1: Sketch of the construction investigated.
3. Predicting an idealized case
To assess the closeness in agreement between measured and predicted results that might be expected when all assumptions are satisfied, only a single screw was used to fasten the stud to the gypsum board as shown in the insert to Figure 2 (thereby satisfying assumptions 5 and 6). A single 9 mm diameter disc (2 mm thick) was placed between the stud and gypsum board at the screw to create a “well-defined” contact area (thereby
satisfying assumptions 2 and 3). Assumption 4 is satisfied by practical levels of screw torque.
Figure 2 indicates that for this situation agreement between measured and predicted results is good from 100 to 1000 Hz. However, for higher frequencies the prediction underestimates the VLD (i.e., overestimates transmission) and the error increases with increasing frequency. As discussed in section 4.1 this is likely due in part to deformation of the stud (assumption 1 was not satisfied).
Figure 2: Measured and predicted VLD between stud and gypsum board for an idealized case that reasonably satisfies the assumptions listed in Section 1 except for number 1.
0 5 10 15 20 25 125 250 500 1k 2k 4k Frequency, [Hz] VLD, [dB] Measured Predicted 1 1 7 0 m m 1 1 7 0 m m Point Force
4. Evaluation of assumptions
The construction of Figure 2 is hardly realistic since a real wall will have: more than one fastener per stud, direct contact between the stud and gypsum board, complicated contact area at the fastener, “ill-defined” contact points away from the fastener, and assumptions about the location of the fastener(s). The next sections evaluate the assumptions relating to no volumetric deformation, transmission only at the fastening points, and infinitely small contact area at the fastener.
4.1. Do studs deform volumetrically?
In formulating Eqn. 1 it is assumed that the force applied by the screw to the gypsum board is equal to the force of the screw at the stud, which is reasonable since the screw is for practical purposes incompressible. The force applied to the stud is proportional to the difference in the stud velocity level “well away” from the point of contact [1]. This is straightforward and without error if the velocity of the stud is measured on the side where the screw is attached, but this is rarely the case.
Also, if the model is to be extended to the case with a layer of gypsum board or resilient channels on the side
where currently there is no sheathing then, it is necessary to relate the velocity on the receive-side of the stud to the velocity on the source-side. To overcome this, published models assume that the velocity is the same on the opposite sides of the stud, i.e., the stud is perfectly incompressible. This assumption is consistent with the use of ordinary mobilities derived from thin beam theory. However, Figure 3 indicates that the assumption only holds in the mid and low frequencies. For frequencies above 2kHz the velocity difference across the stud quite significant indicating volumetric deformation through the cross section. Deformation due to compressional waves occurs as the quarter-wavelength resonance condition is approached. This was verified by measuring the VLD across a rod-like sample cut from the stud.
Figure 3: Measured VLD across a wood stud.
It is interesting to compare the magnitude of the VLD across the stud above about 2kHz and the magnitude of underestimation of the prediction in Figure 2. It is highly suggestive that deformation across the stud, which is not considered in the model, is contributing to the underestimation of the predicted VLD.
It should be noted that above 2 kHz the stud cannot be considered as being acoustically thin and the magnitude mobility estimates using Eqn. 1 (particularly the imaginary component) can be a significant underestimation. The 16 mm gypsum board remains acoustically thin in the range considered. Space restriction prevents further discussion here.
4.2. Is transmission only at the fastening points? Eqn. 1 indicates the total transmitted power is simply the estimate for a single fastening point multiplied by the number of points. This implies that transmission can only occur at a fastener – there are no other sources.
It is quite possible that irregularities in the gypsum board, and more particularly the wood stud, will cause
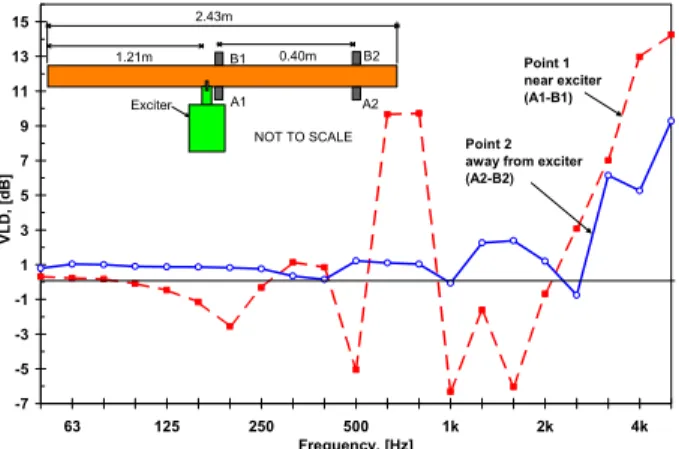
there to be a series of “ill-defined” contact areas at which there will be additional power transmission. To evaluate the importance of ill-defined contact areas the VLD was measured with and without a fastener in place, (and no spacer between the stud and gypsum board). Measurements were made with the source at each of the seven positions in turn (A through G of Figure 4) and the source located immediately opposite from the fastener. If there were no ill-defined contact areas, or they transmit insignificant power relative to a fastener, then according to Eqn. 1 the VLD without the fastener will tend to be infinite, which for practical purposes can be considered as many orders of magnitude greater than the VLD with a fastener.
Figure 4: Measured velocity level difference with and without a single fastener. A point source is applied opposite from the fastener at locations A through G.
Point force applied immediately opposite to Screw -5 0 5 10 15 20 125 250 500 1k 2k 4k Frequency, [Hz] VL D, [d B] Range for No Screws
Upper & Lower limits for a single screw 2 .4 3 m 4 0 6 m m 4 0 6 m m A B C D E F G 3 5 6 m m 4 0 6 m m 4 0 6 m m 3 5 6 m m -7 -5 -3 -1 1 3 5 7 9 11 13 15 63 125 250 500 1k 2k 4k Frequency, [Hz] VL D, [d B] Exciter 2.43m 1.21m 0.40m NOT TO SCALE A1 B1 B2 A2 Point 1 near exciter (A1-B1) Point 2 away from exciter (A2-B2)
The shaded area Figure 4 indicates the range in the VLD measured when there is no fastener for the seven source positions. Also shown are the lower and upper limits when there is a fastener. It is clear that the VLD measured without a fastener can be comparable to the VLD measured when there is a fastener. Thus, for a small number of fasteners additional power transmission at ill-defined areas away from the fasteners cannot be ignored. Assumption 2 is not satisfied for direct- attached gypsum board and will cause an overestimation of the predicted VLD (transmission underestimated). The presence of ill-defined areas also means that the total transmitted power is not proportional to the number of fasteners, and assumption 6 is not satisfied.
4.3. Is transmission sensitive to contact area at fastening points?
A review of the open literature suggests that ordinary mobilities (e.g., Eqn. 1 & 2) based on thin plate theory are almost always used when modelling power transmission from beams and plates using the mobility
approach. In doing so, it is implicit that the contact area at the fastener is sufficiently small that it approximates the “infinitely small” excitation area assumed in formulating the ordinary mobilities.
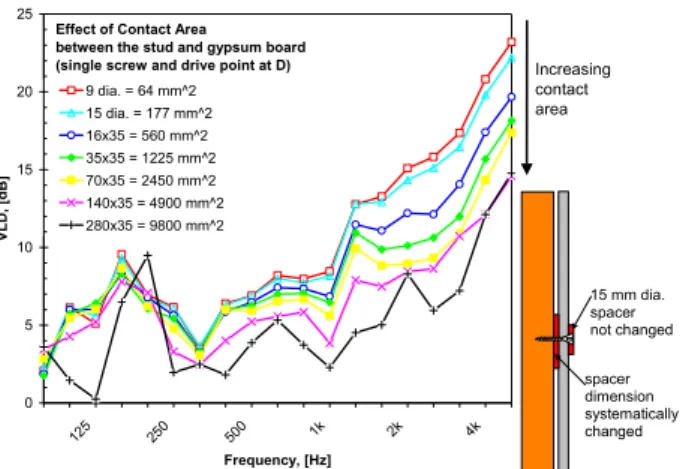
It is not possible to easily measure the “effective contact area”, i.e., where the stud and gypsum board have the same velocity, so this assumption cannot be assessed directly. However, it is possible examine the change in transmission as a result of a change to a “well-defined” area created by a 2 mm thick Plexiglas spacer placed between the stud and the gypsum board at the fastener. A strong sensitivity to the area of the spacer strongly suggests that the assumption may not be valid and one should use more sophisticated mobility measures [5,6] that include the “effective contact area”.
Figure 5: Measured velocity level difference as a function of the contact area between the stud and the gypsum board.
Figure 5 shows that the VLD, and hence transmission, is strongly dependent on area of the spacer separating the stud and gypsum board, especially in the high frequencies where spacer dimension is significant relative to the bending wavelength. There is systematic trend of reduced VLD (increased transmission) as the area of the spacer is increased. It can also be seen that there is a frequency at which the increased size affects the VLD. This frequency moves to lower frequencies as the size of the spacer is increased.
It would not be unrealistic to assume that the “effective contact area” is defined by the width of the stud and a length at least equal to the width, namely 35x35 mm. With such a contact area the VLD for frequencies above 1 kHz would be at least 5 dB lower than that measured for the smallest spacer a 9 mm disc (having an area approximately equal to the head of the screw). Until the “effective contact area” between the stud and gypsum board can be accurately measured it can only be stated with certainty that VLD predictions using ordinary mobilities will be overestimated.
(underestimates transmission). This error is likely very significant, especially in the high frequencies.
It should be noted that the contact area between the screw head and the gypsum board was also investigated but was found not to be significant by comparison. This was attributed to the difference in thickness between the stud and gypsum board as wells as the difference in the ratio of E/G (modulus of elasticity to shear modulus), which for the stud is approximately 16 as opposed to about 2 for the gypsum board.
5. Discussion and conclusions
The effect of all the assumptions could not be reported in this summary paper, however the three examined in this paper are thought to be most important for practical wood stud walls. The assumption of no volumetric deformation caused an underestimation of the predicted VLD. To overcome this it will be necessary to treat the stud as a deep beam however as a first order approximation it might be possible to introduce a transfer matrix for a rod-like element to relate the velocity on receive side to that on the source side.
Effect of Contact Area between the stud and gypsum board (single screw and drive point at D)
0 5 10 15 20 25 125 250 500 1k 2k 4k Frequency, [Hz] V L D, [dB] 9 dia. = 64 mm^2 15 dia. = 177 mm^2 16x35 = 560 mm^2 35x35 = 1225 mm^2 70x35 = 2450 mm^2 140x35 = 4900 mm^2 280x35 = 9800 mm^2 Increasing contact area 15 mm dia. spacer not changed spacer dimension systematically changed
The measured VLD was found to be very sensitive to the contact area between the stud and the gypsum board, and using mobilities that assume an infinitely small area will tend to overestimate the VLD. The necessary theoretical expressions exist for thick plates and deep beams, but require estimates of the contact area, which currently do not exist for wood/gypsum board interfaces. This is suggested for future work. Predictions that assume there are no “ill-defined” contact areas between the fasteners will tend to overestimate the VLD. Work to evaluate a better approximation should be conducted.
The bias introduced by the various assumptions appear not to have the same sign so it is possible to achieve reasonable agreement between measurement and prediction despite serious difficulties with the theory.
6. References
1 Cremer, L., Heckl, M., and Ungar, E.E., Structure Borne Sound, Springer Verlag, second ed., New York, 1988.
2 Craik R.J.M., Wislon, R., (1995), “Sound transmission through masonry cavity walls”, Journal of Sound and Vibration, Vol. 179, pp. 79-96.
3 Wislon, R., Craik R.J.M., (1996), “Sound transmission through dry lined walls”, Journal of Sound and Vibration, Vol. 192, pp. 563-579. 4 Craik R.J.M., Smith R.S., (2000), “Sound transmission through lightweight parallel plates. Part II: structure borne sound”, Applied Acoustics, Vol. 61, pp. 247-269.
5 B.A.T Petersson, M. Heckl, (1996), “Concentrated excitation of structures,” J.S.V. Vol. 196(3), pp. 295-321.
6 B.A.T Petersson, M. Heckl, (1999), “Concentrated force excitation of deep beams,” J.S.V. Vol. 224(2), pp. 243-266.
![[PDF] Formulaires double affichage Access 2007 | Cours informatique](data:image/gif;base64,R0lGODlhAQABAIAAAP///wAAACH5BAEAAAAALAAAAAABAAEAAAICRAEAOw==)