Characterizing and Designing Engine Manifolds for
Single-Cylinder Engine Turbocharging
by
Michael Buchman
Submitted to the Department of Mechanical Engineering
in partial fulfillment of the requirements for the degree of
PhD in Mechanical Engineering
at the
MASSACHUSETTS INSTITUTE OF TECHNOLOGY
September 2018
Massachusetts Institute of Technology 2018. All rights reserved.
Signature redacted
A uthor ...
...
Department of Mechanical Engineering
July 20, 2018
Certified by ...
Signature redacted..
Amos Winter
Associate Professor
Thesis Supervisor
Accepted by...Signature
redacted
Rohan Abeyaratne
Chairman, Department Committee on Graduate Theses
MASSACHUSES INSTiTUTE OF TECHNOWGY
OCT 0
2
2018
LIBRARIES
Characterizing and Designing Engine Manifolds for
Single-Cylinder Engine Turbocharging
by
Michael Buchman
Submitted to the Department of Mechanical Engineering on July 20, 2018, in partial fulfillment of the
requirements for the degree of PhD in Mechanical Engineering
Abstract
Turbocharging can provide a cost-effective means for increasing the power output and fuel economy of an internal combustion engine. It is commonly used on multi-cylinder engines, but not on commercial single-cylinder engines due to the phase mismatch between the exhaust stroke (when the turbocharger is powered) and the intake stroke (when the engine requires the compressed air). This work explores overcoming the phase mismatch problem by adding an air capacitor: a volume added in series with the intake manifold between the turbocharger compressor and the engine intake. The function of the air capacitor is to buffer the output from the turbocharger compressor and deliver pressurized air during the intake stroke.
This research focuses on demonstrating the feasibility of using an air capacitor to enable turbocharging single cylinder internal combustion engines. An analytical model of the system was created from first principles, which showed that the air capacitor turbocharging method could increase power output by up to 40% without heat transfer and up to 70% with heat transfer elements included in the intake man-ifold (such as an intercooler). An initial, proof-of-concept experiment was created using a generator as a dynamometer. With an air capacitor volume seven times the engine capacity, this setup was able to produce 29% more power compared to the same engine naturally aspirated.
A numerical model was developed in Ricardo Wave to predict the performance of turbocharged single cylinder engines with air capacitors under different condi-tions. An experimental engine with accompanying dynamometer was constructed to demonstrate the effects of manifold sizing on engine performance and to experimen-tally validate the model. The experiment showed that the model was able to predict power output with an accuracy of 8% of peak power, fuel consumption within 7% er-ror, air mass flow rates with 10% erer-ror, and manifold pressures within 7% error. The model was then combined with a simulated annealing optimization scheme in Matlab in order to conceptualize designs for the geometry and timings of single-cylinder tur-bocharged engines intended for different commercial applications. The optimization showed that adding an air capacitor and turbocharger to a 0.44L engine, with slight
modifications to the valve and injector timings, could increase power by 88% com-pared to natural aspiration. By also modifying the bore and stroke, the turbocharged engine with an air capacitor could reduce fuel consumption by 8% compared to a naturally aspirated engine with equivalent peak power output.
Thesis Supervisor: Amos Winter Title: Associate Professor
Acknowledgments
The last five years I have been lucky enough to have an amazing support network to advise and help me with both research and life. The person most critical to my success was my advisor, Professor Amos Winter. He offered me the opportunity to work on this project. Over the course of my research he was there to guide me when anything went wrong and encourage me to make the most of my successes. The process of obtaining a PhD would have been significantly more difficult without his support and guidance throughout the process. It is reassuring to know that when I need guidance in the future Amos will be there to give me advice.
I am grateful to have had the support of my fellow members of the of Global Engineering and Research lab (GEAR Lab) for the last five years. As far as I can tell, there is no lab on campus that is as supportive and social as GEAR. When I started, the lab was one year old and there were seven of us. Whenever I had any problems I could count on Dan Dorsch to help me debug them. I could also count on Dan to help me design parts, move my experiment, machine items, be a shop buddy, and find free food around campus. If I needed help with heat transfer, fluids, or general guidance Natasha Wright was there to help. Murthy has always been a great resource for design advice. I could always count on Jaya and Guillermo to be there to assist me and to be available for bar trivia. Our administrator Cakky was key to me being able to get anything done. Without her my experiment would still be a series of purchase orders waiting to be filed and nothing would get done. My work would be significantly worse if I did not have Brett and Dev to help me edit my papers and thesis. The whole of GEAR Lab should be able to take partial credit for my success at MIT. Without them this project would have taken longer and my time in graduate school would have been considerably less joyful.
I would not be here without the many MIT faculty members who were always around to provide guidance, support, and help with any issues I was having. I am grateful to my committee members, Professor Ahmed Ghoniem, Professor Wai Cheng, and Dr. Luca Marmorini who helped me refine my research and gave me guidance
when I ran into problems.
My family has always been there for me and supported me even from three thou-sand miles away. They went beyond the traditional family support of being there for personal issues. I always had difficulty writing and when I was diagnosed with dyslexia in high school my difficulties started to make sense. My mom, dad, sister, and brother in law went out of their way to help me with my writing difficulties. They would help look over and edit drafts of papers (including this thesis) to catch any errors I made. Without them I would have struggled to learn how to effectively communicate my ideas in writing.
Without my amazing group of friends I would have been miserable. My girlfriend, Kaitlyn, has provided support, kept me amused, and fed me during the most stressful periods of graduate school. Adin, Max, and my other friends from undergraduate school have been available at a moment's notice to help me move or to play board games. All the friends I have made in graduate school have made me appreciate how great this department is. They were there to help me study for Quals, move my experimental setups, and organize fun events.
The MIT community is special to me. I have been here for nine years, or one third of my life so far. There is a reason I chose to keep coming back, first after undergraduate studies, and then after completing my Master's degree. MIT is a unique place in that the most intelligent people in the world make amazing things happen, yet everyone is always supportive and eager to help those around them learn. In addition to learning through classrooms I have had the opportunity to learn by building a solar car, founding a maker space, trying different research projects, and interacting with those around me.
There are a couple of friends who are not in GEAR Lab or associated with my research in any way who still gave of their time to help me with problems I could not solve on my own. Ari Frankel helped me with some math to describe the flows during my master thesis, work which saved me a significant amount of time. Kevin Cedrone helped me debug both my initial experiment and my current dynamometer and found bugs that no one else could find in both setups. Sebastian Ahling saved
me when my research engine failed. He helped me find the parts I need and fix the system.
When I was a first-year graduate student Dan Dorsch got me and a couple of other friends to go to a couple of meetings about maker spaces on campus. Within two years we built Maker Workshop, an MIT community maker space. This space has provided me with a place to work on both personal projects and research as well as an amazing group of friends.
This work would not be possible without financial sponsorship. For the first year of research Professor Winter believed in me enough to fund this research out of his startup package. Afterwards, I was sponsored by the Tata Center for Technology and Design at MIT and by the National Science Foundation. This material is based upon work supported by the National Science Foundation Graduate Research Fellowship under Grant No. 1122374. Any opinions, findings, conclusions or recommendations expressed in this material are those of the authors(s) and do not necessarily reflect the views of the National Science Foundation.
Contents
1 Introduction 1.1 Motivation.. . . . . 1.2 Turbocharging Background. . . . . 1.3 Previous Work . . . . 2 Computational Model 2.1 Goals of Model . . . .. 2.2 Model Overview ... 2.2.1 Valves ... 2.2.2 Engine Sub-models 2.2.3 Cylinder Geometry 2.2.4 Ducts & Orifices . . 2.2.5 Ambient Conditions 2.2.6 Fuel Injection . . . . 2.2.7 Turbocharger . . . . 2.2.8 Integration with Matlab 2.3 Model Results . . . .2.3.1 Initial Model . . . .
2.3.2 Capacitor Size Effects 2.3.3 Heat Transfer Effects 2.3.4 Injection Timing . . Simulink 9 25 27 33 36 41 . . . . 4 1 . . . . 4 2 . . . . 4 3 . . . . 4 4 . . . . 4 6 . . . . 4 6 . . . . 4 6 . . . . 4 6 . . . . 4 7 . . . . 4 8 . . . . 4 8 . . . . 4 8 . . . . 5 2 . . . . 5 8 . . . . 6 2
3 Experimental Setup
3.1 Goals of Experimental Setup . . . . 3.2 Dynamometer . . . .
3.3 E ngine . . . .
3.4 Turbocharger . . ... . . . .
3.5 M anifolds . . . .
3.6 Sensors, Data Acquisition, & Controls . . . . 3.6.1 Em issions . . . . 3.6.2 Pressure . . . . 3.6.3 Temperature . . . .
3.6.4 Fuel Mass . . . .
3.7 Steady State Data Output and Analysis . . . . 3.7.1 Statistical Analysis . . . .
3.7.2 Calculating Air Flow . . . .
3.7.3 Other Steady State Calculated Values . 4 Steady State Experiment
4.1 Goals of Experiment . . . . 4.2 Experimental Procedure . . . . 4.2.1 Experimental Setup Procedure . . . . 4.2.2 Experimental Operating Procedure . . . 4.3 Manifold Volume Experiments . . . .
4.3.1 Air Mass Flow . . . .
4.3.2 Power Density . . . . 4.3.3 Fuel Economy . . . . 4.3.4 Pressures . . . . 4.3.5 Temperature . . . . 4.3.6 Emissions . . . . 4.4 Model Validation with Garrett Turbocharger . . 4.5 Conclusion . . . . 10 65 65 68 70 70 71 72 74 74 76 76 78 80 80 83 85 . . . . . 85 . . . . . 85 . . . . . 86 . . . . . 87 . . . . . 87 . . . . . 88 . . . . . 89 . . . . . 91 . . . . . 94 . . . . . 95 . . . . . 97 . . . . . 98 . . . . . 108
5 Transient Response 111 5.1 Using an Analytical Model to Approximate Characteristic Transient
Response Tim e . . . . 112
5.2 Speed Response Experiment . . . . 118
5.3 Torque Response Experiment . . . . 122
5.4 Conclusion . . . . 123
6 Computational Model Multi-Variable Optimization 125 6.1 Sensitivity Analysis . . . . 128
6.2 Optimization Results . . . . 130
6.2.1 Designing a 6.8 kW Engine to Minimize Fuel Consumption . . 130
6.2.2 Retrofitting an Engine to Minimize Fuel Consumption . . . . 134
6.2.3 Retrofitting a Kohler Engine to Maximize Power . . . . 138
6.2.4 Designing an Engine for High Altitude Applications . . . . 141
6.3 Conclusion . . . . 144
7 Conclusions 147 7.1 Contribution . . . . 148
7.2 Future W ork . . . . 149
7.3 Single Cylinder Engine Turbocharging Guidelines . . . . 150
List of Figures
1-1 Block diagram that shows the layout of the air capacitor system. . . 26 1-2 Plot that compares the percent of population involved in agriculture to
the percent of a country's GDP due to agriculture with select countries highlighted. The dashed line represents an efficient agricultural sector where percent employment matches percent of GDP due to agriculture.
[9 , 41 . . . . 28
1-3 Map that compares per capita GDP with yield. Selected countries are
highlighted with their flag. [4, 221 . . . . 28
1-4 Map that compares the level of mechanization to farm yield in selected
regions.[4, 221 . . . . 29
1-5 Left: Plot that compares available power to farm yield in different provinces in India. Right: Plot that compares available power to farm yield in India over time. This plot also shows the growing population
that needs to be fed.[3, 22, 32, 501 . . . . 30
1-6 Top: Diagram of how a supercharger is integrated into an engine sys-tem. Bottom: figures of how three common types of superchargers
w ork [7] . . . . 34
1-7 Left: Diagram of a turbocharger [8] Right: Diagram of how a tur-bocharger is integrated into an engine system. . . . . 35 1-8 Diagram of the simple mass flow model used to describe flow in the
intake m anifold . . . . 36
1-9 Plot showing the results for the simple mass flow model with and
with-out heat transfer. In this scenario the turbocharger is operating at
pressure of one bar. . . . . 39
1-10 The initial experiment used to validate the air capacitor theory. . . . 40
1-11 Results of the initial experiment compared to the simple mass flow
model with no heat transfer and a turbocharger pressure of 13 psi
(waste-gate pressure). . . . . 40
2-1 Block diagram that shows the layout of the naturally aspirated model,
each subsystem is defined by a series of parameters. . . . . 42
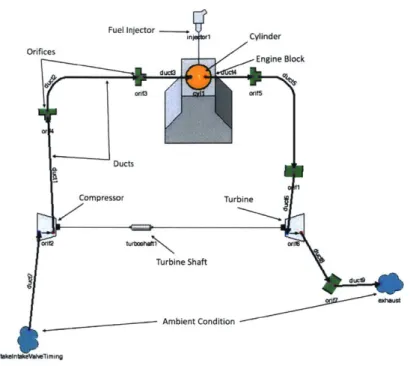
2-2 Block diagram that shows the layout of the turbocharged engine model,
each subsystem is defined by a series of parameters. . . . . 43
2-3 Plot showing the valve lift profile used in the Ricardo Wave mode. . . 44 2-4 Ricardo Wave high performance valve flow model. This model was
used to estimate the flow through both the intake and exhaust valve. 45
2-5 Left: Real compressor map for the Garrett GT0632SZ. Right: Garrett
GT0632SZ compressor map that was recreated in Ricardo Wave. . . . 47
2-6 Intake manifold used in the model. The ducts are modeled as rubber
while the capacitor is modeled as steel. This is identical to the manifold
dimensions used in the experiment. . . . . 49
2-7 Model comparison of the naturally aspirated case to the turbocharged
case (in the configuration that matches the experiment). Top left: Power output as a function of equivalence ratio. Top right: Brake-specific fuel consumption as a function of power output. Bottom left:
Nitrous oxide emissions as a function of power output. . . . . 50
2-8 Model comparison of the losses in the naturally aspirated case to the
losses in the turbocharged case (in the configuration that matches the experiment). Top left: Heat transfer losses as a function of power. Top right: Engine friction losses as a function of power. Bottom Left:
Pumping losses as a function of power. . . . . 51
2-9 Comparison of pressure vs. volume plot for the turbocharged case to the naturally aspirated case at 3500 RPM with an equivalence ratio of 2. 1->2: Intake stroke. 2-93 Compression Stroke. 3 -+ 4: Power Stroke. 4- 1: Exhaust stroke. The loop made by 4--+1---2 is the pumping loop. The loop made by 1-+3-4 is the power loop. . . . . . 52 2-10 Comparison of temperature vs. entropy for the turbocharged case to
the naturally aspirated case at 3500 RPM with an equivalence ratio of 2. 1->2: Compression. 2--+3 Heat Addition. 3 4: Expansion. 4-41: H eat Rejection. . . . . 53 2-11 Intake manifold used in variable volume model where the ducts are
modeled as rubber while the capacitor is modeled as steel. The volume is varied by changing the length of the manifold. . . . . 54 2-12 The results of the variable volume model for an engine running at an air
to fuel equivalence ratio of 2. The effect of manifold volume on power, brake specific fuel consumption, and air mass flow rate are shown. . . 54 2-13 The effect of manifold volume on engine losses for an engine running at
an air to fuel equivalence ratio of 2. The losses are shown as a percent of the fuel energy that they consume. . . . . 55 2-14 Comparison of the inlet mass flow of air in the capacitor throughout
the cycle for the large air capacitor (10 times engine volume) and the small air capacitor (2 times engine volume) sfor an engine running at 3500 rpm with an equivalence ratio of 2. The unsteadiness in the air mass flow during the compression, power and wxhaust strokes are due to pressure waves in the air capacitor. . . . . 56 2-15 Comparison of the air density in the capacitor throughout the cycle
for the large air capacitor (10 times engine volume) and the small air capacitor (2 times engine volume) for an engine running at 3500 rpm with an equivalence ratio of 2. . . . . 57
2-16 Comparison of the pressure in the capacitor thought the cycle for the large air capacitor (10 times engine volume) and the small air capacitor (2 times engine volume) for an engine running at 3500 rpm with an equivalence ratio of 2 . . . . . 57 2-17 Model comparison of the naturally aspirated case to the standard
tur-bocharged case (in the configuration that matches the experiment) and the high heat transfer turbocharged case. Top left: Power output as a function of equivalence ratio. Top right: Brake specific fuel consump-tion (BSFC) as a funcconsump-tion of power output. Bottom Left: Nitrous oxide emissions as a function of power output. . . . . 59 2-18 Model comparison of engine losses in the naturally aspirated case, the
standard turbocharged case (in the configuration that matches the ex-periment), and the high heat transfer turbocharged case. Top left: Heat transfer losses. Top right: Friction losses. Bottom Left: Pump-ing losses. . . . . 60 2-19 Comparison of Pressure Vs. Volume for the standard turbocharged case
and the intercooled turbocharged case at 3500 RPM with an equiva-lence ratio of2. . . . . 61 2-20 Comparison of Temperature vs. Entropy for the standard turbocharged
case to the inter cooled turbocharged case at 3500 RPM with an equiv-alence ratio of 2. . . . . 62 2-21 The effect of injection timing on an air capacitor turbocharged 3500
RPM engine with an air to fuel equivalence ratio of 2. . . . . 63 3-1 Block diagram that shows the layout of the experimental setup. . . . 66 3-2 Photographs of the experimental setup with key parts identified. A:
Full view of dynamometer room (Fig. 3-1). B: Focused view of the dynamometer and engine platform. C: Focused view of the controls system . . . . . 66
3-3 Photograph of the dynamometer installed and mounted to the engine p allet. . . . . 69 3-4 Photograph of the IHI turbocharger. . . . . 71 3-5 Diagram of the five intake manifold configurations tested initially.
Fig-ure is not to scale. . . . . 73 3-6 Photographs of the data acquisition and controls setup. Left: the
operator control computer. Right: Labeled DAQ components. .... 74 3-7 Photograph of the emissions probe sampling setup. . . . . 75 3-8 Photograph of the thermocouple probe with airtight fitting. . . . . . 76 3-9 Photograph of the fuel measurement system. . . . . 77 3-10 Sample data from the steady state fuel economy tests conducted at
3500 RPM & 6.8 kW. Individual points represent the load cell data collected at 4 Hz. The line is the best fit line generated by the Matlab linear regression function. The fuel consumption is 263.33 grams per kW hour with a 95% confidence interval of t 0.55 grams per kW hour. 78 3-11 Sample data for a steady state test of the naturally aspirated engine
configuration at 6.8 kW & 3500 RPM. Left: Raw data from the load cell showing the mass of fuel in the tank over time. Each line is a single load test. The load starts low and increases with each test. The gaps between lines represent the periods between tests where data are not collected. Right: Calculated brake specific fuel consumption using a linear regression (Fig. 3-10). . . . . 79 3-12 Plot of the error in the steady state fuel economy as a function of test
duration and sampling frequency . . . . 79 3-13 Flow for data processing. . . . . 80 4-1 Air mass flow rate through the engine for the five turbocharged cases
(RHB 31 turbocharger) and the naturally aspirated case, for all three speeds... ... 88
4-2 Plot of the equivalence ratio of the engine for different speeds and powers. The solid lines show the map for the naturally aspirated (NA) case and the dotted lines show the map for the turbocharged case with
the largest capacitor size (RHB 31 turbocharger). . . . . 90
4-3 Equivalence ratio as a function of power output for the RHB31 tur-bocharger in the five manifold cases and the naturally aspirated case
at low, medium, and high speed operation. . . . . 91
4-4 Break Specific Fuel Consumption vs. Power for all three speeds (RHB
31 turbocharger). . . . . 92
4-5 Pumping work vs. Power for all three speeds (RHB 31 turbocharger). 93
4-6 Brake Specific Fuel Consumption adjusted for pumping loss vs. Power
for all three speeds (RHB 31 turbocharger). . . . . 93
4-7 Plots of the engine intake air pressure as a function of power output for the five turbocharged cases and the naturally aspirated case at 2500,
3000, & 3500 RPM (RHB 31 turbocharger). . . . . 94 4-8 Plots of the engine exhaust air pressure as a function of power output
for the five turbocharged cases and the naturally aspirated case at 2500,
3000, & 3500 RPM (RHB 31 turbocharger). . . . . 95
4-9 Plots of the engine intake temperature as a function of power output for the five turbocharged cases and the naturally aspirated case at 2500,
3000, & 3500 RPM (RHB 31 turbocharger). . . . . 96
4-10 Plots of the engine exhaust temperature as a function of power output for the five turbocharged cases and the naturally aspirated case at 2500,
3000, & 3500 RPM (RHB 31 turbocharger). . . . . 96
4-11 Plots of brake specific NOx output as a function of power output for the five turbocharged cases and the naturally aspirated case at 2500,
3000, & 3500 RPM (RHB 31 turbocharger). . . . . 98
4-12 Plots of nitrous oxide emissions as a function of exhaust temperature for the five turbocharged cases and the naturally aspirated case at 2500,
3000, & 3500 RPM (RHB 31 turbocharger). . . . . 99
4-13 Plots of CO specific emissions as a function of power output for the five turbocharged cases and the naturally aspirated case at 2500, 3000,
& 3500 RPM (RHB 31 turbocharger) . . . . . 99
4-14 Plots comparing the model predictions to experimental results for air to fuel equivalence ratio vs. power output for a power sweeps at 3500
RPM (Garrett GTO632SZ turbocharger) . . . . 102
4-15 Plots comparing the the model predictions to experimental results for power vs. fuel consumption ratio for a power sweeps at 3500 RPM
(Garrett GTO632SZ turbocharger). . . . . 103 4-16 Plots comparing the model predictions to the experimental results for
power output vs. air mass flow rate for a power sweeps at 3500 RPM (Garrett GTO632SZ turbocharger). . . . . 104 4-17 Plots comparing the model prediction to experimental results for power
output vs. pressure for the turbocharged inter-cooled case during power sweeps at 3500 RPM (Garrett GTO632SZ turbocharger). . . . 105 4-18 Plots comparing the power output vs. nitrous oxide emissions for
ex-periment, original model and calibrated model results for the naturally aspirated case during power sweeps at 3500 RPM (Garrett GTO632SZ turbocharger). . . . . 106 4-19 Plots comparing the power output vs. nitrous oxide emissions for
experiment, original model and calibrated model results for the tur-bocharged case during power sweeps at 3500 RPM (Garrett GTO632SZ turbocharger). . . . . 106 4-20 Plots comparing the power output vs. nitrous oxide emissions for
experiment, original model and calibrated model results for the tur-bocharged and intercooled case during power sweeps at 3500 RPM
(Garrett GTO632SZ turbocharger). . . . . 107
5-1 Diagram of the transient mass flow model. . . . . 115
5-2 Plot of the pressure increase in the air capacitor as a function of time for the pump-up model. . . . . 116 5-3 Plot of pressure increase in the 7 times volume air capacitor as a
func-tion of time for the combined turbocharger transient model at 3000
RPM with a load varying from 0 Nm to 13.5 Nm. . . . . 117
5-4 Left: Model Prediction of pressure response profile for different capac-itors being pressurized from 1 bar to 1.5 bar. Right: Characteristic air capacitor pressurization time as a function of capacitor size for a capacitor being filled from 1 bar to 1.5 bar . . . . 118 5-5 Plot of sample speed response from a set of three naturally aspirated
tests. The blue line-is the dynamometer speed data. The red circles represent the end points (initial and final time) for the speed response time test. The green lines represent the speed response rate. . . . . . 119 5-6 Speed response for the large capacitor loaded case shown next to the
engine's intake pressure. The intake pressure quickly responds to speed changes in a single cylinder turbocharged engine with an air capacitor 120 5-7 Adjusted speed response rate for the loaded and unloaded speed
re-sponse tests. The error bars represent the 95% confidence interval. . . 121 5-8 Speed response time for the loaded and unloaded speed response tests.
The error bars represent the 95% confidence interval. . . . . 122 5-9 Experimental results for the average normalized torque and pressure
response to a torque input signal at 3000 RPM. Each line represents the average response from multiple tests for each engine configuration. 123
6-1 Flow chart of the optimization method combining the computational model of Ricardo Wave and Matlab simulated annealing. . . . . 125 6-2 Power Output as a function of air to fuel equivalence ratio for the fully
optimized engine compared to the baseline naturally aspirated engine. 132 6-3 Fuel economy as a function of power output for the fully optimized
engine compared to the baseline naturally aspirated engine. . . . . 132
6-4 Engine losses as a function of power output for the fully optimized engine compared to the baseline naturally aspirated engine. . . . . 133 6-5 Entropy vs. temperature for the fully optimized engine's cycle
com-pared to the baseline naturally aspirated engine's cycle. . . . . 133 6-6 Power output as a function of air to fuel equivalence ratio for the
fuel consumption optimized retrofitted engine compared to the baseline naturally aspirated engine. . . . . 136 6-7 Fuel economy as a function of power output for the fuel consumption
optimized retrofitted engine compared to the baseline naturally aspi-rated engine. . . . . 136 6-8 Power output as a function of air to fuel equivalence ratio for the
power maximized retrofitted engine compared to the baseline naturally aspirated engine. . . . . 138 6-9 Fuel economy as a function of power output for the power maximized
retrofitted engine compared to the baseline naturally aspirated engine. 140 6-10 Power output as a function of air to fuel equivalence ratio for the high
altitude optimized engine compared to the baseline naturally aspirated
engine at high altitude. . . . . 141
6-11 Fuel economy as a function of power output for the high altitude op-timized engine compared to the baseline naturally aspirated engine at
high altitude. . . . . 143
List of Tables
1.1 Cost breakdown for turbocharging a high-end diesel engine based on off-the-shelf prices in the United States and an analogous price break-down for a low cost system based on conversations with partners in
India and engines made by USHA. . . . . 32
1.2 Cost breakdown for turbocharging a standard Indian diesel engine based on off-the-shelf prices in India and on conversations with our partners in India. . . . . 33 2.1 Friction constants that were obtained from literature [46] .. . . . . 45 2.2 Kholer engine geometry based on data from manufacturer [411 . . . . 46
3.1 Taylor DE20 Eddy Current Dynamometer specifications . . . . 68 3.2 Sherborne Sensors U400 Load Cell specifications . . . . 69 3.3 Kholer KD440 Air Cooled Diesel Engine specifications (Data From
M anufacturer [41]) . . . . 70 3.4 Testo 350 Exhaust Gas Analyzer specifications [65] (my stands for the
m easured value). . . . . 75 3.5 Omega load cell specifications (data from manufacturer [491) . . . . . 77 3.6 Equations for steady state values . . . . 83 4.1 NOx calibration parameters . . . . 107 5.1 Characteristic value ranges used to approximate spool time of the
tur-bocharger. [29, 5] . . . . 114
6.1 Adjusted variables in the engine optimization experiments. . . . . 127 6.2 The sensitivity of engine performance metrics to different variables . . 129 6.3 The optimized values and the sensitivity of engine performance metrics
to different variables for the full engine optimization. . . . . 131 6.4 The optimized values and the sensitivity of engine performance metrics
to different variables fuel consumption minimized retrofitted engine. . 135 6.5 The optimized values and the sensitivity of engine performance metrics
to different variables for the power maximized retrofit engine . . . . . 139 6.6 The optimized values and the sensitivity of engine performance metrics
to different variables for the high altitude optimized engine. . . . . . 142
Chapter 1
Introduction
Turbocharging is a cost effective way to increase the performance of multi-cylinder diesel engines: it can boost power output, increase fuel efficiency, improve emissions quality [34, 67, 19], lower cost per unit power, and reduce weight per unit power [67, 26, 621. A turbocharged engine can be smaller size than a naturally aspirated engine, which reduces frictional area between the piston and the cylinder and, thus, will have fewer frictional losses. Due to larger rates of air flow with turbocharging, there is also better heat transfer in the engine, which can reduce thermal losses [671. According to Makartchouk [441, turbocharging a diesel engine increases the mechanical efficiency between 2%-10%. In practice, most stationary applications for turbocharged engines will result in a 5% efficiency gain compared to naturally aspirated engines of the same power [441.
Turbocharging single-cylinder engines is not currently implemented commercially due to the mismatch between the intake and exhaust strokes, despite the advantages mentioned earlier [111. When the engine is exhausting (and the turbocharger is being powered), the intake valve is closed and the compressed air from the turbocharger has nowhere to flow.
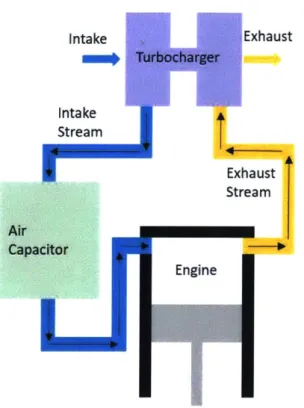
Previous work has demonstrated that turbocharging single-cylinder engines can be achieved by buffering the intake air between the exhaust and intake strokes using an air capacitor: an additional volume added in series to the intake manifold (Fig. 1-1) [14]. The capacitor stores air compressed by the turbocharger during the exhaust
Intake Exhaust m Turbocharger Intake
r
Stream Exhaust Stream Air Capacitor EngineFigure 1-1: Block diagram that shows the layout of the air capacitor system.
stroke and then uses the pressure in the vessel to force air into the cylinder during
the intake stroke.
The goal of this research is to analyze the commercial viability of single-cylinder
turbocharging technology by understanding how adding a turbocharger and an air capacitor affects emissions, fuel economy, and power density. By understanding these effects it will be possible to design an engine and optimize its timing for turbocharging.
This thesis builds on an analytical model and an initial experiment that
demon-strate the feasibility of turbocharging a single-cylinder engine using an air capacitor. In order to achieve this, a computational engine model is presented that is used to predict the emissions, efficiency, and power output of a single-cylinder turbocharged engine with an air capacitor. An experiment was built in order to demonstrate the effect of air capacitor volume on power output, emissions, manifold pressure, tran-sient response, and fuel consumption on a physical engine. This experiment was also used to validate the computational model. Finally the computational model was inte-grated with a simulated annealing optimization scheme in order to recommend engine
designs and modifications for different applications.
1.1
Motivation
The primary value proposition of this technology for engine users is to improve the specific power for low-cost, engine-powered equipment, such as small vehicles, trac-tors, and generatrac-tors, while maintaining or improving fuel economy. Turbocharging increases power by increasing the amount of oxygen in the engine available for com-bustion [671. Turbocharging single-cylinder engines can improve fuel economy by increasing power density. This allows smaller engines to produce the same power output as a larger engine, but with fewer frictional losses due to the smaller frictional area between the piston and the cylinder
134,
67]. However, care should be taken as turbocharging can also increase fuel consumption by increasing pumping losses[34, 671.
The value of this technology is especially apparent in the agricultural sector. In many developing countries the agricultural sector is inefficient, while a significant portion of the population is involved in the agricultural sector, which only makes up a relatively small portion of GDP (Fig. 1-2) [9, 3]. This results in population migration, a shortage of agricultural workers, and a large population of subsistence farmers. This problem is compounded by poor yield due to a lack of proper agricultural tools, fertilizer, and available farm power [501. Countries with a lower GDP tend to have worse yield than wealthier countries (Fig. 1-3) [9, 4].
Farm mechanization is closely correlated to farm output (Fig. 1-4, 1-5). Multiple studies have been commissioned by the Indian government to generate ideas on how to address agricultural issues in India. Two of the key studies were done by the Bhopal Indian Counsel of Agricultural Research and by the Indian Department of Agriculture [45, 501. It was found that while there was large growth in farm manpower in the 1980's and 1990's, over the last decade the growth in available farm manpower has slowed to a little over 2% per year. The other key finding was that increasing farm mechanization could save seed and fertilizer utilization by 15-20%, increase crop yield
0'
~d
A? C>e qW Opde-A O L 0 4 . %W;; 0 V V V V -V V -
4
-V VV ) {~K S*
0 10 20 30 40 50 60 70 80Percent of Population Involved in Agriculture
Figure 1-2: Plot that compares the percent of population involved in agriculture to the percent of a country's GDP due to agriculture with select countries highlighted. The dashed line represents an efficient agricultural sector where percent employment matches percent of GDP due to agriculture. [9, 4]
0 0 0 0 0
.A~*
-S $ .ii S S 0 0 S ~ S S 00 Sc S 0 0*
0 * 0 0 0 * * S $0 $10,000 $20,000 $30,000 $40,000 GDP Per Capita S 0 =0 S S 0 0 $50,000 $60,000 $70,000 $80,000Figure 1-3: Map that compares per capita GDP with yield. Selected countries are
highlighted with their flag. [4, 22]
28 wl 0 0 C 0) 45 40 35 30 25 20 15 10 5 0
S
El
0 to 10,000 9,000 8,000 7,000 6,000 5,000 4,000 3,000 2,000 1,000 0 4Russia Europe 80%, 2388kg USA 95%, 5373kg 95%, 6624kg Africa Brazil 75%, 3828kg Argentina 75%, 3918kg
% of Agriculture Mechanized, Yield Per Hectare
Figure 1-4: Map that compares the level of mechanization to farm yield in selected
regions.[4, 22]
by 5-20%, reduce manual labor by 20-30%, and increase farm productivity by 10-15%
[59, 101. Mechanization is made more urgent since crop yield has to increase by a
third over the next couple of decades, in order to feed the growing population of
India. Figures 1-4 & 1-5 show how farm yield is correlated with available power.
Turbocharging single-cylinder engines is an effective way to increase the available
power for farmers since over a million single-cylinder engines are sold every year in
India.
Turbochargers increase the power density of engines, which is crucial for weight
sensitive applications such as aircraft, and portable equipment such as irrigation
pumps on small farms [13, 22]. Increased power density results in a lighter device,
which improves fuel economy in commercial vehicles [19]. Studies on turbocharging
two-cylinder engines in India showed increased power density (12-25%), reduced
emis-sions, and reduced fuel consumption relative to a naturally aspirated engine [51, 64].
In commercial vehicles, turbocharging has been shown to reduce engine size by
an average of 30% [11]. Adding a turbocharger to an engine costs between 10-20%
of what it would cost to add another cylinder [11]. A study of passenger cars found
-I
6 2
o 1.5
4..
LU
~0.5
+*Population of India (Billions)1 e e-a-Power Availible (Kw/ha)
0 0 0-Foodgrain Yield (T/ha)
0 0
0 1 2 3 4 1961 1971 1981 1991 2001 2011
Power (kW/ha) Year
Figure 1-5: Left: Plot that compares available power to farm yield in different
provinces in India. Right: Plot that compares available power to farm yield in
India over time. This plot also shows the growing population that needs to be
fed.[3, 22, 32, 50]
that there was a $300 advantage in cost of ownership to turbocharging compared to
a naturally aspirated engine, despite the added cost of the turbocharger [24].
Turbochargers could improve multiple aspects of single-cylinder engines and
pro-vide value to manufacturers [11, 22]. The first was is to help meet new emissions
standards. Diesel emissions can cause environmental damage and impact health both
chronically and acutely, and with the large volume of single-cylinder engines sold each
year, even incremental improvements in emissions can result in significant
improve-ments in air quality. Therefore, regulatory bodies have set emissions restrictions on
these engines that are constantly tightening. For example, manufacturers in India
must bring their single-cylinder engines up to BS 6 (equivalent to stage 5 European
standards) emissions standards by 2020 [39]. This will be the first time that engines
under 19 kW will have to meet emission standards. The exhaust treatments required
to do this will reduce the mechanical power of the engine due to back pressure [55, 12].
Turbocharging can be used to mitigate some of the performance losses caused by the
emissions after treatment that is required to meet new emissions standards.
Furthermore, turbocharging single-cylinder engines will reduce particulate
emis-sions in high altitude operations by supplying more air to the engine for more complete
combustion. Areas such as the Altiplano Plateau in Bolivia would benefit from this
technology, as 60% of the farms there are at an altitude above 4,000 meters. In addi-tion, local small-scale farmers would also benefit from the power increases provided by turbocharging. Air density, and consequentially engine power output, decreases by over 30% at these high altitudes and turbocharging would help counteract these losses [1, 51.
The target market for this technology is developing world agricultural equipment such as tractors, water pumps, and generators. To ensure that our technology is com-mercializable, an active dialog was created with equipment manufacturers that could use turbocharged single-cylinder engines with air capacitors. Along with Mahindra and Kohler/ Lombardini, additional companies include USHA (one of the largest wa-ter pump manufacturers in India), Peugeot (the largest small scoowa-ter manufacturer in Europe), and Tata Motors (manufacturer of small delivery vehicles). These compa-nies agree that creating a method for turbocharging single-cylinder engines presents an attractive solution to their challenges. USHA did a 'willingness to pay' study for different features in the single-cylinder water pump market in India (1.2 million units a year). They found that farmers would be willing to pay 967 Indian rupees ($15) for better fuel efficiency, and 608 rupees ($9) for each additional 10% power increase. These increases are significant, as they are based on engines that cost approximately 16,500 rupees (~$250) [221. If the technology increases power by 50%, it would pro-vide a total value to farmers of ~3,040 rupees ($48). At scaled production, adding a turbocharger to a small engine costs only 2,500 rupees ($38); the air capacitor, which is only a small canister, would cost negligibly more than a standard intake manifold
[11].
Furthermore, Table 1.1 shows the potential cost advantages of turbocharging based on commercial prices in the United States. Additionally, engines with the tur-bocharged air capacitor technology could fill the gap between the largest air-cooled diesel single-cylinder engine Kohler makes (rated at 7.35 kW) and their smallest air-cooled two-cylinder diesel engine (rated at 14.1 kW). Table 1.2 shows that these trends also exist in India; based on commercial prices and conversations with our partners [21, 22, 111. These analyses demonstrate how our technology can be more economical
Table 1.1: Cost breakdown for turbocharging a high-end diesel engine based on off-the-shelf prices in the United States
system based on conversations with
and an analogous price breakdown for a low cost partners in India and engines made by USHA.
1. Data from the Kohler KD440 engine manual and
namometer. In the experiment this power was achieved
experiments run on our dy-at an air to fuel rdy-atio of 30.
As a result, all of the engine comparisons were done for an air to fuel ratio of 30
[41].
2. Based on experiments on a Kohler engine with a Garrett turbocharger and an intercooler that has yet to be optimized. Engine runs at an air to fuel ratio of 30. Note that at lower air to fuel ratios the turbocharged engine outperforms the naturally aspirated engine by a larger margin. Estimated cost of turbocharger and other compo-nents comes from conversations with Mahindra. Their conservative estimate is that turbocharging adds 20% to the engine cost. [11]
3. Based on our multivariable optimized Kohler engine, designed to maximize power
density and fuel economy at an air to fuel ratio of 30. Estimated cost of turbocharger and other components comes from conversations with Mahindra. Their conservative estimate is that turbocharging adds 20% to the engine cost.[11]
4.
Based on a two-cylinder Kohler KD425-2 engine. This engine is the two-cylinder version of the KD440 used in our experiments. All data are taken from the enginemanual [41].
32
Naturally
Turbocharged
Turbocharged
NA Two
Aspirated
Single-
Single-Cylinder
Cylinder
Single-
Cylinder
Engine
Opti- Engine
4Cylinder'
Engine
mized Model'
Experiment2
Power (kW) at 6.8(rated) 8.62(measured) 10 kW(modeled) 14.1(rated)
an air to fuel 7.3(modeled) 8.58(model)
ratio of 30 7.13(measured) Engine Cost $2624 $2624 $2624 $4,665 (US retail) US Retail Es- - $525 $525 -timated Cost of Additional Components Cost Density 2.6 (W/$) 2.7 (W/$) 3.2 (W/$) 3.0 (W/$) based on US Retail (W/$)
Table 1.2: Cost breakdown for turbocharging a standard Indian diesel engine based on off-the-shelf prices in India and on conversations with our partners in India.
Naturally
As-
Turbocharged
NA USHA Air
pirated
USHA
USHA
Air Cooled
Two
Air
Cooled
Cooled Cylinder Cylinder Engine
Single-Cylinder
Engine2
4Engine'
Peak Power 4.5 kW (rated) 6 kW (estimated) 9.75 kW(rated)
(kW)
Engine Cost 44430 rupees 44430 rupees 88110 rupees
(India retail)
Estimated Cost - 8886 rupees
-of Additional
components
Cost Density 0.10 (W/rupee) 0.11 (W/rupee) 0.11 (W/rupee)
(W/rupee) I
1. Based on data from USHA's standard Air Cooled Engines [21].
2. Based on a 33% power gain which we have shown to be feasible computationally and experimentally [15].
3.Based on the USHA Twin Cylinder Vertical Diesel Engine [21].
than comparable technologies with a lower power per unit of cost.
1.2
Turbocharging Background
An internal combustion engine is limited by the amount of air it can intake: the more air the engine can intake the more fuel the engine can burn and the more power the engine can output [341. As a result, the power generated by a naturally aspirated engine (an engine which intakes directly from the environment around it) is limited by the density of air around it. In order to significantly increase engine power, the intake
air density has to be increased through compression [34]. This is called charging an
engine.
There are two primary technologies to charge an internal combustion engine; su-percharging and turbocharging. Susu-percharging uses mechanical power from the en-gine in order to power a compressor that compresses the intake air (Fig. 1-6). This
Compressor
IFs
Fresh A
ROOTS IRIPU Oll 6W HILIX
INTAKI SIDI.
Compressed Air
Belt
Engine
Crankshaft
ir Inlet
IExhaust
L"SHoLM TWIN SCKIW SUP[It-HARGtE CENTR#UGAL %UfRCHARGER INTAKI SII
NTAK Sint
DICHARGIR *SIDI
Figure 1-6: Top: Diagram of how a supercharger is integrated into an engine system.
Bottom: figures of how three common types of superchargers work [7]
is an effective technology that can increase the power output of any engine and is
re-sistant to the pulsating nature of the intake air. However, supercharging is inefficient
since it draws power from the engine's mechanical output [67, 61]. A turbocharger
uses an axially connected compressor and turbine. The turbine is powered by the
energy from the exhaust gas (Fig. 1-7). The turbine then spins the compressor which
pressurizes the intake air. This technology was chosen because it can be used to make
the engine more efficient in addition to increasing power density [67].
The idea of charging an engine in order to increase the amount of air in the engine
and thus its power output dates back to the late nineteenth century when internal
combustion engines were first being introduced [35]. The original schemes involved
supercharging. In 1905 the first turbocharging scheme was proposed in a patent
TURBOCHARGER
Compressed AirCrankshaftCOMPRESSOR H"OUEINne.
SECTION
R O
MPRESSOR MIR RUBINE
INARE EXUST
1
COMPRESSOR C oUT.ET Compressor Turbine
TImME
COPESO SECIO Exhaust
INLET WFresh
Air Inlet
Figure
1-7:
Left: Diagram of a turbocharger [8] Right: Diagram of how a turbocharger
is integrated into an engine system.
by Alfred Buechi [35]. However, not until 1925 were the first turbocharged engines
manufactured for a pair of passenger ships [35]. In 1938 the first turbocharged truck
engine was produced by Swiss Machine Works [6]. During the Second World War
supercharging schemes became commonly used in order to increase the power density
of planes operating at high altitude.
The first attempt at turbocharging automobile engines was by Chevrolet and
Oldsmobile in the early sixties [6]. This attempt was considered a failure due to
reliability issues. It took until the OPEC oil embargo, a decade after the failed first
attempt, for turbochargers to become popular due to the fuel efficiency advantages
that they provide [6]. Today turbocharging is common in almost all truck engines and
diesel vehicles as a means to reduce fuel consumption and emissions. Turbocharging
has been shown to reduce both fuel consumption and C02 emissions by 2-6%
[2].
Due to the pulsating nature of the manifold flows, turbocharging is not currently
used in four-stroke single-cylinder engines [11]. It has been shown that when the
engine is exhausting the turbocharger is energized and provides the power that is
needed to make the compressor effective [33, 56]. In a multi-cylinder engine the
system can be tuned such that when one cylinder is intaking a different cylinder
exhausting; as a result the turbocharger is always powered when air is needed. In
a direct application to a single-cylinder engine, a turbocharger would be powered
during the exhaust stroke; however, it would not pump air to the engine during
the intake stroke. As a result single-cylinder engines are not currently commercially
Air capacitor
cap, Tcap, mair in cap
Pturbo
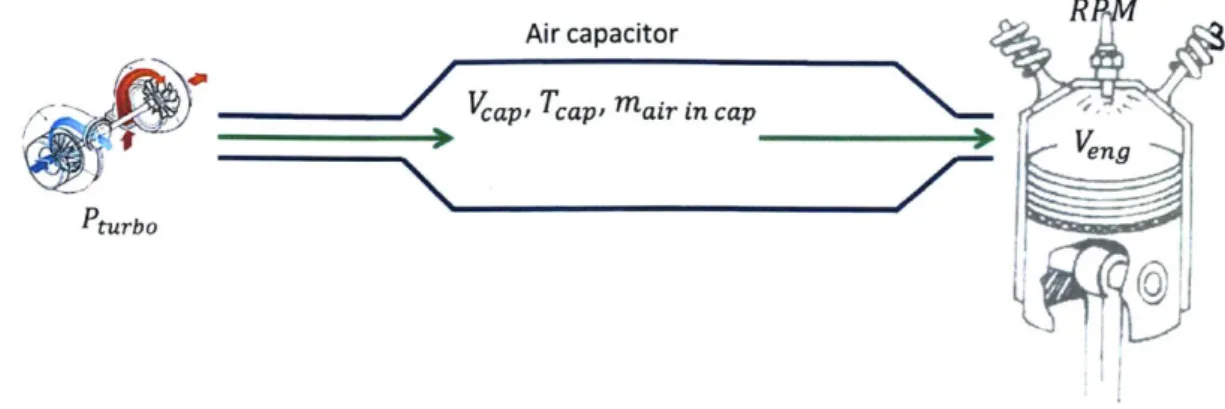
Figure 1-8: Diagram of the simple mass flow model used to describe flow in the intake manifold
turbocharged.
There are examples of single-cylinder engines that have been turbocharged by hob-byists and motor-sports enthusiasts [581. In all these cases an oversized inter-cooler was used, which acted as an air capacitor. This supports the idea that the air ca-pacitor method for turbocharging single-cylinder engines is feasible and that a better understanding of this effect can result in a commercially viable engine technology.
1.3
Previous Work
This work is based on a patent and an initial feasibility study on air capacitor tur-bocharging that demonstrated how this method could be used to increase the power output of a single-cylinder engine by up to 30% 1151. The initial work was based on an analytical model that predicted how an air capacitor affects a turbocharged
single-cylinder engine [681.
A simple mass flow model can be used to describe the flow in the intake manifold during steady state operations and explain how the air capacitor works. Figure 1-8 shows how this model is laid out. The turbocharger is assumed to operate at a constant pressure Ptro. The capacitor has a volume Vcap, a temperature Tcap, and contains a mass of air that fluctuates throughout the engine cycle. The engine is operating at a set speed and has a volume Veng. For each cycle, the mass of air
flowing from the turbocharger into the air capacitor equals the mass of air flowing out of the air capacitor and into the engine (Eqn. 1.1).
For this simple model the assumption is that during the intake stroke the pressures in the air capacitor and in the engine equalize. From this assumption the mass flow out per cycle can be approximated as: (Eqns. 1.2 - 1.4). [421
mass f low per cycle = rhout * Cycle Duration *
V"n -mair in manifold (1.2)
Veng + Vcap
120
Cycle Duration = M(1.3)
R PM
- eng mair in manifold RPM
ut =Veng + Vcap 120
The mass of air inside the manifold can be approximated using the ideal gas law and as a result the mass flow out of the air capacitor and into the engine can be calculated from known variables: (Eqns. 1.5- 1.6). [421
mair in manifold turbo * Vcap (1.5)
R*Tcap Veng Pturbo * Vcap RPM rmout = **(1.6)
Veng + Vcap R * Tcap 120
Using the ideal gas law, the airflow through a naturally aspirated engine can be approximated as: (Eqns. 1.7-1.9).
PATAI* (17
mNaturally Aspirated -
R
* A1TR *T AT M
Ve
* RPM 120PATM * Veng rnNaturally Aspirated R*TAT M *
120
By knowing the mass flow in the turbocharged case and the naturally aspirated case, we calculate the density gain due to turbocharging (Eqn. 1.10). Note that the density gain will be equivalent to the change in mass flow rate since the engine volume remains constant in both cases. Density gain is proportional to power gain. This result shows the influence of air capacitor size on power output. The influence of cooling in the air capacitor can also be modeled by assuming the air undergoes isotropic compression inside the turbocharger (Eqn. 1.11). From this simple analysis it can be shown that increasing the volume of an air capacitor increases the effectiveness of a turbocharged single-cylinder engine with diminishing marginal return and that adding heat transfer elements to the air capacitor can significantly improve the performance (Fig. 1-9). [421
. mturbo Pcap *
Vcap
* Tatm (1.10)Density Gain (.0
mNaturally Aspirated Fatm * TCap * (Veng + Vcap)
Tcap no heat transfer =Tatm * (Pturbo)(-1)/Y (1.11) Fatm
An initial experiment was built to validate the turbocharging concept (Fig. 1-10). A single-cylinder diesel generator was retrofitted into a simple dynamometer. The generator engine was fitted with a turbocharger and an array of sensors. The load on the engine was provided by a series of space heaters
115].
This experiment showed that peak power output was directly affected by air capacitor size in a trend that closely matched the analytical model (Fig 1-11). In addition to the power output increase, it was shown that as the air capacitor size increased so did the intake pressure and2 1.8 1.6 .c 1.4 0 1.2 1 0.8 O 0.6
0.4 -Perfect Heat Transfer in Capacitor
0.2 -No Heat Transfer in Capacitor
0
0 2 4 6 8 10 12
Non Dimensional Manifold Size
Figure 1-9: Plot showing the results for the simple mass flow model with and without heat transfer. In this scenario the turbocharger is operating at pressure of one bar.
the intake air density. This simple experimental setup was able to show that air capacitor turbocharging could increase the power output of a single-cylinder engine
by 33% without cooling [15].
Control Intake Exhaust Panel
Power pater Engine Generator Tachometer - Generatorower, Voltage, Current Temperature SSensors ure Sensors 11111
Figure 1-10: The initial experiment used to validate the air capacitor theory.
1.6
_U
U
*
U
U
-U
7-U
7 '7-No
Heat Transfer in Capacitor
0
Measured Power Gain
2
4
6
8
Non Dimensional Manifold Size
Figure 1-11: Results of the initial experiment compared to the simple mass flow model with no heat transfer and a turbocharger pressure of 13 psi (waste-gate pressure).
40 Air Capacitor Intake Manifold C: 0
1.4
1.2
1
0.8
0.6
0.4
0.2
0
0
Chapter 2
Computational Model
An initial computational model was built in Ricardo Wave. The goal of this model was to predict the impact of air capacitor sizing and engine parameters on overall engine performance. Since this initial model was unvalidated, it was not designed to accurately predict engine performance. Instead, the model was used to predict trends on how the engine with an air capacitor would perform relative to its naturally aspirated state and to gain insights on trends and relative impact of engine parameters on performance. Initially, a naturally aspirated model of the engine was created and then it was augmented with a turbocharger to generate a turbocharged model.
These models were initially run directly in Ricardo Wave. However, it was found that the results of the models were more accurate and the post-processing of results was simpler when the models were run through Matlab and Simulink. The improve-ment in accuracy was due to the custom convergence detection that was built into the Simulink model.
2.1
Goals of Model
There were two key goals for this initial model. The first was to be able to predict trends and magnitudes. The model could be used to understand the impact of mani-fold characteristics and engine parameters on the overall performance of the system. This was used to predict how to size the air capacitor as well as how to adjust engine
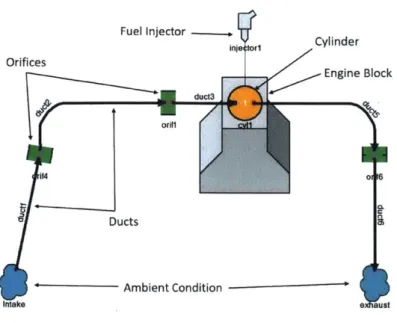
Fu el I --- 1 Cylinder Orifices Engine Block duct3 orif l l01 Ducts Ambient Condition Intake ust
Figure 2-1: Block diagram that shows the layout of the naturally aspirated model,
each subsystem is defined by a series of parameters.
timings to best utilize the boost coming from the capacitor.
The second key goal was to create a framework that could be calibrated to the
data generated by the engine experiment. Using the experimental data it was possible
to validate the model and to further optimize the system. The model validation is
shown in Chapter 4 and how it was used to optimize the engine is discussed in Chapter
6.
2.2
Model Overview
The model was built in Ricardo Wave, a one dimensional engine modeling software.
The parameters of the initial model were based on the engine used in the experiment
(Kohler KD440), values recommended by Ricardo Wave, and literature. The naturally
aspirated model is pictured in Figure 2-1. The model consists of a series of blocks
that define the engine, the manifolds, the fuel injector, and the valves.
The turbocharged model builds on the naturally aspirated model by adding a
compressor, a turbine, and a turbine shaft to the system. The turbocharger was
42
M

![Figure 1-4: Map that compares the level of mechanization to farm yield in selected regions.[4, 22]](https://thumb-eu.123doks.com/thumbv2/123doknet/14265068.489726/29.917.201.726.165.446/figure-map-compares-level-mechanization-yield-selected-regions.webp)

![Figure 1-7: Left: Diagram of a turbocharger [8] Right: Diagram of how a turbocharger is integrated into an engine system.](https://thumb-eu.123doks.com/thumbv2/123doknet/14265068.489726/35.917.196.728.145.329/figure-diagram-turbocharger-right-diagram-turbocharger-integrated-engine.webp)