Publisher’s version / Version de l'éditeur:
Vous avez des questions? Nous pouvons vous aider. Pour communiquer directement avec un auteur, consultez la première page de la revue dans laquelle son article a été publié afin de trouver ses coordonnées. Si vous n’arrivez pas à les repérer, communiquez avec nous à PublicationsArchive-ArchivesPublications@nrc-cnrc.gc.ca.
Questions? Contact the NRC Publications Archive team at
PublicationsArchive-ArchivesPublications@nrc-cnrc.gc.ca. If you wish to email the authors directly, please see the first page of the publication for their contact information.
https://publications-cnrc.canada.ca/fra/droits
L’accès à ce site Web et l’utilisation de son contenu sont assujettis aux conditions présentées dans le site LISEZ CES CONDITIONS ATTENTIVEMENT AVANT D’UTILISER CE SITE WEB.
Indoor Environment: The Journal of Indoor Air International, 3, 3, pp. 135-144,
1994-05
READ THESE TERMS AND CONDITIONS CAREFULLY BEFORE USING THIS WEBSITE.
https://nrc-publications.canada.ca/eng/copyright
NRC Publications Archive Record / Notice des Archives des publications du CNRC :
https://nrc-publications.canada.ca/eng/view/object/?id=3c515d4e-1a0a-45a1-a076-04ca8acdd4ad
https://publications-cnrc.canada.ca/fra/voir/objet/?id=3c515d4e-1a0a-45a1-a076-04ca8acdd4ad
NRC Publications Archive
Archives des publications du CNRC
This publication could be one of several versions: author’s original, accepted manuscript or the publisher’s version. / La version de cette publication peut être l’une des suivantes : la version prépublication de l’auteur, la version acceptée du manuscrit ou la version de l’éditeur.
Access and use of this website and the material on it are subject to the Terms and Conditions set forth at
Manual control of window blinds and electric lighting: implications for
comfort and energy consumption
Manual control of window blinds and electric
lighting: implications for comfort and energy
consumption
Newsham, G.R.
A version of this paper is published in / Une version de ce document se trouve dans : Indoor Environment, v. 3, no. 3, May-June 1994, pp. 135-144
www.nrc.ca/irc/ircpubs
Abstract
Algorithms to describe the manual control of window blinds and electric lighting, in response to comfort stimuli, were incorporated into a building thermal model. By comparison with fixed control schedules, this paper examines the impact of manual control on model predictions of thermal comfort and building energy consumption. For a typical, south-facing office in Toronto, the thermal comfort of an occupant close to the window was substantially improved by the provision of window blinds. Compared to an office with no blinds, mean PPD (predicted percentage of occupants dissatisfied with the thermal environment) was lowered from 22 to 13%, and overheated hours were reduced by over 200 per year. However, when the lighting was also manually controlled, the blinds imposed an energy penalty. Though reduced solar gain lowered cooling energy by 7%, heating energy increased by 17%, and reduced daylight increased lighting energy by 66%. The implications of these results on the modelling of occupied buildings are discussed.
Using computer models to predict building temperatures and energy consumption is well established. Model development has tended towards increasing complexity, allowing physical elements and heat transfer processes to be modelled ever more accurately. This development process has been facilitated by a rapid increase in computer processing speed, enabling ever more complex calculations to be performed in a reasonable amount of time. However, a major source of error in the prediction of the performance of
occupied buildings, occupant behaviour, has largely been ignored. If the variance in predictions due to occupant behaviour is large, attention to occupant behaviour may yield greater improvements in model accuracy than more complex modelling of physical elements and heat transfer processes.
Conventional building thermal models treat occupants as little more than fixed metabolic heat generators passively experiencing the indoor environment. In fact, occupants may interact with the building in many ways, directly or indirectly affecting thermal transfer processes. The result is that many of the building parameters that a modeller might assume to be constant may indeed vary when
A version of this paper was originally published in
Indoor Environment 3, 135-144 (1994)
Manual Control of
Window
Blinds and Electric
Lighting:
Implications for
Comfort and
Energy Consumption
G.R. Newsham
Institute for Research in
Construction, National Research Council, Ottawa, Ont., Canada
(NRCC-37021) (IRC-P-3567)
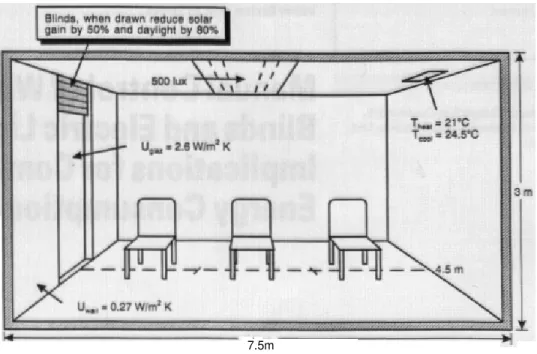
Fig. 1. Characteristics of the modelled office.
the building is occupied by real people. One stimulus lead-ing occupants to interact with the buildlead-ing is personal comfort. The occupants of commercial buildings have potentially many ways of improving their comfort. One strategy often available is adjusting window blinds in response to solar induced glare and overheating. A second strategy is the switching of overhead lighting in order to provide adequate light for whatever task the occupant is performing. While such actions will improve thermal and visual comfort, they will also affect building energy re-quirements.
Field studies of occupant behaviour with respect to blind use and light switching have yielded patterns of behaviour dependent on specific environmental stimuli. From these observed patterns, algorithms to describe blind use and light switching can be derived. By incorporating these algorithms into a building thermal model which predicts the values of these stimulus variables, this paper examines, for a single geographical location and building type, the potential impact of occupant behaviour on thermal comfort and building energy consumption. The results demonstrate the variance which may be introduced into model predictions by behavioural assumptions.
Methods and Procedures
The computer-based thermal model FENESTRA was used for this study. It is a finite difference model of a single, south facing room, and has been described in detail elsewhere [1]. However, since previously described in Newsham [1] , FENESTRA’s thermal comfort algorithm has been improved, and now adopts a simplified Fanger equation [2] , incorporating four environmental variables: air temperature, mean radiant temperature (MRT), humidity, and air speed; and two personal variables: metabolic rate, and clothing insulation. The adopted comfort algorithm uses a linearized radiation heat transfer equation, a simplified convection coefficient, and dew-point as the humidity variable to recast Fanger’s heat balance equations [3] in a form which allows the predicted mean vote (PMV) to be solved without iteration. This simplification is valid at thermal conditions close to the comfort zone, as would exist in a conditioned office building. PMV can then be converted to predicted percentage dissatisfied (PPD) using the following equation [4] :
PPD = 100 – [95.exp-(0.03353PMV4 + 0.2179PMV2)] (1)
For each modelled timestep FENESTRA maps direct gain sunshine to the various room surfaces, and calculates both MRT and air temperature spatially within the room. These features give heat transfer and thermal comfort parameters spatial definition.
Air temperature distribution on a vertical axis is calculated using a simple stratification routine. First, the mean air temperature for the timestep, T0, is calculated.
Then the air in the room is notionally divided vertically into three layers of equal thickness. In general, all
heat gains to the room air (via convection from various surfaces, and ventilation) are considered to contribute to incrementing the temperature of the upper air layer, while heat losses to the room air contribute to incrementing the temperature of the lower air layer. However, the interaction of gains and/or losses is considered. For example, if a warm surface contributing heat gain (rising air) exists directly below a cool surface contributing heat loss (sinking air) - as might be the case for a floor sunpatch beneath a window - only the net heat gain or loss contributes to incrementing the temperature of the appropriate air layer. Then:
dTstrat = (Qupper - Q!ower)/Vs (2)
where dTstrat is the temperature increment due to
stratification (°C), is the total gain contributing to incrementing the upper air layer temperature (J), Qlower is
the total loss contributing to incrementing the lower air layer temperature (J), and Vs is an empirically derived
stratification constant (J/°C).
The temperatures of the air layers are then calculated:
Tupper = T0 + dTstrat (3a)
Tlower = T0 - dTstrat (3b)
Tmiddle = T0 (3c)
where Tupper is the temperature of upper air layer (°C),
Tlower is the temperature of lower air layer (°C), and Tmidd!e
is the temperature of middle air layer (°C). With a suitable
choice of Vs, the above method results in a linear
stratification temperature gradient similar to those measured in office-type spaces .
Figure 1 shows the room modelled in the study: an enclosed office of dimensions 4.5 x 7.5 x 3 m. There was no net heat exchange through the walls except through the south wall, U value: 0.27 W/m2 K. One third of the south wall was double glazed with clear glass in a centered vertical slot; glazing assembly U value: 2.6 W/m2 K. An internal window blind was available, when fully closed 50% of solar gain and 80% of daylight were excluded from the room (compared to the ‘open blinds’ condition). The blind was considered loose-fitting, so that window U-value was unaffected by the closing of the blind, consistent with the internal blind modelling assumptions of Sullivan et al. [5] . The HVAC system heating and cooling setpoints were 21 and 24.5°C respectively. The fluorescent lighting system provided 500 lx at desk level. The room was occupied between 08.00 and 17.00 h. Internal gains,
excluding lighting, totalled 600 W (17.8 W/m2) during
occupancy.
The chairs in Figure 1 indicate three potential occupant positions. Thermal comfort parameters were calculated at each position, to examine the effect of occupant position on results. Three of the comfort parameters were held constant during the simulations: air speed = 0.05 ms-1; metabolic rate = 1.2 met (office work, sedentary); and clothing insulation = 0.7 clo (light working ensemble: light underwear, cotton workshirt with long sleeves, work trousers, woollen socks, shoes [4]).
The calculation timestep was 5 min, or 288 timesteps per simulated day; surface and air temperatures, energy
inputs and comfort parameters were recorded to an output file at the end of each time-step. Simulations were performed over a shortened year comprising 3 days per month typical of the climate of Toronto, Canada. The simulation results were then converted into equivalent annual values.
Four blind control strategies were considered: ‘permanent’ (always closed), ‘none’ (always open), ‘manual’ (obeying the algorithm described below), and ‘7 months’ (blinds always closed April - October, and always open November - March). Manual control is compared to these strategies because there may be typical assumptions of blind operation in conventional modelling. Two lighting control strategies were considered: on for all occupied hours, and manual control (obeying the algorithm described below). All combinations of blind control strategy, lighting control strategy, and occupant position were simulated, resulting in a total of 24 simulations.
Manual Control of Window Blinds
Field studies have identified overheating and glare as the principal parameters that stimulate occupants to manually operate window blinds [6-8]. In a field study of a large office building in Japan, Inoue et al. [6] found that: (1) The percentage of blinds closed was proportional to the depth of sunlight penetration into a room, provided that a threshold sunlight intensity was reached (Fig. 2), and (2) once closed, blinds remained closed all day. An algorithm to describe manual blind operation derived from these findings was added to FENESTRA. If sunlight of intensity greater than 233 W/m2 fell on the occupant (impinged on the chosen occupant position), the blinds
0 1 2 3 Solar Penetration (m) B lin d s c los ed ( % ) B lin d s c los ed ( % ) 100 50 0 100 50 0 0 100 200 300 400 Solar intensity through window (W/m2) Fig 2. Measured relationship between percentage of blinds closed and solar penetration and intensity, for a SSW facing office building in Japan [8].
Fig. 3. Block diagram to describe the manual blind operation algorithm added to FENESTRA.
Fig. 4. Measured relationship between light switching probability and minimum daylight illuminance in the working area . Fig. 5. Block diagram to describe the manual light switching algorithm added to FENESTRA.
were closed. They completely covered the window, and remained closed until the following morning. The algorithm is illustrated by the block diagram of figure 3.
Figure 2 was drawn from a large population of offices. If, as in this study, a single office which may have one or more occupants is examined, the choice of an appropriate threshold of solar intensity is not obvious. Each of the occupants may have different thresholds and may evaluate the conditions at different intervals. A value of 233 W/m2, resulting in a 20% probability of blind operation, was chosen to echo the 20% PPD thermal comfort criterion of ISO Standard 7730 [4] . In addition, 233 W/m2 appears to be the point at which the maximum rate of blind operation occurs. The implications of this choice on the interpretation of results are discussed briefly later.
Manual Control of Electric Lighting
Blind use will impact on another building system, lighting, which is often manually controlled. Closing blinds may improve comfort, but, in excluding daylight, may also increase electric light use. Further, the exclusion of solar gains may affect thermal energy consumption. Therefore, to better model energy consumption in an occupied building, the potential impact of manual blind operation on lighting should be considered.
Field studies have identified parameters that stimulate occupants to manually switch lighting [9,10]. In a field study of schools and offices in the UK, Hunt [9] found that: (1) The probability of switching lights was related to the minimum working area illuminance (fig. 4); (2) either all or none of the lights in the room were switched on; (3) lights were switched on only when entering a space,
5 10 20 50 100 200 500 1000 2000 Minimum daylight illuminance level in the working area, lux
and switched off only when vacating a space. An algorithm to describe manual light switching drawn from these findings was added to FENESTRA. If, at 08.00 or 13.00 h, daylight at the occupant position was less than 150 lx all lights were switched on. If the lights were on at 13.00 h and the daylight at the occupant had increased above 150 lx the lights were switched off. All lights were switched off at the end of the occupied period. The algorithm is illustrated by the block diagram of figure 5. Again, as the modelled office is not identical to the buildings in which the manual control behaviour was observed, the choice of an appropriate threshold stimulus is not obvious. A day-light level of 150 lx, resulting in a 20% probability of switching (fig. 4), was chosen as a threshold stimulus, again, to echo the 20% PPD criterion of ISO standard 7730 [4]. 08.00 h and 13.00 h were assumed to be the times when the space would be entered, at the start of the working day, and after lunch, respectively.
Results
Figure 6 shows blind use (percentage of occupied hours blinds were closed) vs. occupant position for the four blind operation strategies. For manual control, blind use falls rapidly with distance from the window, as the probability of direct sunshine falling on the occupant decreases. For the other ‘non-dynamic’ strategies blind use is independent of occupant position. For an occupant 1.25 m from the window, manual control results in about the same overall blind use as the ‘7-month’ strategy. However, the blinds will be closed at different times.
Figure 7 shows mean PPD vs. occupant position for the four blind operation strategies. Figure 7a shows the case in which light switching was under manual control,
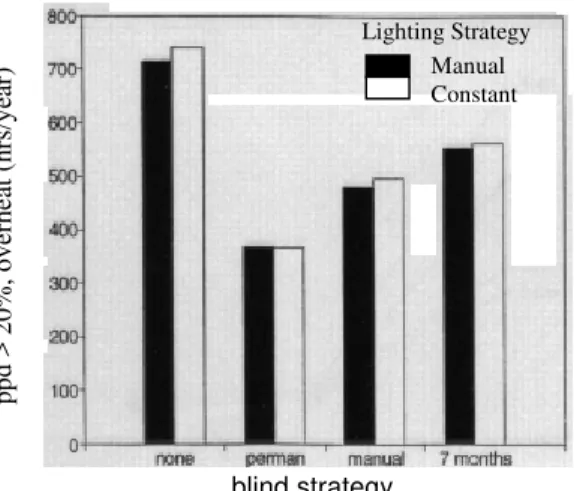
Fig. 8. Predicted number of hours per year PPD >20% due to overheating for four blind operation strategies, for an occupant 1.25 m from the window. Both light switching strategies are shown.
as described above, and figure 7b shows the case in which the lights were on for all occupied hours. Heat gain from the lights may affect the thermal conditions in the space. However, comparison of figures 7a and b shows that the effect of light switching on mean PPD was negligible. For occupants 3.75 m or more from the window, blind opera-tion strategy has little effect on mean PPD. However, this is not true for the position closest to the window. Blinds will affect thermal comfort in an air-conditioned office mainly by excluding sunshine falling directly on occupants, causing overheating. Therefore, one would expect permanently closed blinds, excluding most sunshine, to produce the lowest mean PPD, and no blinds to produce the highest mean PPD, and this is indeed the result. How-ever, the ‘manual’ blind strategy has a mean PPD only slightly higher than the ‘permanent’ strategy, though the blinds were open for 40% of occupied hours (fig. 6). The ‘manual’ strategy achieves this performance because the blinds are only closed when overheating is likely. Although the ‘7-month’ strategy keeps blinds closed throughout the warmest months of the year, the resulting mean PPD is closer to the ‘none’ strategy than the ‘permanent’ strategy. Its performance is worse than the ‘manual’ strategy, though annual blind use is similar, indicating that there are many winter periods when overheating (and glare), due to the direct incidence of sunlight on the occupant, may occur.
In almost all cases the mean PPD is lower than 20%. However, this does not mean that ISO criteria are met, since there may be many periods when PPD is greater than 20%. Figure 8 shows, for an occupant 1.25 m from the
window, the number of hours/year that PPD >20% due to overheating for the four blind operation strategies and the two light switching strategies. For the blind strategies, the ‘manual’ strategy produces significantly fewer overheated hours than the ‘none’ and ‘7 month’ strategies. In the case of the lighting strategies, overheating is slightly worse for the constant lighting strategy due to the increased heat gain from the lights.
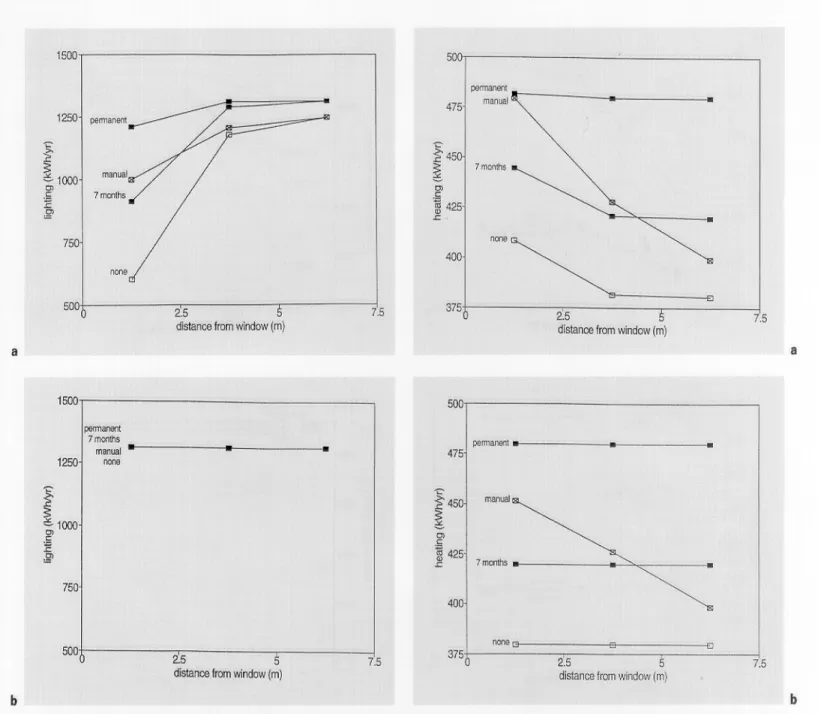
The effect of blind use on energy consumption was also investigated. Figure 9 shows annual lighting energy vs. occupant position for the four blind operation strategies. Figure 9b illustrates the constant lighting case, where, obviously, blind use does not impact lighting energy con-sumption. However, for manual light switching (fig. 9a), one would expect that increasing blind use, with increasing daylight exclusion, would result in increasing need for electric lighting, and this is indeed the result. The curves for all blind strategies are dependent on occupant position, showing increased lighting use farther from the window, because interior daylight level is dependent on distance from the window. Even the curve for the ‘permanent’ blind strategy is dependent on occupant position because even with the blinds permanently closed the 20% daylight admitted is sufficient to meet the 150 lx requirement on some very bright days. For the ‘manual’ blind strategy the effect is not as marked as for the ‘7 months’ and ‘none’ strategies because it is counteracted by the fact that blind use increases closer to the window.
Figure 10 shows annual heating energy vs. occupant position for the four blind operation strategies. One would expect that increasing blind use, with increasing solar gain exclusion, would result in an increasing need for heating. And this is indeed the case for the constant lighting strate-gy of figure l0b. Only the ‘manual’ blind stratestrate-gy shows a dependence on occupant position because only for that strategy does blind use vary with position. Comparing the ‘manual’ and ‘7-month’ blind strategies for an occupant 3.75 m from the window one sees that more heating is required in the ‘manual’ case though blind use is consider-ably less. This is because, unlike the ‘7-month’ strategy, the ‘manual’ strategy may exclude some solar gain during the peak heating season (November to March). However, when lights are manually switched (fig. 10a), the results are confounded by the effect on lighting requirements, where increasing blind use means increasing electric lighting, which produces heat and offsets heating load. Heat produced by lighting explains why heating consumption depends on occupant position for all blind strategies.
pp d > 2 0 % , o v e rhe at ( h rs /y ear ) blind strategy Lighting Strategy Manual Constant
Fig. 9. a Predicted annual lighting energy consumption vs. occupant position (distance from window) for four blind operation strategies, when lights are manually switched. b Predicted annual lighting energy consumption vs. occupant position (distance from window) for four blind operation strategies, when lights are constant (always on).
Figure 11 shows annual cooling energy (assuming a coefficient of performance of 4) vs. occupant position for the four blind operation strategies. One would expect that increasing blind use, with increasing solar gain exclusion, would result in a reduced need for cooling, and this is indeed the result for both lighting strategies. However, in figure 11a one can still see the effect of lighting heat gains which lead to a dependence of cooling energy on occupant position for all blind strategies.
Figure 12 shows total (thermal and lighting) annual energy consumption vs. occupant position for the four
Fig. 10. a Predicted annual heating energy consumption vs. occupant position (distance from window) for four blind operation strategies, when lights are manually switched. b Predicted annual heating energy consumption vs. occupant position (distance from window) for four blind operation strategies, when lights are constant (always on).
blind operation strategies. In figure 12b one sees that for constant lighting the overall effect of blind use on energy consumption is small, the impact on heating and cooling being close to equal and opposite. For manual light switching (fig. 12a) energy consumption was generally lower than the constant lighting case, due principally to the displacement of lighting load by daylighting. Overall, the more frequently the blinds were closed, the more energy was consumed since the reduction in cooling was less than the increase in heating and lighting. The curves for all blind strategies are dependent on occupant position
Fig. 11. a Predicted annual cooling energy consumption (COP = 4) vs. occupant position (distance from window) for four blind operation strategies, when lights are manually switched. b Predicted annual cooling energy consumption (COP = 4) vs. occupant position (distance from window) for four blind operation strategies, when lights are constant (always on).
due to the effect of blind use on lighting, and, for the ‘manual’ blind strategy, the effect of solar penetration on blind use.
Discussion
This paper addresses two questions: principally, does the inclusion of empirically derived occupant behavioural algorithms into a building thermal model significantly
Fig. 12 a Predicted annual total (thermal and lighting) energy consumption vs. occupant position (distance from window) for four blind operation strategies, when lights are manually switched. b Predicted annual total (thermal and lighting) energy consumption vs. occupant position for four blind operation strategies, when lights are constant (always on).
affect predictions of energy consumption and thermal comfort? and secondly, is providing manually controlled window blinds beneficial?
In conventional modelling the window blinds and lights would be operated on some fixed schedule. The results of this study show substantial differences in predicted comfort and energy consumption between the assumed model of occupant behaviour with respect to window blinds, and three fixed schedules. There were also substantial differences in predicted energy consumption
between a constant lighting schedule and a manually switched one. While it is important to remember that this paper reports results for one office type and climate only, the impact of blind operation and manual light switching on lighting energy consumption is similar to that predicted by Zonneveldt and Rutten [11] for Dutch offices. Consequently, modelling buildings with manually operable window blinds and electric lighting by applying fixed schedules of operation may give inaccurate predictions of the energy consumption and indoor climate of the building when occupied. The results suggest that increased attention to occupant behaviour to improve the modelling of occupied buildings is warranted.
Providing building occupants with control over their own environment is generally considered desirable. By comparing the two blind strategies ‘manual’ and ‘none’ the merits of providing manually operable blinds in the particular space and climate studied can be examined. For the occupant position closest to the window, figures 7 and 8 indicate a significant improvement in thermal comfort with the ‘manual’ blind strategy. If the lighting was held constant, there was little overall effect on energy con-sumption, and therefore the provision of window blinds in that case is clearly beneficial. However, figure 12a indi-cates that if the lighting is manually switched, providing manually operable blinds imposes an energy penalty in the Toronto climate. While cooling energy is reduced by 7%, heating energy increases by 17%, lighting energy increases by 66%, and total energy consumption increases by 33%. Therefore, in this case, it is unclear if providing manually operable window blinds is beneficial. While an energy penalty is imposed, the improved comfort and sense of controlling one’s own environment may increase productivity. However, until productivity can be related to PPD the opposing impacts on comfort and energy con-sumption cannot be compared directly.
The preceding analysis indicates that the results are dependent on where the occupant is in the room. Only for the position closest to the window is a substantial effect due to blind strategy observed. Indeed, with the typical modelling assumption that occupants are at the center of the room, we would have concluded that the effect of blind operation strategy was minimal. Therefore if occupant behavioural algorithms of this type are to be applied to models of occupied buildings, accuracy will be improved if the model has spatial definition.
Interestingly, the range of blind use predicted by the algorithm used in this study: 8.6—59.9%, depending on occupant position, is comparable to the range of blind use between individual offices, and between buildings,
reported in several studies in the UK [12]. It may be the case that some of the observed variation in blind use [12] can be explained by occupant proximity to windows, a parameter not reported in Lindsay and Littlefair [12].
Note that the results quoted for the ‘manual’ strategies strictly apply only to that fraction of the population given manually operable window blinds and light switches for whom the adopted thresholds of 233 W/m2 and 150 lx are relevant. Getting an accurate picture for the whole of the population would require integrating each of the behav-ioural algorithms (blind operation and light switching) over the frequency of each stimulus (sunlight penetration, sunlight intensity, and daylight level). Such integration has already been performed for the light switching algorithm [13]. However, the similarity between the blind use predicted in this study and that reported from field studies, noted in the above paragraph, might indicate that the thresholds adopted in this study are not unreasonable simple approximations.
It is also important to remember that the variables in the behavioural algorithms employed in this study are limited to physical variables easily measured in the field and easily predicted using building thermal models. There are clearly other variables which will influence the operation of both window blinds and electric lighting, and in some cases they may be the dominant stimuli. For example, window blind operation may also be influenced by considerations of privacy and view.
Conclusions
Given the particular assumptions of this study, the fol-lowing conclusions can be drawn from the results: (1) In-corporating algorithms of occupant behaviour into building thermal models can significantly affect predictions of building energy consumption and thermal comfort. (2) Providing occupants with manually operable window blinds, compared to providing no window shading device, is likely to improve comfort. For the occupant position closest to the window, mean PPD was lowered from 22 to 13% and annual overheated hours were reduced by over 200. (3) If the lights are also manually switched, increased blind use carries a penalty of increased energy consump-tion. Though reduced solar gain lowered cooling energy by 7%, heating energy increased by 17%, and reduced daylighting increased lighting energy by 66%; the total of thermal and lighting energy increased by 33%. Neverthe-less, the total energy consumption with manually switched lighting will always be lower than in the constant
lighting case. (4) Manual operation of both light switches Acknowledgements
and window blinds depends on occupant position in the Particular thanks are due to: Dr. Nick Baker of the Martin
Cen-room. Therefore, if the effects of occupant behaviour are ter, University of Cambridge, UK, for his help in the development of
to be accurately modelled the model should have spatial FENESTRA. Sincere thanks also go to Leslie Cameron and Christa
definition. Gaudert for their help in preparing the figures.
References
1 Newsham GR: Investigating the Role of Thermal Comfort in the Assessment of Building Energy Performance using a Spatial Thermal Model; PhD thesis, Cambridge University, 1990. 2 Sherman M: A simplified model of
thermal comfort. Energy Buildings 1985;8:37—50.
3 Fanger P0: Thermal Comfort. Copenhagen, Danish Technical Press, 1970.
4 International Organization for Standardization: Moderate Thermal Environments — De-termination of the PMV and PPD Indices and Specification of the Conditions for Thermal Comfort. ISO Standard 7730, 1984.
5 Sullivan R, Lee ES. Selkowitz S: Impact Assessment and
Performance Targets for Lighting and Envelope Systems. Berkeley, Lawrence Berkeley Laboratory, 1992.
6 Rubin Al. Collins BL. Tibbott RL: Window blinds as a potential energy saver — a case study. Washington, NBS Building Science SeriesNo. 112, 1978. 7 Rea MS: Window blind occlusion:
A pilot study. Building Environ 1984;19(2): 133—137.
8 Inoue T, Kawase T, Ibamoto T, Takakusa S, Matsuo Y: The development of an optimal control system for window shading devices based on investigations in office buildings. ASHRAE Trans l988;94: 1034—1049.
9 Hunt DRG: The use of artificial lighting in relation to daylight
levels and occupancy. Building Environ 1979;14(1):21—33. 10Boyce PR: Observations of the
manual switching of lighting. Lighting Res and Technol 1980; 12: 195—205.
11Zonneveldt L, Rutten AJF: The electronic control of lighting. Proc Right Light Conf, Amsterdam, 1993, pp 151—157.
12Lindsay CRT, Littlefair PJ: Occupant use of venetian blinds in offices. PD 233/92. Watford, Building Research Establishment, 1993.
13 Hunt DRG: Predicting
artificial lighting use —a method based on observed patterns of behaviour. Lighting Res Technol 1980; l2(1):7—14.