HAL Id: hal-01629908
https://hal.archives-ouvertes.fr/hal-01629908
Submitted on 6 Nov 2017HAL is a multi-disciplinary open access archive for the deposit and dissemination of sci-entific research documents, whether they are pub-lished or not. The documents may come from teaching and research institutions in France or abroad, or from public or private research centers.
L’archive ouverte pluridisciplinaire HAL, est destinée au dépôt et à la diffusion de documents scientifiques de niveau recherche, publiés ou non, émanant des établissements d’enseignement et de recherche français ou étrangers, des laboratoires publics ou privés.
Experimental study of the chemical vapor deposition
from CH3SiHCl2/H2: Application to the synthesis of
monolithic SiC tubes
P. Drieux, G. Chollon, S. Jacques, A. Allemand, D. Cavagnat, T. Buffeteau
To cite this version:
P. Drieux, G. Chollon, S. Jacques, A. Allemand, D. Cavagnat, et al.. Experimental study of the chemical vapor deposition from CH3SiHCl2/H2: Application to the synthesis of monolithic SiC tubes. Surface and Coatings Technology, Elsevier, 2013, 230, pp.137 - 144. �10.1016/j.surfcoat.2013.06.046�. �hal-01629908�
Experimental study of the chemical vapor deposition from CH3SiHCl2/H2: Application to the synthesis of
monolithic SiC tubes
P. Drieux* 1 2, G. Chollon1, S. Jacques1, A. Allemand1 2, D. Cavagnat3,T. Buffeteau3
1
LCTS, Université Bordeaux 1 - CNRS UMR 5801 Allée de la Boétie, 33600 Pessac, France
2
CEA Le Ripault, 37260 Monts, France 3
ISM, Université Bordeaux 1 - CNRS UMR 5255 Cours de la Libération, 33405 Talence, France *Corresponding author: drieux@lcts.u-bordeaux1.fr
(0033)556844726
Abstract
The aim of the present work is to synthesize high strength monolithic SiC tubes to improve the
imperviousness of a SiC/SiC composite structure. A few hundred micrometers-thick tubular coatings were
produced by chemical vapor deposition (CVD) at atmospheric pressure, from CH3SiHCl2/Ar/H2 mixtures.
The CVD-SiC tubes were obtained by deposition on the inner walls of a SiO2-tube substrate, previously
coated with a pyrocarbon interfacial layer to promote delamination. A continuous deposition process was
developed to allow the realization of relatively long CVD-SiC tubes, by sliding the heating system along the
substrate. The chemical composition and the microstructure of the tubes were studied by electron probe
microanalysis, Raman spectroscopy and scanning electron microscopy.
The deposition rate, composition and microstructure of the CVD-SiC coatings were investigated as a
function of the substrate temperature and the gas flow rates. A Fourier transformed infrared (FTIR)
spectroscopy analysis was carried out at the reactor outlet to characterize the gas phase reactions. The FTIR
analysis of pure species from the Si-C-Cl-H system as well ab initio calculations at the density functional
quantitative analysis of the complex gas mixture. This study has led to the proposal of a simplified
dichloromethylsilane decomposition scheme which is consistent with the influence of the CVD parameters
on the nature of the gas phase and the coating. The deposition rate, the Si/C atomic ratio, the SiC crystalline
state and the surface morphology are indeed strongly related to the CH3SiCl3 decomposition rate and the
further progress of homogeneous reactions.
Keywords
1. Introduction
Generation IV nuclear energy systems are next-generation technologies that will allow a more efficient
use of the nuclear fuel and provide a better operating safety. They are expected to be available around 2040.
Tubular SiC/SiC composites [1, 2] are materials of prime interest to be part of the nuclear fuel claddings of
future power plants [3-6], thanks to their low neutron activation characteristics [7] but also their high
strength and fracture toughness at high temperature [8].
The optimization of SiC/SiC composites for nuclear purposes requires high thermal properties as well as
excellent gas imperviousness [9]. The latter point has implied the need of an additional sealing layer. Lately,
several concepts have appeared with the will to place this layer around a single SiC/SiC composite layer
[10], or between two composite layers, as a liner [11]. A few refractory metallic materials, such as
Tantalum, have shown a good compatibility with the composite structure, but a SiCβ sheath, having high
specific mechanical properties, no porosity, as well as an excellent stability at high temperature and under
neutron irradiation, might as well ensure this function.
SiC monofilaments are exemplary CVD-SiC materials in terms of mechanical properties [12]. They are
prepared by chemical vapor deposition at atmospheric pressure (APCVD) on a hot filament substrate, using
chlorosilanes (e.g. dichloromethylsilane: DCMS) diluted in hydrogen as the SiC precursor [13, 14]. A
failure strength up to 6 GPa and an ultimate strain of about 1.5 % can indeed be reached by the high
performance SCS-Ultra commercialized by Specialty Materials Inc. On the basis of the CVD-SiC filament
processing experience, the aim of the present study is to prepare SiC tubes by APCVD, with a composition,
microstructure and morphology compatible with high strength and strain at failure.
In this study, the synthesis of monolithic SiC tubes by APCVD from the DCMS/H2 system and the
characterization of their properties are detailed. A particular attention is given to the chemical composition,
the structure of the coatings and their growth rates, all of them depending on the deposition parameters.
Fourier transform infrared (FTIR) analyses of the gas phase at the reactor outlet have been performed to
calculations at the density functional theory (DFT) level of the theoretical features of the different
chlorosilanes likely present in the gas phase. The correlation between all these experimental approaches has
led to the proposal of a simplified gas phase reaction and deposition mechanism.
2. Experimental
The APCVD reactor presented in Figure 1 consists of a horizontal silica glass tube (L = 1000 mm,
∅int = 46 mm) connected to gas inlet/outlet flanges at both ends. Dichloromethylsilane (CH3SiHCl2, DCMS,
97%, from Sigma Aldrich) was used as the SiC precursor rather than other precursors (such as CH3SiCl3,
MTS, which is more often industrially used), because of its low decomposition temperature [15] and its
high vapor pressure (PDCMS = 48 kPa at 20 °C) favoring a use at atmospheric pressure. These properties led
the choice of the DCMS/H2 system for the synthesis of CVD-SiC monofilaments [13]. The DCMS vapor
saturation was obtained from a H2 carrier gas going through a bubbler maintained at 20°C. The DCMS
concentration was adjusted by further diluting the initial saturated DCMS/H2 mixture in a secondary H2
flow.
The inside of a silica tube (L = 500 mm, ∅int = 8 mm) was used as a substrate. A thin layer of pyrolytic
carbon (PyC) was deposited at the surface of the SiO2 tube in order to prevent chemical bonding between
the substrate and the coating. The PyC interfacial layer was deposited in the same reactor by sliding the
heating bench and by injection of pure propene at low pressure (QC3H6 = 100 sccm, T = 1000°C, P = 3 kPa).
The tube was brought to high temperature by a surrounding graphite susceptor heated by induction. This
unit was placed inside the large silica glass tube and connected to the inlet flange in order to force the gas
mixture to flow inside the substrate tube. The process was in a hot-wall configuration, since the whole 8 mm
diameter reaction chamber, including the substrate walls, was isothermal in the hot deposition area (4 cm).
The surface temperature (T) of the graphite shell outer surface was monitored in situ during the CVD
In order to manufacture relatively long silicon carbide tubes, the induction heat station was set on a
motorized bench allowing the induction coil −andthus , the hot area− to slide along the silica tube and the
substrate. The sliding speed of the heating bench, named hereafter S, can range from 0.25 to 5 cm/min.
For this study, the temperature T and total gas flow Qtot ranged from 1100 to 1200°C and from 250 to
1000 sccm (standard cm3.min-1), respectively. This parameter range is slightly modified compared to our
previous work [16].
The morphology of the coatings was characterized with a field emission gun scanning electron
microscope (SEM) (FEI Quanta 400F).
Electron probe microanalyses (EPMA) (SX 100 from CAMECA, France) were conducted on
cross-sections of the CVD-coated SiO2 substrate parallel and perpendicular to the tube axis. The Si, C and O
concentrations were assessed using the wavelength dispersive spectroscopy (WDS) mode (10 kV, 10 nA).
Pure SiC and SiO2 were use as standards. The carbon content was deduced by difference to avoid errors due
to surface contamination. The error in the concentrations is approximately 1 at. %. Punctual and line scan
measurements were performed along the cross section of the coatings, with a lateral resolution of
approximately 1 μm².
Raman microprobe (RM) analyses (Labram HR from Horiba Jobin Yvon) were also conducted on the
same specimens. The excitation source was a He–Ne laser (λ=632.8 nm). The power was kept below 1 mW
to avoid heating of the sample. The lateral resolution of the laser probe was close to 1 μm and the depth
analyzed was less than 1 µm. As for EPMA, punctual and line scan analyses were recorded along the cross
section of the deposit.
A quantitative study of the gas phase was carried out by Fourier transform spectroscopy (FTIR) at the
reactor outlet. The IR beam of the spectrometer (Nicolet 550) was led through a room temperature analysis
cell (with two ZnSe windows at both ends, L = 50 cm) installed at the reactor outlet (absorption
configuration). While the reaction chamber was set at atmospheric pressure, the pressure in the gas cell was
cell, the infrared beam was focused on the HgCdTe MCT-A detector placed below. The whole infrared
beam path was enclosed and constantly purged with a nitrogen flow in order to limit the absorption of
atmospheric compounds. A background spectrum was first recorded with a pure H2 flow in the reactor and
subtracted to the reacting gases spectrum. The apparatus allowed the acquisition of spectra in the
wavenumber range 600 - 4000 cm-1, with a resolution of 1 cm-1.
3. Theoretical calculations of IR spectra
The geometry optimizations, vibrational frequencies and absorption intensities were calculated by
Gaussian 09 program [17] on the DELL cluster of the MCIA computing center of the University Bordeaux
I. Calculations of the optimized geometry of CH3SiHCl2 (DCMS), CH3SiCl3 (MTS), SiH3Cl, SiH2Cl2,
SiHCl3 (TCS) and SiCl4 were performed at the density functional theory level using B3LYP functional [18,
19] and cc-pVTZ basis set. Vibrational frequencies and IR intensities were calculated at the same level of
theory. For comparison to experiment, the calculated intensities were converted to Lorentzian bands with a
half-width of 4 cm-1. To obtain a detailed assignment of each compound, the potential energy distribution
(PED) for each mode has been determined, in the harmonic approximation, according to the method
developed by Allouche [20].
4. Results
4.1.Synthesis of monolithic tubes : influence of the experimental conditions
Following the continuous PyC deposition described in the experimental section, the silicon carbide
synthesis was realized in both continuous and static conditions. The PyC interlayer exhibits a thickness of
350 nm which does not introduce major surface flaws at the substrate/SiC coating, and partly stays adherent
to the coating after cooling, hence requiring a further removal by oxidation (Figure 2). A list of
Both EPMA and SEM measurements around the perimeter of cut rings confirmed the chemical
composition and thickness homogeneity of the coatings. The oxygen concentration was found to remain
lower than 2 at.% in all specimens.
Deposition runs in static configuration have been mainly conducted in order to study the influence of
the deposition parameters on the growth rate and the stoichiometry of the coating.
Whatever the single source precursor [14, 16-21] used (CH3SiCl3, (CH3)2SiCl2, CH3SiHCl2), the key
parameters in the deposition of SiC by CVD are the temperature, the total pressure, the global gas flow rate
(or residence time) and the nature of the precursor dilution, characterized by the α ratio:
DCMS H Q Q 2
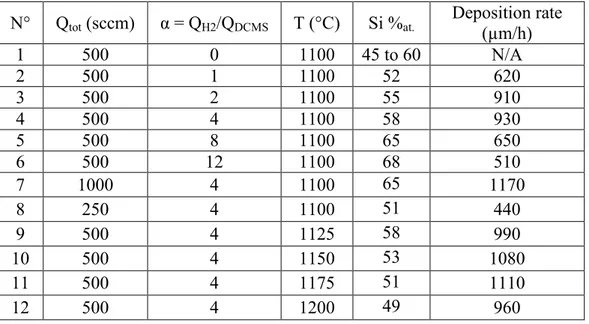
The Si/C atomic ratio increases significantly with α (Table I). At a temperature of 1100 °C and for a
total flow rate of 500 sccm, when α increases from 0 to 12, the silicon atomic concentration in the coating
varies from 45 at.% to 68 at.%, i.e. from a carbon excess to a very significant silicon excess. An important
dilution of DCMS in H2 also results in a strong decrease of the deposition rate. It should be mentioned that
in comparison to our previous work [16], growth rates have been greatly improved by the forced injection of
the gas mixture inside the substrate. Hence, even high dilutions of the precursor result in deposition rates
above 100 µm/h. For moderate α values, i.e. for 1 < α < 4, a maximum of 930 µm/h can be achieved, which
is high enough to synthesize both long and thick tubes in a relatively short period of time. After reaching
this maximum, the deposition rate decreases at particularly low α values, as already observed for the
CH3SiCl3/H2 system [21]. Together with the increase of deposition rate, it is worthy of note that solid
particles tend to grow from the gas phase beyond 1100°C and for low values. These solid products seem to appear and deposit at the tube outlet, in cool parts, as already observed for DCMS/C3H8/H2 [14] or
(CH3)2SiCl2/H2 systems [22]. This phenomenon could be due to the polymerization of light instable species
[23] and is probably favored by high pressure and low precursor dilution.
The Raman spectra (Figure 3) show clear Raman features assigned to crystalline SiC (expected at
silicon. The intensity of the Si band varies with α in very good agreement with the excess silicon expected
in the coating, as deduced from the EPMA measurements.
A gradual improvement of the SiC crystalline state can be noticed when the deposition temperature
increases. For α = 4, Qtot = 500 sccm and when the deposition temperature increases from 1100 °C to
1200 °C, the emergence of two sharp characteristic bands in the 750 – 1000 cm-1 region of the Raman
spectra confirms the increasing amount as well as the coarsening of the SiC phase. In parallel, the narrow
peak at 520 cm-1 as well as the 500 cm-1 bump due to crystalline and amorphous Si, respectively, both
disappear, indicating lower excess silicon at high temperature. The Si/C atomic ratios obtained by EPMA
are very consistent with the Raman analyses. Only a few changes in the deposition rate can be noticed with
the variation of temperature, with a mean value as high as nearly 1 mm/h.
The influence of the total gas flow rate was examined in a next step. When Qtot increases from
250 sccm to 1000 sccm (T = 1100 °C, α = 4), the silicon concentration, as measured by EPMA, tends to
increase from 51 at.% to 65 at.% (see Table 1). These results are consistent with the Raman analyses
(Figure 3) showing that the peak assigned to crystalline Si tends to disappear at low Qtot while
simultaneously, the SiC characteristic bands gradually appear. The deposition rate increases significantly
with Qtot from 440 µm/h at 250 sccm, to a maximum of 1170 µm/h at 1000 sccm.
For all these studies carried out in static conditions, the chemical compositions and deposition rates
correspond to the maximal thickness of the coating, located in the hot part of the deposition area. At both
sides of this hot zone, the drop of the induction power (i.e. of the temperature) leads to major modifications
of both chemical composition and thickness. These changes have to be properly characterized, since the
whole temperature profile will affect the deposition conditions at a given position of the substrate during the
continuous process. Figure 4 shows the evolution of chemical composition along the coating, which is
typically 4.5 cm long in static runs. A decrease of the carbon content can be noticed when temperature drops
at both ends of the tube. This phenomenon is more significant at the outlet side of the tube, indicating that
Using a continuous process, samples of a thickness up to 200 µm were successfully synthesized by
sliding the induction coil at low velocities (S ranging from 0.25 to 0.5 cm/min). Tubes as long as 25 cm
were obtained, demonstrating the feasibility of the process. The chemical composition of the coating is
consistent with the results obtained in static conditions. Homogeneous tubes along the axis having a Si/C
ratio of 1 in the radial central zone were indeed produced at high temperature (T = 1200 °C), medium flow
rates (Qtot = 500 sccm) and low dilutions (α = 2 to 4). The radial composition profile (along the thickness) of
a particularly thick tube elaborated in heat stage sliding conditions (S = 0.25 cm/min) (T = 1200 °C,
Qtot = 1000 sccm, α = 2), has been compared to the axial profile (along the gas flow direction) of a tube
synthesized in the same CVD conditions but in static configuration. The total thickness (e) and the radial
composition profile through the thickness of the tube wall (CSi()) obtained in sliding conditions, are indeed
directly related to the longitudinal deposition rate and concentration profiles obtained in static configuration
(respectively R(x) and CSi(x)), since d = 1/S R(x)dx.
Both Raman and EPMA analyses exhibit a similar evolution of the chemical and phase compositions.
The presence of free silicon was indeed observed in the part of the coating corresponding to the beginning
of the deposition during the continuous process (Fig. 5), i.e. to the low temperature and low maturation
conditions in the static configuration, at the entrance of the heated zone (Fig. 4).
4.2.Gas phase analysis
The changes in the chemical composition of the deposit are related to the variations of the temperature
on the concentration of the effective silicon and carbon precursors brought to the deposition area. FTIR
analyses of the gas phase at the reactor outlet were performed so as to determine how the modification of
the gas phase with temperature affects the deposition process. This study will allow linking the gas phase
composition changes with the structural and chemical properties of the coating.
In a first step, the infrared spectra of DCMS and species potentially encountered in the gas mixture
in the IR spectra as well as those reported in the literature [25-30] are given in the Table II. The assignment
of these bands has been performed from the ab initio at the B3LYP/cc-pVTZ level and PED calculations
performed during this study. The calculated frequencies and intensities of the vibrational modes as well as
their assignment on the basis of the normal modes are reported in the supporting information (Table i to
Table vi) for DCMS, MTS and chlorosilanes (SiH3Cl, SiH2Cl2, SiHCl3 and SiCl4). It is noteworthy that the
frequencies of the stretching vibration of the CH3 and SiHn groups are overestimated due to anharmonic
effects (scaling factors of 0.96 and 0.98 can be used for the stretching vibration of the CH3 and SiHn groups,
respectively).
The infrared spectrum of DCMS shows the presence of a weak band at 2984 cm-1 corresponding to the
antisymmetric stretching vibration of the methyl groups (aCH3), a very sharp and intense band at 2217 cm -1, due to the stretching vibration of Si-H bond, a low intensity signal at 1268 cm-1 corresponding to
symmetric bending vibration of the methyl groups (sCH3) and a conglomerate of intense peaks in the 900 –
650 cm-1 region, due to the bending vibrations of HCSi and HSiCl (889 and 852 cm-1) and to the stretching
vibration of Si-C bond. The IR bands exhibits PQR or PR profiles characterizing the coupling of vibrations
with rotation. The infrared spectra of SiCl4 and TCS compounds are easier to interpret. IR spectrum of SiCl4
reveals only one band at 620 cm-1, assigned to the antisymmetric stretching vibration of SiCl4 (aSiCl4).
Finally, the IR spectrum of SiHCl3 (TCS) compound exhibits three main bands at 2260 cm-1 corresponding
to the stretching vibration of Si-H bond, at 807 cm-1, corresponding to the bending vibration of HSiCl and at
590 cm-1, due to the antisymmetric stretching vibration of SiCl3 (aSiCl3).
An investigation of the temperature effect on the gas phase composition was carried out in a second
step. The infrared spectra recorded at room temperature after heating the gas phase at various temperatures,
ranging from 25 to 1250 °C, are reported in Figure 7. Whereas the spectra remains unchanged from 25 °C to
700 °C, major chemical modifications appear at higher temperatures. As the analysis is carried out ex situ at
room temperature, the detected molecules are necessarily stable and some of them may result from the
deposition rate becomes significant, some part of them might be consumed through heterogeneous reactions
leading to the SiC deposition. Hence, the consumption of DCMS, the apparition of new species at the
reactor outlet and their possible consumption due to homogeneous or heterogeneous reactions provide
useful information for a better understanding of the APCVD process. The decomposition of
dichloromethylsilane in the reactor is accompanied by the formation of HCl, SiHCl3, SiH2Cl2, SiCl4 and
CH4 (Fig. 7). The formation of unsaturated hydrocarbons such as C2H2 was also observed, but only at very
high temperatures.
To follow the evolution of the gas phase with the raising temperature, the temperature dependence of
several IR bands associated with the DCMS precursor or with the new produced species was investigated.
One or two bands were selected per species, after verifying that these bands did not overlap with other
neighboring IR bands. Thus, the bands at 2217 and 756 cm-1 have been chosen for DCMS, 2260 and 807
cm-1 for SiHCl3, 950 cm-1 for SiH2Cl2 and 620 cm-1 for SiCl4. For the CH4 species, the PQR profile in the
3220-2820 cm-1 spectral range as well as the only Q band of the antisymmetric stretching vibration (aCH4)
at 3017 cm-1 have been considered, subtracting the HCl contribution for each temperature. For the HCl
species, three bands at 2843, 2821 and 2798 cm-1 have been considered. In this study, the analysis was
pushed a step further by converting the qualitative monitoring (area of the bands vs temperature) into
quantitative data (concentration of species vs temperature). For this purpose, available pure products
(DCMS, SiHCl3, SiCl4, CH4 and HCl) were analyzed in the FTIR cell at various pressures (i.e. at various
concentrations, considering the perfect gas equation C=P/RT) in order to determine the molar absorptivity
for each band following the Beer-Lambert law:
(1)
where is the integrated absorbance for a band, the molar absorptivity for the considered band, L the length of the analysis cell (0.5 m) and C the concentration of the gas phase. The molar absorptivity
(in cm.mol-1) can be directly related to the calculated intensity of the band, (in km.mol-1) by the
(2)
The evolutions of the concentration with temperature are reported in supporting information (Figure i
and Figure ii) for several bands of SiHCl3 and other pure products derived from DCMS. The values of
determined from these figures are in good agreement with those determined by ab initio calculations (table i
and table v in supporting information). A good agreement has also been obtained for the antisymmetric
stretching vibration of SiCl4 at 620 cm-1 (I=537.4 km.mol-1 from experimental data vs I=542.4 from ab
initio calculations). As some mismatch between experimental and calculated values was observed for CH4
and HCl species, only the theoretical values were considered. The infrared spectra recorded from pure
species indeed did not allow the assessment of a consistent coefficient, probably due to peak overlapping or on insufficient spectral resolution.
Using the molar absorptivity determined experimentally for DCMS, SiHCl3 and SiCl4 and calculated for
SiH2Cl2, CH4 and HCl, in the Beer-Lambert relation (1), it was then possible to plot the evolution of
concentration of the different species versus the temperature, as shown in Figure 8. For the DCMS and TCS
compounds the results were averaged from the bands at 2217 and 756 cm-1 and at 2260 and 807 cm-1,
respectively (see supporting information Figure iii and Figure iv). Figure 8 reveals a progressive formation
of CH4 and HCl during heating, starting beyond 700 °C, while DCMS is simultaneously consumed. This
modification of the gas phase is essentially due to kinetic effects (the DCMS decomposition rate being
activated by the temperature rise). Even at high temperature, when DCMS is fully decomposed, only a part
of the species expected at thermodynamic equilibrium [31] is observed experimentally by FTIR
spectroscopy. This is mainly due to the ex situ conditions, which imply that only stable products can be
evidenced at room temperature. A thermo-kinetic modeling of the DCMS/H2 system (e.g. on the basis of the
work of Ge and Gordon [32]) is in progress to accurately describe these changes of gas phase. The evolution
of the respective Si and Cl containing compounds seems to be related. A gradual chlorination of the
chlorosilane species can be noticed : SiH2Cl2 first appearing from 750 °C and then reaching a maximum at
others at high temperatures as the major silicon bearing species found at the reactor outlet. The global
decrease of the various products starting at 1200 °C might correspond to heterogeneous reactions, i.e. to the
formation of the coating or other solid byproducts appearing in larger amounts at this temperature. The
decrease of the HCl concentration is surprising however; as it is rather expected to keep on increasing with
T [31]. This could be related to the reaction of chlorine species (such as HCl) with the Si-rich regions from
the surface at high temperature, as suggested by the decrease of both deposition rate and silicon content of
the coating [31, 33]. The formation of the solid condensates at the outlet of the tube might as well have led
to gas depletion or a pressure drop downstream. This would explain the decrease of the deposition rate as
well as the general concentration decrease observed for all species at 1100 and 1200°C (including HCl,
chlorosilanes and CH4).
5. Discussion
The deposition of SiC on the inner walls of the SiO2 tube and the use of a pyrocarbon interphase is a
very promising method for obtaining smoothed net-shape SiC tubes. The anisotropy of PyC promotes the
SiC/SiO2 interface delamination. The silicon carbide tube can easily be extracted from the silica substrate by
taking advantage of the perfectly flat SiO2/SiC interface and the thermal expansion coefficients mismatch
between the silica and the SiC.
The investigation of the influence of the various experimental deposition parameters on the coating
gives information about the type of regime controlling the CVD process in the explored conditions. For
T ≥ 1100 °C, the deposition process is apparently not thermally activated, rather suggesting a mass
transfer-limited regime [35]. This is confirmed by a strong dependence of the deposition rate on the gas flow rate, as
also reported in previous studies [33, 36]. However, since the temperature increase results in parallel in
important changes of the composition of the gas phase (and therefore of the local concentration of the
effective Si and C precursors) in the hot area, the usual assumption of a precursor supply limitation should
conditions [16] is also indicative of a regime limited by diffusion. The gas velocity is an important
parameter especially in the case of a mass transfer regime where the deposit morphology can be very
sensitive to the gas flow around the substrate. In addition, Qtot may affect the decomposition rate of
precursors through the residence time, which varies along the position in the hot area. The change in the
composition of the deposit suggests a major effect of the maturation of gas phase, i.e. of the decomposition
rate of DCMS into various intermediates, which may act as effective precursors of Si and C for the coating.
A sufficiently high deposition temperature is required to form a near stoichiometric and highly
crystalline coating. Whereas there are only a few studies on the CVD from DCMS/H2 [13-14, 37-38],
several articles on the dichlorodimethylsilane (DCDMS)/H2 system [37, 39-40] and an abundant work on
the MTS/H2 system [12, 21, 31-34] can be found in the literature. Féron et al. used the DCMS/H2 system
(α = 2,3) at atmospheric pressure in a cold wall reactor to synthesize monofilaments (∅= 200 µm) [14]. They always obtained Si-rich coatings (Si/C at. > 1.4) with much higher deposition rates (4000 µm/h at
1200 °C), according to a chemical reaction controlled regime, for T < 1200 °C. This confirms the
occurrence of a strong DCMS depletion in the present case, in a hot wall configuration and with a much
higher S/V ratio. On the other hand, Cagliostro et al. used (CH3)2SiCl2 (DCDMS) at similar temperatures
and pressure in a hot wall reactor configuration [39, 40]. They found a dependence of the deposition rate
with the total flow rate for T > 900 °C and a strong silicon excess in the coating, decreasing along the
reactor axis (i.e. while the residence time increases). A similar behavior was reported in several studies of
the MTS/H2 system in relatively similar T and P conditions. Papasouliotis et al. and Huttinger et al. indeed
evidenced, for T = 1000 °C, a decrease of both the deposition rate and the silicon excess along the hot zone
[21, 41-42]. The decreasing of the total flow rate also leads to a drop of the deposition rate (due to increase
of the residence time) [41].
Since the silica substrate cannot withstand temperatures higher than 1200 °C in the hot-wall
apparently not thermally activated, the gas flow rate (or the residence time) appears as a key parameter for
elaboration of long and thick tubes.
The gradual decomposition of DCMS above 700°C corresponds to the formation of various products in
the gas phase. The apparition of methane and hydrogen chloride, both stable species, is progressive and
tends to a plateau for the highest temperatures. The formation and consumption of the various chlorosilanes
appearing successively (Figure 8) is apparently strongly related to the silicon incorporation in the coating.
A decomposition route of the DCMS during the APCVD process can be tentatively proposed by the
analysis of the above results and the previous conclusions from the literature. Zhang and Hüttinger [21-38]
proposed a mechanism for the deposition of SiC at near atmospheric pressure from the MTS/H2 mixture, as
did Cagliostro et al. for DCDMS [41]. As for MTS, the Si-C bond is probably readily dissociated into CH3˙
and HSiCl2˙ radicals in the hot zone [21, 42-44]. This assumption was confirmed by the ab initio
calculations of Allendorf et al. [44]. The Si-H bond of DCMS or HSiCl2˙ is also probably easily broken to
form eventually SiCl2, likely a major silicon source for the coating [21, 42-44]. In parallel, CH3˙ readily
recombines into CH4, which is thermally stable and has a low surface reactivity. The chlorosilanes and SiCl4
detected by FTIR result from the recombination of the HSiCl2˙ and SiCl2 radicals, in the hot zone or during
the cooling. The higher reactivity of SiCl2 compared to CH4 is responsible for the presence of excess silicon,
especially at low temperatures and high α ratios. At high temperature (T > 1050 °C), the depletion of the
most surface reactive silicon species in favor of SiCl4, the HCl concentration increase, inhibiting
Si-deposition [29, 41, 43], and finally the formation of more reactive unsatured hydrocarbons such as C2H2
(detected at 1200 °C and above), might be responsible for the increase of the carbon ratio in the coating. On
the other hand, a higher H2 concentration (higher α) promotes the reduction of SiCl2 and therefore the
deposition of free silicon, as well as the formation of CH4, which limits the deposition of carbon.
Long and dense monolithic SiC tubes with thick walls were synthesized by CVD at atmospheric
pressure inside a SiO2 tube covered with pyrocarbon. An optimization of the process was carried out by
analyzing the influence of different parameters such as the DCMS dilution in hydrogen, the total flow rate
and the deposition temperature. The increase of deposition rate with the gas flow rate, and the low thermal
activation of the deposition process indicate that the process is limited by mass transfer. Significant changes
in the composition of the coating are observed when the deposition temperature and the H2/DCMS ratio
vary. This is related to the homogeneous reactions occurring in the reactor.
A FTIR spectroscopy analysis of the gas phase at the reactor outlet allowed its evolution to be followed
versus temperature. The analysis of pure species such as DCMS, HSiCl3 and SiCl4 allowed the experimental
assessment the values of molar absorptivities and the quantification of these products in the gas mixture.
The successive production of SiH2Cl2, SiHCl3 and SiCl4 with an explicit lineage was highlighted, along with
a continuous production of CH4 and HCl. The increase of temperature induces a depletion of the reactive
silicon species (e.g. SiCl2) and could also promote the reactivity of the carbon precursors. On the other hand
an important dilution in H2 inhibits the carbon deposition and favors the reduction of chlorosilanes, hence
resulting in a Si-rich deposit.
A thermodynamic study of the DCMS/H2 system is currently being carried out in parallel to this
experimental work.
The continuous synthesis of longer silicon carbide tubes by sliding of the heating coil along the substrate
was successfully achieved, confirming the potential of the continuous deposition process for industrial
purposes.
The mechanical testing of the samples by C-ring compression tests is in progress and should provide
mechanical properties of these CVD-SiC tube structures.
The authors also thank E. Bruneton and P. David for fruitful discussion on the project, and both CEA and
References
[1] C. Lorrette, C. Sauder, L. Chaffron, “Progress in developing SiC/SiC composite materials for advanced nuclear reactors”, ICCM 18, Jeju Island, Korea (2011) 1-4
[2] C. Ayranci, J. Carey, Compos. Struct. 85 (2008) 43–58
[3] R.H. Jones, L.L. Snead, A. Kohyama, P. Fenici, Fusion Eng. Des. 41 (1998) 15-24
[4] L. Brunel, N. Chauvin, T. Mizuno, M.A. Pauchon, J. Somers, The generation IV project GFR fuel and other core materials, GIF symposium – GEN IV international forum, 2009, Paris, France (2009), pp. 135– 141
[5] R.H. Jones, L. Giancarli, A. Hasegawa, Y. Katoh, A. Kohyama, B. Riccardi et al., J. Nucl. Mater. 307 (2002) 1057–1072
[6] Y. Katoh, A. Kohyama, T. Hinoki, L.L. Snead, Fusion Sci. Technol. 44 (2003) 155-162
[7] E.V. Dyomina, P. Fenici, V.P. Kolotov, M. Zucchetti, J. Nucl. Mater. 258-263 (1998) 1784-179
[8] A.R. Raffray, R. Jones, G. Aiello, M. Billone, L. Giancarli, H. Golfier et al., Fusion Eng. Des.55 (2001) 55-95
[9] B. Riccardi, L. Giancarli, A. Hasegawa, Y. Katoh, A. Kohyama, R.H. Jones, L.L. Snead, J. Nucl. Mater. 329-333 (2004) 56-65
[10] H. Feinroth, B.R. Hao, “Multi-Layered Ceramic Tube for Fuel Containment Barrier And Other Applications In Nuclear And Fossil Power Plants”, Patent WO2006/076039, (2006)
[11] C. Sauder, C. Lorrette, “Method for Producing a Composite Including a Ceramic Matrix”, Patent WO2012/119805, (2012)
[12] G. Chollon, R. Naslain, C. Prentice, R. Shatwell, P. May, J. Eur. Ceram. Soc. 25 (2005) 1929-1942
[13] T.T. Cheng, I.P. Jones, R.A. Shatwell, P. Doorbar, Mater. Sci. Eng., A 260 (1999) 139-145
[14] O. Féron, G. Chollon, F. Dartigues, F. Langlais, R. Naslain, Diamond Relat. Mater. 11 (2002) 1234-1238
[15] S. Puntambekar, PhD thesis, University of Leicester (1995)
[16] P. Drieux, G. Chollon, A. Allemand, S. Jacques, Ceram. Trans. 240, Processing and Properties of Advanced Ceramics and Composites V, N.P. Bansal, J.P. Singh, S. Won Ko, R.H.R. Castro, G. Pickrell, N.J. Manjooran, M. Nair, and G. Singh, Editors (2013), in press
[17] M. J. Frisch, G.W. Trucks, H.B. Schlegel, G.E. Scuseria, M.A. Robb, J.R. Cheeseman, G. Scalmani, V. Barone, B. Mennucci, G.A. Petersson, H. Nakatsuji, M. Caricato, X. Li, H.P. Hratchian, A.F. Izmaylov, J. Bloino, G. Zheng, J.L. Sonnenberg, M. Hada, M. Ehara, K. Toyota, R. Fukuda, J. Hasegawa, M. Ishida, T. Nakajima, Y. Honda,O. Kitao,H. Nakai, T Vreven, J.A. Montgomery, Jr, J.E. Peralta, F. Ogliaro, M. Bearpark, J.J Heyd, E. Brothers,K.N. Kudin, V.N. Staroverov, R. Kobayashi, J. Normand,
K. Raghavachari,A. Rendell, J.C. Burant, S.S. Iyengar, J. Tomasi, M. Cossi, N. Rega, N.J. Millam, M. Klene, J.E. Knox, J.B. Cross, V. Bakken, C. Adamo,J. Jaramillo, R. Gomperts, R.E. Stratmann, O. Yazyev, A.J. Austin, R. Cammi, C. Pomelli, J.W. Ochterski, R.L. Martin, K. Morokuma, V.G. Zakrzewski, G.A. Voth,P. Salvador, J.J. Dannenberg, S. Dapprich, A.D. Daniels, Ö. Farkas,
J.B. Foresman, J.V. Ortiz,J. Cioslowski, D.J. Fox, Gaussian 09, revision A.1, Gaussian Inc., Wallingford CT, (2009).
[18] C. Lee, W. Yang, R. G. Parr, Phys. Rev. B 37 (1988), 785. [19] A. D. Becke, J. Chem. Phys. 98 (1993), 5648.
[20] A. Allouche, B. Pourcin, Spectrochim. Acta 49A (1993), 571.
[21] G. Chollon, F. Langlais, M. Placide, P. Weisbecker, Thin Solid Films 520 (2012) 6075-6087
[22] D.E. Cagliostro and S.R. Riccitiello, J. Am. Ceram. Soc. 73 (1990) 607-614
[23] W.G. Zhang, K.J. Hüttinger, Chem. Vap. Deposition 7 (2001) 173-181
[24] D.W. Feldman, J.H. Parker, W.J. Choyke, Physical Review B 173 (1968)
[25] S. Jonas, W. S. Ptak, W. Sadowski, E. Walasek, C. Paluszkiewicz, J. Electrochem. Soc. 142 (1995) 2357-2362
[26] J. N. Burgess, T. J. Lewis, Chem. Ind. (1974) 76-77
[27] V. Hopfe, H. Mosebach, M. Erhard, M. Meyer, J. Mol. Struct. 347 (1995) 331-342
[28] G. Socrates, Infrared Characteristic Group Frequencies, third revised edition, John Wiley & Sons Ltd, New York, 2004
[29] K. Brennfleck, S. Schneweis, R. Weiss, J. Phys. IV 9 (1999) 1041-1048
[30] J. Heinrich, S. Hemeltjen, G. Marx, Mikrochim. Acta 133 (2000) 209-214
[31] G.D. Papasouliotis, V. Sotirchos, J. Electrochem Soc. 141 (1994) 1599-1611
[32] Y. Ge and M.S. Gordon, J. Phys. Chem. A 111 (2007) 1462-1474
[33] T.M. Besmann, B.W. Sheldon, T.S. Moss, M.D. Kaster, J. Am. Ceram. Soc. 75-10 (1992) 2899-2903
[34] J.E. Marra, E.R. Kreidler, N.S. Jacobson, D.S. Fox, J Am Ceram Soc 71 (1988) 1067-1073
[35] G. Astarita, Ind. Eng. Chem. 58 (1966) 18-26
[36] F. Langlais, C. Prebende, B. Tarride, R. Naslain, J. Phys. Colloq. 50 (1989) 93-103
[37] H. Vincent, C. Vincent, L. Oddou, J. Bouix, T. S. Kannan, J. Mater. Chem. (1992) 567-574
[39] D.E. Cagliostro and S.R. Riccitiello, J. Am. Ceram. Soc. 76 (1993) 49-53
[40] D.E. Cagliostro and S.R. Riccitiello, J. Am. Ceram. Soc. 77 (1994) 2721-2726
[41] G.D. Papasouliotis, S.V. Sotirchos, J. Mater. Res. 14 (1999), 3397-3409
[42] W.G. Zhang, K.J. Hüttinger, Chem. Vap. Deposition 7 (2001) 167-172
[43] F. Loumagne, F. Langlais, R. Naslain, J. Cryst. Growth 155 (1995) 205-213
Table I. Deposition conditions for the synthesis of SiC tubes in static configuration
N° Qtot (sccm) α = QH2/QDCMS T (°C) Si %at. Deposition rate (µm/h)
1 500 0 1100 45 to 60 N/A 2 500 1 1100 52 620 3 500 2 1100 55 910 4 500 4 1100 58 930 5 500 8 1100 65 650 6 500 12 1100 68 510 7 1000 4 1100 65 1170 8 250 4 1100 51 440 9 500 4 1125 58 990 10 500 4 1150 53 1080 11 500 4 1175 51 1110 12 500 4 1200 49 960
Table II. Frequencies (in this study) of the main IR features, assignment and literature values
Observed frequencies
(cm-1) Assignment
Chemical
compound Literature values 590 a(SiCl3) SiHCl3 585, 592 [26] 620 a(SiCl4) SiCl4 619 [26], 620 [25] 756 (SiC) DCMS 752, 762 [26] 807 (HSiCl) SiHCl3 805 [28] 852 (HCSi) + (HSiCl) DCMS [25] [29] 889 949 (SiH2) SiH2Cl2 960 [26] 1268 s(CH3) DCMS 1270 [26], 1272 [25] 1307 a(CH4) CH4 1305 [25], 1306 [27], 1310 [26] 2217 (SiH) DCMS 2220 [28] 2260 (SiH) SiHCl3 2260 [25], 2270 [26] 2984 a(CH3) DCMS - 3017 a(CH4) CH4 3018 [26] 2700-3100 (HCl) vibro-rotation HCl 2700-3095 [26] [30] : stretching; : bending; a : antisymmetric; s : symmetric
Figure 1. APCVD reactor for SiC deposition
Figure 2. (a) Cross section of the SiO2/PyC/SiC interfacial region. (b) Extracted SiC tube (T = 1200 °C,
Qtot = 500 sccm, α = 2, v =0.25 cm/min)
Figure 3. Influence of α (a), T (b) and Qtot (c) on the Raman features
Figure 4. Temperature (T), thickness (e) and composition (Si atomic concentration) longitudinal profiles of a coating synthesized in static configuration (α = 4, Tmax = 1100 °C, Qtot = 500 sccm)
Figure 5. Radial EPMA (a) and Raman (b) profile of a thick SiC tube (α = 2, Q = 1000 sccm, T = 1200 °C)
Figure 6. Experimental IR spectra of pure species (CH4, HCl, SiCl4, HSiCl3, CH3HSiCl2)
Figure 7. IR spectra of the gas phase (Qtot = 500 sccm, α = 4, Patm) as a function of T in 3200 – 2800 cm-1
(a), 2300 – 2150 cm-1 (b), 1360 – 1200 cm-1 (c) and 1000 – 600 cm-1 (d) frequency domains
Figure 8. Concentration of the various species in the gas phase (Qtot = 500 sccm, α = 4, Patm) as a function of
Figure 1
Figure 2
a
Figure 3
Figure 4
Figure 5 b
b a
Figure 7 d