Publisher’s version / Version de l'éditeur:
ASTM Special Technical Publication, 1082, pp. 165-177, 1990
READ THESE TERMS AND CONDITIONS CAREFULLY BEFORE USING THIS WEBSITE. https://nrc-publications.canada.ca/eng/copyright
Vous avez des questions? Nous pouvons vous aider. Pour communiquer directement avec un auteur, consultez la première page de la revue dans laquelle son article a été publié afin de trouver ses coordonnées. Si vous n’arrivez pas à les repérer, communiquez avec nous à [email protected].
Questions? Contact the NRC Publications Archive team at
[email protected]. If you wish to email the authors directly, please see the first page of the publication for their contact information.
Archives des publications du CNRC
This publication could be one of several versions: author’s original, accepted manuscript or the publisher’s version. / La version de cette publication peut être l’une des suivantes : la version prépublication de l’auteur, la version acceptée du manuscrit ou la version de l’éditeur.
Access and use of this website and the material on it are subject to the Terms and Conditions set forth at
Experimental fire tower studies on controlling smoke movement
caused by stack and wind action
Tamura, G. T.; Klote, J. H.
https://publications-cnrc.canada.ca/fra/droits
L’accès à ce site Web et l’utilisation de son contenu sont assujettis aux conditions présentées dans le site LISEZ CES CONDITIONS ATTENTIVEMENT AVANT D’UTILISER CE SITE WEB.
NRC Publications Record / Notice d'Archives des publications de CNRC:
https://nrc-publications.canada.ca/eng/view/object/?id=ad800185-598a-4949-b8f8-021bf474f100 https://publications-cnrc.canada.ca/fra/voir/objet/?id=ad800185-598a-4949-b8f8-021bf474f100Reprinted from
Characterization and Toxicity of Smoke ASTM STP 1082,1990
p. 165-177
(IRC Paper
No.
1648)NRCC
31682
NationalReseardl Condnationsl
1+1
CwndlCa-
*fedwcbscnnd.
-
Se
r
Institute for lnstitut deTH
1
I Research in recherche en,
Construction constructionN21
d
Ino.
1648
c. 2
B t D G
- -
Expetimentai Fire Tower
Sfudks
on ContmAAlm Smoke
Movement
Caused by Sbck
and Wind Action
by G.T. Tamura and J.H. Klote
I NRC
-
clsnI R C
L I B R A R Y
JAN
16
'091
B I S L I O T H ~ Q U E
I
R
C
CNRC - IC19TCanad2
/028+'602
p i
perme
des cage
:t
-
ont
t5d
tlabor6esc
dvoir
les&arts
de pression ind6sirables depart
etd'autre dcs parois es
d'ascenseurs,
- ppp enraison
------
de
l'actiondu
vent et dcl'effet de
tirage. r 'Pincendie.
Lesprkvisions ont kt6 . $rimentation incendie de dix eta lue nkessaire pour empecher 12 des dcarts
de
pression dus
i
ce kanique des cagesou
des e n dAuthor~zed Reprint from Standard Technical Publication 1082 - 1990
Copyr~ghl American Society for Testing and Materials 1916 Race Street. Philadelphia. PA 19103
George T. Tamura' and John H. Klot2
Experimental Fire Tower Studies on
Controlling Smoke Movement Caused by
Stack and Wind Action
REFERENCE: Tamura, G. T. and Klote, J. H., "Experimental Fire Tower Studies on Con-
trolling Smoke Movement Caused by Stack and Wind Action," Characterization and Toxicity of Smoke, ASTM STP 1082, H. K . Hasegawa, Ed., American Society for Testing and Materials, Philadelphia, 1990, pp. 165-1 77.
ABSTRACT: Studies have been undertaken to develop a fire-safe elevator for evacuating hand- icapped people and for aiding firefighters. Methods were developed for predicting adverse pres- sure differences across the walls of the elevator shaft and lobbies caused by wind and building stack action and in combination with those caused by a fire. The predictions were verified by tests conducted in a ten-story experimental fire tower. The level of mechanical pressurization required to prevent smoke contamination of elevators could be determined by summing the pressure differences caused by these forces. The tests demonstrated that mechanical pressuri- zation of the elevator shaft or lobbies can be effective in preventing smoke contamination of these shafts and lobbies.
KEY WORDS: elevator, pressure, smoke control, testing, fire safety, weather, high rise
Although a fire may be confined within a fire-resistant compartment, smoke can readily spread beyond it to adjacent areas through leakage paths in the enclosure, such as crack openings in the wall, floor, and ceiling, and around pipes, ducts, and doors. These openings can permit a substantial flow of toxic gases whenever the pressures in a smoke-contaminated space are greater than those in adjacent spaces.
For the purpose of this paper, smoke is considered to consist of the airborne solid and liquid particulates and gases evolved when a material undergoes pyrolysis or combustion, together with the quantity of air that is entrained or otherwise mixed into the mass. The following equation can be used to determine the rate of smoke flow
where
F = air or smoke flow rate,
C = flow coefficient,
bP = pressure difference, and
n = flow exponent.
'
Senior research officer, Institute for Research in Construction, National Research Council of Can- ada, Ottawa, Ontario, Canada.Leader of smoke management research, Center for Fire Research, National Institute of Standards and Technology, Gaithersburg, MD.
Equation 1 shows that the flow rate depends on the flow characteristics of the leakage opening in a building element (C and n) and on the pressure difference (6P) across it. This paper deals with the determination of the pressure differences caused by wind and stack action associated with normal building heating in combination with that caused by a fire. The pressure difference caused by fire because of thermal expansion and buoyancy and the pressure difference caused by the piston effect of a moving elevator car have been reported by Tamura and Klote [1,2]. Mechanical ventilation systems, when shut down during a fire emergency, provide additional passageways for smoke to leave the fire compartment but do not contribute to adverse pressure differences. If they are operating, however, imbalances in their rates of supply and exhaust can impose adverse pressure differences across the enclosure of a fire compartment.
Information on adverse pressure differences is required in designing smoke control systems to prevent smoke flow into escape routes such as stairs and elevators. The work described in this paper is part of a joint project being conducted by the National Research Council of Canada (NRCC) and the National Institute of Standards and Technology (NIST) on devel- oping a fire-safe elevator for evacuating handicapped people and for aiding firefighters. Meth- ods for calculating pressure differences caused by wind and stack action and the results of tests conducted in the ten-story experimental fire tower of the NRCC National Fire Labo- ratory are presented.
Theory
Whereas stack action due to the temperature effect of fire acts over just the fire floor height, stack action due to the temperature difference between the inside and outside air during cold weather acts over the whole building height. It causes air to flow into a building from out- doors at low levels, upward through openings in the floors and vertical shafts, and out at upper levels. A reverse flow pattern occurs during warm weather when a building is cooled. The level at which there is no air inflow or outflow is called the neutral pressure level; at this level the pressures inside and outside the building are equal. The location of the neutral pressure level for tall buildings, which depends on the size and distribution of leakage open- ings in the outside walls and interior separations, can vary from 0.3 to 0.7 of the total build- ing height [3].
The pressure differences due to stack action can be calculated by
where ,
6P, = pressure difference caused by stack action, Pa,
h
= distance from the neutral pressure level, m, g = gravitational constant, m/s2,p = air density, kg/m3,
T = absolute temperature, K, o = outdoor, and
i = indoor.
If the building interior is completely open, the pressure differences caused by stack action as calculated by Eq 2 are taken entirely across the outside walls. Equation 2 is for naturally occumng stack effect in the absence of other driving forces such as wind, a ventilation sys- tem, or buoyancy of fire gases. This relation is for constant densities, and it has been vali- dated extensively. If the interior is divided by partitions, this pressure difference is distributed
across the outside walls, interior walls, and the walls of vertical shafts. In this analysis, pres- sure losses due to vertical airflow inside the shafts are assumed to be negligible. The ratio of the pressure difference across the outside walls divided by the pressure difference as calcu- lated by
Eq
2 is called the thermal draft coefficient (1) and is an indicator of the tightness of the outside walls relative to the interior separations. It can be expressed aswhere
w = outside walls.
The value of 7 can vary from zero for a building with loose outside walls to 1.0 for a building with very tight outside walls. Values of 7 measured by Tamura and Wilson [4] for three tall open floor plan office buildings under normal operating conditions varied from 0.6 to 0.8, which indicated that the construction of the interior separations was relatively loose com- pared to that of the exterior wall. The value of -y can approach 1.0 when the central air
handling systems are shut down during a fire because the air distribution ducts interconnect all floor spaces.
Considering series flow in the horizontal direction from outdoors to inside the vertical shafts, the value of 1 can be calculated for a building with an open floor plan by
where
A = leakage area per floor, and u = walls of all vertical shafts.
The pressure difference across the outside wall is
and for the wall of the vertical shaft is
The pressure difference across an elevator lobby wall from series flow is given by
where
I
= wall of elevator lobby, ande = wall of elevator shaft on the lobby side. Substituting Eq 6 for
6P,
From Eq. 8 one can calculate a pressure difference caused by stack action that would trans- port smoke into an elevator lobby on the fire floor.
Wind is another mechanism which can cause pressure differences across the exterior and interior separations of a building. The static pressure on a building surface due to wind is
where
p, = static pressure on building surface, Pa,
C,
= wind pressure coefficient, dimensionless,p = air density, kg/m3, and V = wind speed, m/s.
The value of
C,
is usually referenced to the wind velocity at the roof level of a building. For a variety of rectangular buildings in the absence of local obstructions, the average values ofC,
with wind at 90' to one of the wall surfaces are +0.8 for the windward wall and -0.4 for leeward and side walls. With wind at 45' they are +0.5 for the windward walls and -0.5 for the leeward walls [ 5 ] .The building internal pressure depends on the building surface pressures, leakage areas of the windward and leeward walls, and leakage areas of the interior partitions; for an open plan building it depends only on the leakage areas of the windward and leeward walls. The internal pressure adjusts between the windward and leeward pressures to maintain a balance of mass air inflow and outflow across the building envelope. If a large opening is created in the windward wall of a floor by a broken window due to fire, the pressure on that floor will approach the windward pressure, resulting in pressures higher than those on other floors. This causes smoke to enter vertical shafts and adjacent floors. Conversely, if a window breaks on the leeward wall, the pressure on the fire floor approaches that of the leeward wall, result- ing in pressures lower than those on other floors. This causes air from the other floors to flow into the fire floor and smoke to flow through the opening to outdoors. Window breakage on both the windward and leeward walls can cause smoke to flow into the vertical shafts, but
its main direction of movement will be from the windward to the leeward walls. However,
fire gases will be generally driven out of thelops of broken windows by buoyancy even for windows on windward walls.
Test Procedure
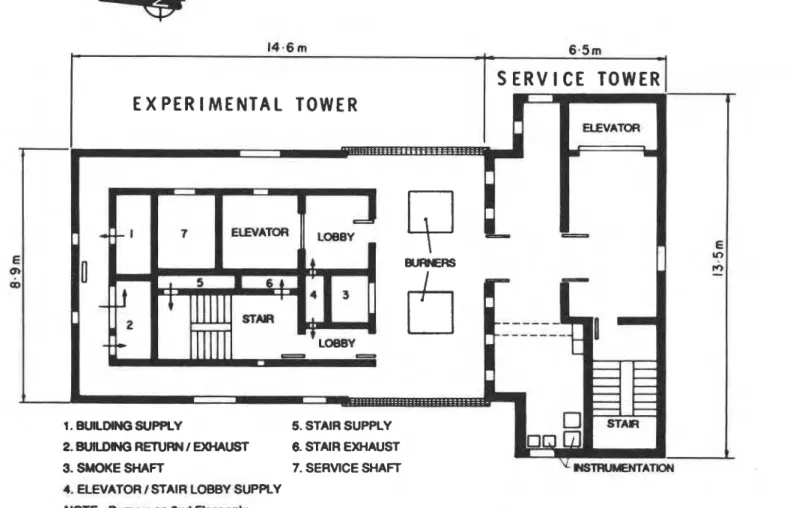
Tests were conducted in the experimental. fire tower, which is part of the experimental facilities of the National Fire Laboratory of the National Research Council of Canada, located near Ottawa, Ontario. The tower is 28 m high; the first and second floors are 3.6 m high and the other floors, 2.6 m. The plan view of a typical floor is shown in Fig. 1. The tower contains all the shafts and other features necessary to simulate air and smoke move- ment patterns in a typical multistory building, including elevator, stair, smoke exhaust, ser- vice, supply, and return air shafts. Two propane gas burner sets, each capable of producing heat at an output of 2.5 MW, are located in the second floor bum area. The exterior walls and the walls of vertical shafts have rectangular shutters that can be set to provide leakage areas of typical buildings. The leakage areas of the experimental fire tower given in Table 1 are set for a building with average airtightness and a floor area of 900 m2, or seven times that of the experimental tower. They are based on measurements on several multistory buildings by Tamura and Shaw [6,7l. The leakage openings in the outside walls are located only in the
14.6 m
L I 6.5 m
I
S
E R V l
CE TOWER
3. SMOKE SHAFT 7. SERVICE SHAFT
4. ELEVATOR I STAIR L088Y SUPPLY N Q T E - ~ o n 2 n d F l o o r o n l y
TABLE 1 -Leakagejlow areas perfloor of the experimentalfire tower (based on measurements in real buildings and simulating the air leakage characteristics of a building with a floor area of 1000 m2).
Location Area
m2
Outside walls
East wall for each floor 0.037
West wall for each floor 0.037
2nd floor east wall vent open 0.464
2nd floor west wall vent open 0.464
Elevator
Floor space to elevator shaft 0.006
Floor space to elevator lobby (lobby door closed) 0.028
Floor space to elevator lobby (lobby door open) 1.95 1
Elevator lobby to elevator shaft (elevator doors closed) 0.070
Elevator lobby to elevator shaft (elevator doors open) 0.557
Stairs
Floor space to stairshaft 0.004
Floor space to stair lobby (lobby door closed) 0.023
Floor space to stair lobby (lobby door open) 1.95 1
Stair lobby to stairshaft (stair door closed) 0.023
Stair lobby to stairshaft (stair door open) 1.951
Vertical Shafts
Floor space to service shaft 0.102
Floor space to supply air shafta 0.186
Floor space to return air shafta 0.186
Ceiling 0.052
'
Shutters for supply and return air openings closed on the second floor.east and west walls. To obtain the average wind pressure differences across the east and west wall of each floor, three outside static pressure taps that are manifolded are mounted on the outside surface, one at the center and the others 5 m on either side of the center.
Pressure differences across the outside walls and walls of all vertical shafts and associated lobbies on each floor are measured using static pressure taps mounted flush to the walls 0.3 m below the ceiling of each floor. All pressure lines are connected to a 24-port pressure switch equipped with a diaphragm-type magnetic reluctance pressure transducer and located on the same floor in the observation area. Carbon dioxide concentrations are measured on each floor in all vertical shafts, lobbies, corridors, and bum area by copper sampling tubes con- nected to a 12-port sampling switch unit with a nondispersive infrared gas analyzer. Tem- peratures are measured on each floor using chrome-alumel thermocouples at the same loca- tions as for the carbon dioxide concentrations; in addition, three thermocouple trees are placed in the bum area. All devices of the three systems are controlled and monitored by a computer-based data acquisition and control system.
The tests to investigate pressure differences caused by stack action were conducted during winter at times when wind speeds were less than 16 km/h. These tests were conducted under different combinations of temperature, leakage area, and pressurization.
1. With a thermal draft coefficient of 0.98 and with leakage areas as given in Table 1, pressure differences across the exterior walls and the walls of vertical shafts were measured when outside temperatures were - 1 I, - 3, and 7"C, with an inside temperature of 22°C. At an outdoor temperature of -3"C, the east and west exterior wall vents on the second floor were opened to simulate windows broken during a fire.
TAMURA AND KLOTE ON FIRE TOWER STUDIES 171
2. At an outdoor temperature of
-
3"C, pressure differences were measured with thermal draft coefficients of 0.98, 0.85, and 0.74, obtained by adjusting the leakage openings of the supply air, exhaust air, and service shaft.3. At an outdoor temperature of - 1
WC,
with a thermal draft coefficient of 0.98, and with the outside wall vents on the second floor open, the elevator lobbies were pressurized to 25Pa with outside air supplied to the elevator shaft. The pressure differences were then mea- sured to determine the combined effect of stack action and mechanical pressurization.
4. Under the same conditions as for Situation 3, a fire test was conducted on the second floor to determine the combined effect of stack action, mechanical pressurization, and fire. By adjusting the propane gas flow rate, the fire temperature measured directly above the gas burners and just below the ceiling was maintained at 750°C with burner output of about 270
kW.
The wind tests were conducted with wind speeds of 25 to 40 km/h, with temperature dif- ferences between inside and outside of less than 6"C, and the leakage areas set for a thermal draft coefficient of 0.98. The wind tests were conducted to determine the effect of wind on the elevator/lobby wall pressure differences under several different conditions:
1. With both outside wall vents on the second floor closed.
2. With only the windward wall vent open, 0.464 m2.
3. With only the leeward wall vent open, 0.464 m2.
4. With both wall vents open.
These tests were followed by fire tests on the second floor with the fire temperature held at 550"C, again measured directly above the gas burners and just below the ceiling and with gas burner output of about 155 kW. The elevator jobby was pressurized through the elevator shaft to I I Pa and tests were conducted with both.outside wall vents on the fire floor closed, with both outside wall vents open, and with only the windward wall vent open.
Results and Discussions
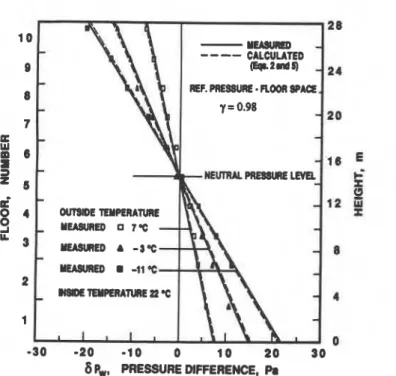
The pressure differences across the outside walls caused by stack action for y of 0.98 and outside temperatures of
-
1 1,-
3, and 7'C are plotted in Fig. 2. As shown in this graph, the neutral pressure level was located at 53% of the tower height. The calculated values using Eqs 2 and 5 are shown as dashed lines in Fig. 2; they agreed well with the nikasured values. Figure 3 shows the pressure differences measured across the elevator IobFywall at an out- side temperature of-
3°C and inside temperature of 22'C for y of 0.74,0.85, and 0.98. With the floor space as the reference pressure, a negative value indicates a flow of air from the floor space into the elevator lobby and a positive value indicates a flow in the opposite direc- tion. In case of fire, therefore, a negative value would indicate a flow of smoke into the ele- vator lobby. The values calculated using 8 for the same conditions agreed within 10% of the measured values. The good agreement7%
tween measurement and theory shown in Figs.2 and 3 revalidates Eq 2 and validates E~ 8 over a wide range of leakage conditions repre- sentative of many commercial buildings.
For 7 = 0.98, the pressure difference across the elevator lobby wall on the second floor was -0.5 Pa; when the outside wall vents on the second floor were opened, it increased to
-
5.4 Pa. This was accompanied by the lowering of the neutral pressure level from 53 to 4 1%of the building height; if it had remained at the same level, the pressure difference would have been -7.5 Pa across the elevator lobby wall at the second floor level. Assuming a pres- $)tre difference across the elevator lobby wall equal to that using Eq 2 and with the neutral
24 RV. PRESSURE FLm SP 20 1 8 E
k!
e
12g
-
a
4 0 -30 -20 -10 0 10 20 306
b,
PRESSURE DIfTERENCE, PIFIG. 2-Pressure d~yerences across oufside wall versus outside air temperature.
FIG. 28 24 20 16 E
P
12g
8 4 I-
I + REFERENCE-
FLOOA SPACE 0-
-
MIIIIIAL P R W R E LEVEL-
-
fCYPCllhlllllE'
0I
-15 -10 - 5 0 6 10 16 6P8, PRESSURE DIFFERENCE, PI3-Pressure differences across elevator lobby wall versus thermal draji coeficient
(d
H ' 4 -
ii
3 N8DE 22%-
OUTSIDE 4 %-
-
CALCUUlED (Eq. 0)-
-
2 d-
-
TAMURA AND KLOTE ON FIRE TOWER STUDIES 173
pressure level unchanged would give a conservative estimate for the situation where windows were broken.
In the field of air infiltration in buildings, it is generally accepted that adding the pressure differences caused by stack action and wind action is a good approximation to the pressure difference resulting from the two in combination. Experiments were conducted to see to what extent this approximation is appropriate to smoke control. The results of tests conducted to check the effect of pressurizing the elevator shaft with unheated outside air at - 10°C and with the outside wall vents open on the second floor are shown in Fig. 4. The adverse pressure difference across the elevator lobby wall of the second floor without pressurization was -7.0 Pa. The elevator shaft was then pressurized, creating a pressure difference across the lobby wall on the second floor of 24 Pa. The supply air rate required for pressurization was 1400 L/s as compared to 1300 L/s with little or no stack action [ 8 ] . The calculated supply air rate based on the sum of the pressure difference caused by stack action and the NFPA 92A [9] recommended design pressurization of 25 Pa to deal with fire-induced pressure was 1470 L/
s, which agreed well with the measured value. Figure 4 also shows the effect of fire at 750°C on the pressure difference across the wall of the pressurized elevator lobby. The pressure difference across the elevator lobby wall under fire conditions decreased from 24 to 15 Pa, a decrease of 9 Pa, which compares with the adverse pressure difference of -7 Pa caused by the fire of 750°C [ I ] . Thus the sum of the adverse pressure differences caused by stack action and fire should give a good estimate of the amount of pressurization required to prevent smoke migration into the elevator lobby for the test conditions. For these experiments, the smoke control system was balanced with a large opening from the fire floor to outside, which represented an open or broken window. For a system balanced without such an opening, a
\
ELEVATOR LOBBY WALL. 6 PCA PRESSURIZATION OULV
I PR€SSUWZAlWN AND FYIE
I FlRE
-30 -20 -10 0 10 20 30
PRESSURE DIFFERENCE, PI
FIG. 4-Pressure drflerences across outside wall and elevator lobby wall with elevator pressurization (untempered outside supply air) andfrre (750°C).
-
m r-
-
I A-
-
REF.PRESSURE. noon SPACE-
C rm--
4 I TEUPERATURE-
I A I m 22%-
OUTSlOE -10 %-
I 1-
I I l l I l l - 2 0 16 12 6 4 0broken window would result in a pressure jump across the elevator lobby, and the approach of adding wind effect and stack effect pressures would need to incorporate this jump as well. During the bum tests, concentrations of carbon dioxide (one of the products of combus- tion) measured throughout the tower were regarded as surrogate smoke, and detailed infor- mation about these tests are provided by Tamura and Klote [ I ] . With the elevator shaft pressurized, the concentration of carbon dioxide relative to that in the bum area in the ele- vator shaft and lobbies was zero, except in the elevator lobby on the second floor, where it was 2.5%; concentrations less than 1% are assumed to be reasonably safe from a considera- tion of smoke obscuration [ l o ] . Combustion products may have infiltrated the lobby due to thermal expansion of gases during the startup of the gas burners. With the elevator lobbies pressurized, the concentrations were zero in the lobbies and elevator shaft. This indicates that the lobby pressurization provides a higher level of protection, but a detailed hazard anal- ysis would be required to determine the extent to which lobby pressurization is better.
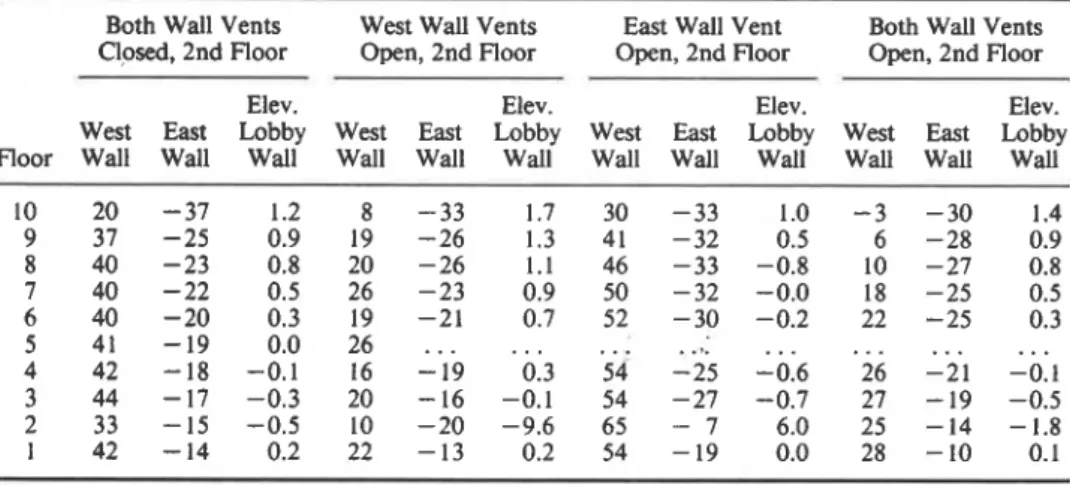
Five wind tests with wind speeds ranging from 25 to 40 km/h with normal fluctuation and steady wind directions from W, WNW, and NW were conducted without a fire. They were intended to determine the effect of wind on the pressure differences across the elevator lobby wall for various settings of outside wall vents on the second floor. Table 2 gives the pressure differences across the west wall, east wall, and elevator lobby wall for the ten floors, for an average wind speed of 30 kmlh from WNW. This was measured with an anemometer mounted on a pole on top of the tower, 36
m
above ground level; the long axis of the tower is oriented in the north-south direction (Fig. 1). The corresponding wind speed measured with an anemometer 10 m above ground and 60 m west of the tower in an open field was about 25 km/h. The pressure differences across the windward wall (west) were about 40 Pa, about twice those of the leeward wall. Tests with wind from the west of 20 to 25 km/h gave similar results. From mass flow balance and with no leakage openings in the north and south walls, pressure differences across the west and eqst walls with equal openings should have been about the same. The effective area of the vkpt opening in the windward wall was less than that in the leeward wall by a factor of about 0.7. This could have been caused by some flow phenomenon such as stationary vortices resulting from fluctuations in wind speed or direction. Whether this reduction in effective area would occur when the vent area is distrib- uted as cracks and not as a rectangular opening needs to be investigated.TABLE 2-Pressure d~yerences across outside walls and elevator lobby walls for wind of 30 krn/h, WN W, Pa (reference pressure-floor space).
Both Wall Vents West Wall Vents East Wall Vent Both Wall Vents Closed, 2nd Floor Open, 2nd Floor Open, 2nd Floor Open, 2nd Floor
Elev. Elev. Elev. Elev.
West East Lobby West East Lobby West East Lobby West East Lobby Floor Wall Wall Wall Wall Wall Wall Wall Wall Wall Wall Wall Wall
TAMURA AND KLOTE ON FIRE TOWER STUDIES 175 For the five wind tests, the pressure differences across the elevator lobby wall on the second floor with both the windward and leeward wall vents closed varied from -0.1 to -0.5 Pa;
when the windward wall vent on the second floor was opened, they varied from - 1.5 to
-9.6 Pa; when only the leeward vent was opened, they varied from 0.0 to 6.0 Pa; and when
both vents were opened, they varied from -0.1 to - 1.8 Pa.
The serious case is when only the windward wall vent is open. The value of -9.6 Pa for the elevator lobby wall represents a factor of 0.2 of the velocity head of 25 km/h measured at 10-m height in the open field. The corresponding value for the elevator shaft wall was
- 18 Pa or 0.37 of the velocity head. A factor of 0.5 of the velocity head may be appropriate
to use for the adverse pressure due to wind in designing a pressurization system for buildings whose windows may break during a fire. Wind velocity for a given building height and sur-
rounding terrain can be obtained from information given in Ref 5.
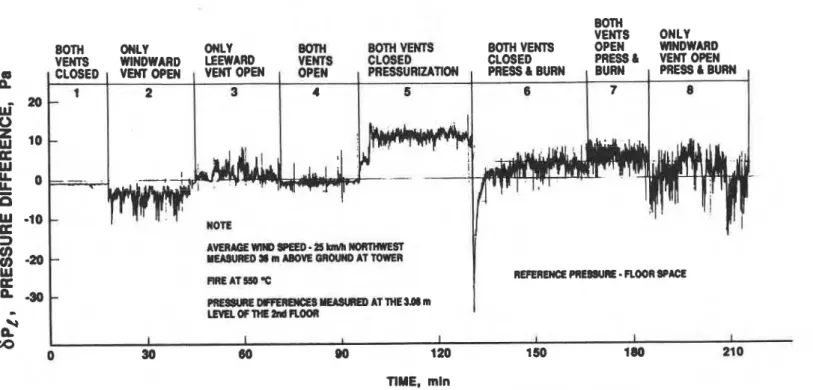
To evaluate the performance of the smoke control system, wind tests were also conducted with a fire of 550°C on the second floor. Figure 5 shows the pressure differences measured across the elevator lobby wall at the 3.08-m level of the second floor. They are for an average wind speed of 25 km/h from the northwest measured on top of the tower. Before the fire test, when both vents on the second floor were closed, the pressure difference across the ele- vator lobby wall was -0.5 Pa. When only the windward outside wall vent was opened, it was -4.0 Pa; when only the leeward outside wall vent was opened, it was 1.2 Pa; and when both vents were opened, it was back to -0.5 Pa, the same as when both vents were closed. The elevator lobby was pressurized to 1 1 Pa with outside air supplied to the elevator shaft. This pressure difference was reduced to about 5 Pa when the burner was ignited and the fire temperature was controlled at 540°C; this is a reduction of 6 Pa, which compares with the
adverse pressure caused by fire alone of -5 Pa [I]. When both leeward and windward wall
vents were opened, the pressure difference was 6 Pa, but when only the windward wall vent
was opened it fluctuated between
+
6 Pa.During the burn period with pressurization of the elevator shaft/lobby and with both vents closed (Step 6 of Fig. 5) and with them open (Step 7 of Fig. 5), the carbon dioxide concen- trations were less than 1% of that in the burn area for both the elevator shaft and the lobbies on all floors, except for the lobby on the second floor, which had a concentration of 1.5%, probably caused by thermal expansion of gases at the time of ignition of the burner. The concentrations in the unpressurized stairshaft, stair lobby, and all floor spaces were well above the 1% level. When only the windward wall vent was opened, the concentrations in the elevator shaft and lobbies were less than I%, except for the second floor lobby, where the concentration was 1.7%. In comparison, the concentration on the second floor in the unpres- surized stairshaft was 28% and in the stairshaft lobby, 48%.
Mechanical pressurization of the elevator shaft with outdoor air greatly reduces the pos- sibility of smoke contamination of the elevator shaft and lobbies. However, under high wind some smoke contamination can be expected with window breakages only in the windward wall. Venting also the leeward wall would greatly decrease this possibility as smoke would move horizontally from the windward to the leeward walls. Further study of wind effects is needed.
Summary
1. The good agreement between measurements and stack effect theory shown in Figs. 2
and 3 revalidates Eq 2 and validates Eq 8 over a wide range of leakage conditions represen-
tative of many commercial buildings.
2. For the conditions of these experiments, the adverse pressure differences of stack action and fire can be added to provide a good approximation of the pressure difference resulting
BOTH ONLY ONLY WIH gOTHYEMS BOTH VENTS
O$EK
W~NDWARD
VENTS WINDWARD LEEWARD YEWS CLOSED CLOSED PRESS 6 VENT OPENI CLOSED 1 V W l OPEN i VENT OPEN I OPEN I PRESSUREATION I PRESS 6 BURN I BURN I PRESS 6 BURN I
h W M m M - - 2 5 M -
Y ~ 5 1 m M O V € O A O Y W D A f M w E l
AMIIT6W.e; REFERENCE WESSUR€ FLOOR SPACE
TIME, mln
TAMURA AND KLOTE ON FIRE TOWER STUDIES 177
from the two acting in combination and, hence, the amount of pressurization required to prevent smoke migration into the elevator lobbies under these conditions. A broken window can result in a jump in pressure difference across the elevator lobby, which is an important factor for designing these systems in most buildings.
3. Mechanical pressurization of the elevator shaft or of elevator lobbies greatly reduces the possibility of smoke contamination of the elevator shaft and lobbies due to stack action.
4. Mechanical pressurization of the elevator shaft greatly reduces the possibility of smoke contamination of the elevator shaft and lobbies due to wind action. However, further studies of wind effects are needed.
5. This study has provided methods for predicting adverse pressure differences across the walls of the elevator shaft and lobbies caused by wind and building stack action and in com- bination with those caused by a fire. Such design information is needed to determine the level of mechanical pressurization required to prevent smoke from entering the elevator shaft and lobbies.
Acknowledgment
The authors greatly acknowledge the contribution of R. A. MacDonald in setting up and conducting the tests in the experimental fire tower and processing the test results, of J. E.
Berndt for assisting in running the data acquisition and control system and the gas burner system, and of other staff members of the National Fire Laboratory in assisting during the preparation and conduct of the tests.
References
[ I ] Tamura, G . T. and Note, J. H., "Experimental Fire Tower Studies on Mechanical Pressurization to Control Smoke Movement Caused by Fire Pressures," Proceedings, 2nd International Sympo- sium on Fire Safety Science, Tokyo, Japan, 1988.
[ 2 ] Note, J . H. and Tamura, G. T., "Experiments of Piston Effect on Elevator Smoke Control," ASH-
RAE Transactions, Vol. 93, Pt. 2, 1987, pp. 2217-2228.
[ 3 ] "Handbook of Fundamentals, Chapter 22, Ventilation and Infiltration," American Society of Heating, Refrigerating, and Air-Conditioning Engineers, Inc., Atlanta, 1985, p. 22.3.
[ 4 ] Tamura, G. T. and Wilson, A. G., "Pressure Differences Caused by Chimney Effect in Three High Buildings," ASHRAE Transactions, Vol. 73, Part 11, 1967, p. 11.1.1-11. I. 10.
[ 5 ] "Handbook of Fundamentals, Chapter 14, Air Row Around Buildings," American Society of Heating, Refrigerating, and Air-Conditioning Engineers, Inc., Atlanta, 1985, p. 14.3.
[ 6 ] Tamura, G. T. and Shaw, C. Y., "Air Leakage Data for the Design of Elevator and Stair Shaft Pressurization Systems," ASHRAE Transactions, Vol. 82, Part 2, 1976, pp. 179-180.
[7] Tamura, G. T. and Shaw, C. Y., "Experimental Studies of Mechanical Venting for Smoke Control in Tall Office Buildings," ASHRAE Transactions, Vol. 84, Part 1, 1978, pp. 54-7 1.
[8] Tamura, G. T. and Note, J. H., "Experimental Fire Tower Studies of Elevator Pressurization Sys- tems for Smoke Control," ASHRAE Transactions, Vol. 93, Pt. 2, 1987, pp. 2235-2256.
[ 9 ] NFPA 92A, "Recommended Practice for Smoke Control Systems," National Fire Protection Asso- ciation, Quincy, MA, Section 2-2.1, 1988.
[ l o ] McGuire, J. H., Tamura, G. T., and Wilson A. G., "Factors in Controlling Smoke in High Build- ings," Proceedings, ASHRAE Symposium on Fire Hazards in Buildings, San Francisco, CA, ASH- RAE, Atlanta, GA, 1970, pp. 8-13.