Open Access
Methodology article
Innovative approach for transcriptomic analysis of obligate
intracellular pathogen: selective capture of transcribed sequences
of Ehrlichia ruminantium
Loïc Emboulé*
1, France Daigle
2, Damien F Meyer
1, Bernard Mari
3,
Valérie Pinarello
1, Christian Sheikboudou
1, Virginie Magnone
3,
Roger Frutos
4, Alain Viari
5, Pascal Barbry
3, Dominique Martinez
4,
Thierry Lefrançois
1and Nathalie Vachiéry*
1Address: 1UMR 15 CIRAD-INRA «Contrôle des maladies animales exotiques et émergentes», Site de Duclos, Prise d'Eau 97170, Petit Bourg, Guadeloupe, 2Département de microbiologie et immunologie, Université de Montréal, C.P 6128 succursale Centre-ville, Montréal, QC H3C3J7, Canada, 3UMR6097, CNRS-Université de Nice Sophia Antipolis, Institut de Pharmacologie Moléculaire et cellulaire, Sophia Antipolis, F06560, France, 4UMR 15 CIRAD-INRA «Contrôle des maladies animales exotiques et émergentes», TA 30/G Campus international de Baillarguet 34398 Montpellier Cedex 5, France and 5Inria Rhône-Alpes Projet HELIX, 655 Av. de l'Europe, 38330 Montbonnot-Saint Martin, France
Email: Loïc Emboulé* - loic.emboule@cirad.fr; France Daigle - france.daigle@umontreal.ca; Damien F Meyer - damien.meyer@cirad.fr; Bernard Mari - bernard.mari@unice.fr; Valérie Pinarello - valerie.pinarello@cirad.fr; Christian Sheikboudou - christian.sheikboudou@cirad.fr; Virginie Magnone - magnone@ipmc.cnrs.fr; Roger Frutos - roger.frutos@cirad.fr; Alain Viari - Alain.Viari@inrialpes.fr;
Pascal Barbry - barbry@ipmc.cnrs.fr; Dominique Martinez - dominique.martinez@cirad.fr; Thierry Lefrançois - thierry.lefrancois@cirad.fr; Nathalie Vachiéry* - nathalie.vachiery@cirad.fr
* Corresponding authors
Abstract
Background: Whole genome transcriptomic analysis is a powerful approach to elucidate the
molecular mechanisms controlling the pathogenesis of obligate intracellular bacteria. However, the major hurdle resides in the low quantity of prokaryotic mRNAs extracted from host cells. Our model Ehrlichia ruminantium (ER), the causative agent of heartwater, is transmitted by tick Amblyomma variegatum. This bacterium affects wild and domestic ruminants and is present in Sub-Saharan Africa and the Caribbean islands. Because of its strictly intracellular location, which constitutes a limitation for its extensive study, the molecular mechanisms involved in its pathogenicity are still poorly understood.
Results: We successfully adapted the SCOTS method (Selective Capture of Transcribed
Sequences) on the model Rickettsiales ER to capture mRNAs. Southern Blots and RT-PCR revealed an enrichment of ER's cDNAs and a diminution of ribosomal contaminants after three rounds of capture. qRT-PCR and whole-genome ER microarrays hybridizations demonstrated that SCOTS method introduced only a limited bias on gene expression. Indeed, we confirmed the differential gene expression between poorly and highly expressed genes before and after SCOTS captures. The comparative gene expression obtained from ER microarrays data, on samples before and after SCOTS at 96 hpi was significantly correlated (R2 = 0.7). Moreover, SCOTS method is crucial for microarrays analysis of ER, especially for early time points post-infection. There was low detection of transcripts for untreated samples whereas 24% and 70.7% were revealed for SCOTS samples at 24 and 96 hpi respectively.
Published: 24 December 2009
BMC Molecular Biology 2009, 10:111 doi:10.1186/1471-2199-10-111
Received: 9 April 2009 Accepted: 24 December 2009 This article is available from: http://www.biomedcentral.com/1471-2199/10/111
© 2009 Emboulé et al; licensee BioMed Central Ltd.
This is an Open Access article distributed under the terms of the Creative Commons Attribution License (http://creativecommons.org/licenses/by/2.0), which permits unrestricted use, distribution, and reproduction in any medium, provided the original work is properly cited.
Conclusions: We conclude that this SCOTS method has a key importance for the transcriptomic
analysis of ER and can be potentially used for other Rickettsiales. This study constitutes the first step for further gene expression analyses that will lead to a better understanding of both ER pathogenicity and the adaptation of obligate intracellular bacteria to their environment.
Background
Elucidating molecular mechanisms that drive the adapta-tion of obligate intracellular pathogens to their host is cru-cial to understand their pathogenesis. To date, molecular studies on obligate intracellular bacteria can only be per-formed ex vivo at one time or in vitro in host cells. Thus, RNA extraction from infected cell cultures leads to low quantities of prokaryotic mRNAs with short half-lives and a high amount of contaminant eukaryotic RNAs [1,2]. Moreover, in prokaryotic RNA, ribosomal RNAs (rRNAs) represent more than 80% of total RNA, whereas mRNAs represent only 2% of total RNAs. Therefore, high through-put gene expression analysis of obligate intracellular bac-teria depends strongly on the quality of mRNAs samples, deprived from ribosomal RNAs and host RNAs. Up to recently, no methods were available to obtain purified obligate intracellular bacteria mRNAs from infected cells. Various methods can be used to monitor the complete set of RNA molecules produced by a microorganism, includ-ing both targeted and random approaches. Among the lat-ter are differential expression of customized amplification libraries (DECAL) [3] and Selective Capture Of Tran-scribed Sequences (SCOTS) [4], techniques that combine polymerase chain reaction (PCR) and subtractive hybridi-zation in order to identify genes that are expressed differ-entially. DECAL method is a powerful technique that permits global comparisons of bacterial gene expression under various growth conditions. It allows direct determi-nation of differential gene expression by comparison of relative intensity with which PCR probes hybridize with individual colonies. However, this method has the disad-vantage of being time-consuming and more complex to implement because of the construction of the Customized Amplification Library (CAL). Moreover, this technique does not assure to cover all the genome and several genes could be not detected, thus compelling to construct more complete CALs. Selective capture of transcribed sequences (SCOTS) was initially developed by Graham and Clark-Curtiss in 1999 for the non obligatory intracellular path-ogen Mycobacterium tuberculosis and allowed to enlighten bacterial gene expression from different growth condi-tions in macrophages cells. It was also later used for Sal-monella enterica serovar Typhi [5] and then used successfully for further transcriptomic microarray analysis [6]. Recently, SCOTS was employed to identify the in vivo expression of several genes of Actinobacillus pleuropneumo-niae at different developmental stages post infection [7,8] but was never applied on obligate intracellular pathogens.
The Rickettsia Ehrlichia ruminantium (ER), (previously Cowdria ruminantium) is the causative agent of heartwater, which affects both wild and domestic ruminants and is transmitted by ticks of the genus Amblyomma [9]. Heart-water represents a serious problem for livestock produc-tivity in endemic areas such as sub-Saharan Africa and the West-indies and it poses a severe threat to livestock in the American continent due to migratory birds and the pres-ence of potential indigenous vector ticks [10,11]. The gen-otypic heterogeneity of the bacterium leads to difficulties for the generation of an efficient vaccine [12-15]. Little is known about the genetic determinants and molecular mechanisms of ER pathogenesis, due to its isolated intra-cellular location. ER was considered to be a good model to evaluate the feasibility of SCOTS method for obligate intracellular bacteria. Indeed, ER is a gram negative bacte-rium that belongs to alpha proteobacteria and is an obli-gate intracellular pathogen that infects the endothelium of all blood vessels. ER has a complex life cycle described as chlamydia-like developmental cycle [16]. In the early stage of the cycle, elementary bodies, which represent the extracellular and infectious forms of the parasite, adhere to host target cells and then are engulfed. They remain within intracytoplasmic vacuoles, where they divided by binary fission to produce intermediate bodies and further reticulated bodies. After 4 to 6 days, the disruption of host cell leads to the release of numerous elementary bodies thus initiating a new infectious cycle. The genomic organ-ization of this microorganism was revealed by the genome sequencing of two strains: Gardel and Welgevonden [17]. Even if comparative genomic studies provided data on the active mechanisms of genome plasticity [18,19], almost 30% of genes had unknown functions and genes involved in virulence, host cell penetration or invasion and intrac-ellular growth processes remain unidentified.
Expression analysis of ER genes during life cycle, between attenuated and virulent strains, will allow the identifica-tion of the key factors involved in virulence mechanisms and the development of the bacteria. From the sequencing of Gardel and Welgevonden strains, whole genome ER microarrays were designed in order to validate sample quality obtained by SCOTS method and to evaluate the potential use of this method for further ER whole tran-scriptomic analysis. In vitro model using bovine endothe-lial cells and virulent Gardel strain allowed us to obtain a sufficient amount of ER RNA to perform such a study.
In this article, we report for the first time the successful adaptation of the SCOTS method to an obligate intracel-lular bacterium, ER. We demonstrate the efficient isola-tion of specific bacterial transcripts from total RNA after 3 rounds of capture, with low amounts of 16S ribosomal RNA contaminant. Moreover, besides the use of PCR amplifications, the differential gene expression was still detected by qRT-PCR and microarrays analysis. SCOTS method seems to be crucial for the analysis of gene expres-sion especially at early stage of ER development during the lag phase.
Methods
Extraction of ER RNA from bovine infected cells
The Gardel strain stock was isolated in 1982 in Guade-loupe from a goat infected experimentally with Amblyo-mma variegatum ticks collected from cows [20]. Gardel strain passage 39 and passage 47 were multiplied succes-sively in bovine aorta endothelial (BAE) cells grown in Glasgow minimal essential medium complemented with fetal calf serum, tryptose-phosphate broth, and antibiotics [21] at 37°C, 5% CO2, with a weekly passage on fresh cells [22]. BAE cells were infected with a calibrated inocu-lum of Gardel strain (1.1 × 10⁷ elementary bodies per 1.42 × 10⁶ cells). Estimation of bacterial viability and quantity were both carried out by flow cytometry and fluorescent microscopy using live/dead BacLight Bacterial Viability Kit (Invitrogen, France) [23]. The infected cells were incu-bated at 37°C in a 5% CO2 atmosphere. The supernatant was renewed only 24 h (6 ml) after infection and the cell monolayer was harvested by trypsinization every 24 h and centrifuged at 1700 × g for 5 min at 4°C. When 80% cell lysis was observed, after 120 hours post infection (hpi), supernatant and cellular debris were harvested and then ultra-centrifuged at 20,000 × g for 15 min at 4°C to collect elementary bodies. The pellets were placed in sterile eppendorfs and homogenized in 2.5 ml of TRIzol reagent (Invitrogen). The cells lysed immediately and released RNA and DNA in the supernatant. The samples were immediately stored at -80°C before RNA extraction. Extraction of total RNA with TRIzol
For each time of collection after cell lysis (24 to 120 hpi), total RNA extraction procedure was carried out with TRI-zol reagent (Invitrogen) according to the manufacturer's instructions. RNA pellets were dissolved in 100 μl of DEPC water and treated with turboDNAse (Ambion, France) according to manufacturer's protocol in order to remove all contaminant DNA. The removal of bacterial genomic DNA (gDNA) contaminant in RNA samples was verified by PCR targeting pCS20 gene using primers AB128 and AB129 which amplified specifically a 281 pb of ER as described previously [24] (table 1). The quantifi-cation of total RNA was performed by fluorimeter using ribogreen reagent (Invitrogen). The yield obtained after
the extraction was between 3 to 25 μg. For each time of collection, total RNA samples were pooled in RNase free water at a final concentration of 0.5 μg/μl.
ER gDNA production and ER ribosomal DNA (rDNA)
cloning for SCOTS method
Genomic DNA (> 50 μg) from Gardel strain passage 40 was extracted from elementary bodies, as previously described [18,25]. After high speed centrifugation (20,000 × g during 30 min), the pellet of elementary bodies was resuspended in 350 μl of saline phosphate buffer. 150 μl of DNase (1 μg/ml) was added to remove the contami-nant bovine DNA from host cells and the samples were incubated at 37°C for 90 min. The treatment was stopped by adding 25 mM of EDTA. Whole bacterial DNA was obtained using QIAamp extraction kit (Qiagen, France) [26].
In ER, the organization of the rrn operon coding the rRNAs is not canonical as the gene coding the 16S rRNA is 900 kb distant from the 23S-5S gene cluster [17]. Both rRNA 16S and 23S - 5S cluster sequences were amplified using specific primers derived from ER genome: rRNA 16SGarF- rRNA 16SGarR for 16S and rRNA5GarR; rRNA23SGarR for 5S-23S cluster (table 1). The PCR prod-ucts were cloned into the high copy number vector pGEM-T Easy (Promega, France). Competent Escherichia coli SURE2 cells were transformed with plasmid containing the inserts and isolated on LB-ampicillin-XGal (5-bromo-4-chloro-3-indol-β-D-galactopyranoside)-IPTG (isopro-pyl-β-D-thiogalactopyranoside) selective medium. Posi-tive clones were selected and the presence of the insert was checked using the specific primers previously cited. Trans-formants were grown in LB medium with appropriate antibiotic (Ampicillin 100 μg/ml) and plasmid extraction was carried out with plasmid purification Maxi kit (Qia-gen) according to manufacturer's protocol. Up to 300 μg of plasmid pellets were homogenized in TE buffer pH 7.5. Both gDNA and rDNA were quantified by fluorometer using picogreen reagent (Invitrogen).
Selective capture of transcribed sequences (SCOTS) For each time of the kinetic, 5 μg of total RNA from Gardel strain passage 39 was reverse transcribed by random prim-ing with Superscript II (Invitrogen) accordprim-ing to manufac-turer's instructions. The reverse transcription was done using KpnI-RNA primers (table 1) containing a defined 5' terminal sequence as a tag and a random nonamer at the 3' end as in conditions previously described by [27] and [5]. Second-strand cDNA was synthesized by using Kle-now fragment (Biolabs, France). Then, cDNA was ampli-fied by PCR using the specific primers corresponding to the KpnI tag. This corresponded to cDNA before SCOTS (SCOTS 0×). Reactions were prepared using the following PCR conditions: initial denaturation of 3 min at 94°C
fol-lowed by 25 cycles at 94°C for 45 s, at 60°C for 45 s, at 72°C for 60 s and a final extension of 10 min at 72°C. Selective capture of bacterial cDNA was done as previ-ously described by [4] and [28]. ER gDNA (0.3 μg) was photobiotinylated and then mixed with the rDNA 16S and 23S+5S (0.5 μg of each plasmid pGEMT) in order to block the rRNAs region sites on the gDNA in TE buffer pH 9. The mixture was then sonicated and precipitated in eth-anol 100% (2.5 v/v), NaOac 3 M (0.1 v/v) and 1 μl Glyco-gen (1 μg/ml). The gDNA-rDNA mixture and 5 μg cDNA were denatured separately 3 min at 99°C in 4 μl of hybrid-ization buffer (10 mM EPPS [N-(2-hydroxyethyl) piper-zine-N'-3-propanesulfonic acid]/1 mM EDTA) and pre-hybridized at 50°C for 30 min. The temperature of hybridization was evaluated from the percentage of GC of ER genome (27%). The prehybridization step allows the hybridization of ER rDNA to the gDNA, as it also allows the normalization of bacterial and eukaryotic cDNA by self-hybridization of highly present cDNA [29,30]. Imme-diately after adding 1 μl of NaCl 1.5 M, the cDNA and bac-terial gDNA pre-blocked with rDNA (gDNA-rDNA) were mixed and hybridized for 18 h at 50°C (hybridization step). Hybrids, representing ER cDNA fixed to ER gDNA, were captured with streptavidin-coated magnetic beads
(Dynal 280) according to the manufacturer's protocol. Selective cDNA was then eluted in 100 μl of NaOH 0.4 N, precipitated and amplified by NKpnI specific PCR as described. The PCR products were then visualized by ethidium bromide staining in 1.2% agarose gels (Seakem) in 1 × TAE buffer (40 mM Tris-HCl, 6% acetic acid, 1 mM EDTA, pH8) and purified with PCR purification kit (Qia-gen). The initial amount of total RNA before SCOTS method for each time of infection was between 10 to 20 μg and was divided in 2 to 5 tubes with 0.5 μg/tube. After this first round (SCOTS 1×), the tubes corresponding to one condition were pooled and 10 μl to 20 μl of the pooled sample were precipitated depending on the inten-sity of purified cDNAs from the previous round. Two additional rounds of capture (SCOTS 2× and 3×) were performed for each sample at each time point of infection (24, 48, 72, 96 and 120 hpi) for further microarrays and qRT-PCR analyzes.
Microarrays experiments a. ER Microarrays design
ER microarrays (8 × 15 k) used in this study were devel-oped based on long oligo arrays generated by Agilent tech-nology. These arrays contain 60-mer probes corresponding to 936 coding sequences (CDS) of Gardel Table 1: Primers used for the detection of specific ER genes
Primer name Primer sequence Target gene or
sequence
Product size (bp)
source (references)
ffh-F2a 5' GGTAGGTCTTCAAGGTGTTGGTAAA 3' Ffh 121 this work
ffh-R2 5' AGTTTGAGCTGCAGGACGATATAA 3'
recA-F1a,b 5' TTGAAAAAGCGTTTGGTCGTG 3' recA 121 this work
recA-R1 5' GGGAAACCACCAATACCCAAT 3'
rpoD-F1a,b 5' CAGAGGGTTGCAATTTCTTGATT 3' rpoD 121 this work
rpoD-R1 5' TCTGACCCACCATGTTGCAT 3'
16S-F1a b 5' AGCGCAACCCTCATCCTTAG 3' rRNA 16S 121 this work
16S-R1 5' AGCCCACCCTATAAGGGCC 3'
map1gardFa,b 5' CACTTGAAGGAATGCCAGTTTCTC 3' map1 85 this work
map1gardR 5' CTTAGGATTTGTAGCATTGATTACTGACACT 3'
AB128 5' ACTAGTAGAAATTGCACAATCTAT 3' pCS20 278 Martinez et al., 2004
AB129 5' TGATAACTTGGTGCGGGAAATCCTT 3'
NKpn1-pdN9 5' GTGGTACCGCTCTCCGTCCGANNNNNNNNN 3' KpnI / Daigle et al., 2001
NKpn1 5' GTGGTACGGCTCTCCGTCCGA 3' NKpnI tag 200-400
ARN16SGarF 5' AACTTGAGAGTTTGATCCTGGCT 3' rRNA 16S 1503 this work
ARN16SGarR 5' AGGAGGTAATCCAGCCGCAGGTT 3' this work
ARN5SGarR 5' TCTCCCGTGCCTTAAGACAAA 3' rRNA 23S 2935 this work
ARN23SGarF 5' TTGATGGATGCCTTGGCGTTAA 3' rRNA 5S this work
a: pair of primers use for RT-PCR b: pair of primers use for qRT-PCR
strain and 909 sequences of Welgevonden strain, includ-ing the specific CDSs for each strain determined by the previous annotation of the two genomes [17]. The probes were designed using the following procedure: first, all 60-mer probes were generated from CDS of Gardel and Wel-gevonden strains using standard thermodynamical con-straints (TM ∈ [78, 83] and GC ∈ [20,36]) and a modified version of the OligoArray program [31]. For non specific CDSs, we chose the same probe for the same pair of orthologs between Gardel and Welgevonden strains. Then, we selected 1 or 2 of the most specific probes per gene by minimizing the number of matches to human and bovine mRNAs, extracted from the Ensembl database [32]. The microarrays contained a total of 1800 probes, with 5 replicates per probe, including 28 bovine genes as negative controls. Experimental data and associated microarray designs have been deposited in the NCBI Gene Expression Omnibus (GEO) http:// www.ncbi.nlm.nih.gov/geo/ under platforms GPL9697, GPL 9698 and serie GSE19208. Two different labeling procedures have been performed depending on whether the sample was treated or not following the SCOTS proce-dure.
b. cDNA labeling
Five hundred nanograms of total cDNA (from Gardel strain passage 39 at 24 and 96 hpi) from SCOTS proce-dure were randomly amplified and fluorescently labeled with the BioPrime array CGH Genomic labeling System kit (Invitrogen), by the incorporation of Cy3-dCTP (Amersham Biosciences) and then purified on a MinElute cleanup column (Qiagen). Before hybridization, quantifi-cation of Cy3-dCTP incorporation was performed by absorbance measurement at 550 nm. The yield of cDNA labeling and the specific activity always exceeded to 1.65 μg and 9 pmol of Cy3 per cDNA, respectively, according to the manufacturer's recommendations.
c. In vitro transcription (IVT)
Total RNA was extracted as described above from Gardel strain samples passage 47, at 24 and 96 hpi. Eukaryotic ribosomal RNA was removed from the mixture by using the RiboMinus Transcriptome isolation kit (Invitrogen), according to the manufacturer's protocol. The amount and quality of purified RNA were monitored at various points throughout the purification process.
Three hundred nanograms of RiboMinus RNA fraction (Total RNA without eukaryotic rRNA) were then ampli-fied and labeled using the Quick Amp Labeling kit of Agi-lent. The method consists of converting mRNA primed with a random primer containing a T7 promoter into dou-ble strand cDNA with MMLV-RT and then amplifying samples using a T7 RNA polymerase, which generates Cy3-labeled complementary (anti-sense) RNA (cRNA).
d. Microarrays hybridization
Cy3-labeled cRNAs and cDNAs obtained with both meth-ods were used for hybridizations with Agilent Gene Expression Hybridization Kit (Agilent Technologies). Arrays were incubated at 65°C for 20 h in the hybridiza-tion chamber. After hybridizahybridiza-tion, arrays were washed according to the Agilent protocol. Genomic DNAs of ER Welgevonden and Gardel strains were labeled using Bio-Prime array CGH (Invitrogen) and then hybridized as positive control. cDNA samples (SCOTS 0×, 1×, 2×, 3×) from Gardel strain passage 39 and samples generated by IVT from Gardel strain passage 47 at 24 hpi and 96 hpi were hybridized on ER microarrays.
e. Microarrays analysis
Arrays were scanned and images were saved in TIFF for-mat. The signal intensities of all spots on each image were quantified by Genepix pro 6.0 software (Molecular Devices Corporation, Downingtown, PA), and data were saved as ".txt" files for further analysis.
Data were log-transformed, mean-centered and reduced for an equal standard deviation between each slide using the GeneANOVA software [33]. The median value for each gene was calculated and correlation coefficients (R2) between the several conditions were calculated. Genes were considered detected when their intensity of fluores-cence was superior or equal to 3 fold the mean of back-ground intensity.
ER Southern blots
Southern blots were carried out as described previously using the hybridization conditions explained by [34]. cDNAs produced at different times of infection (before SCOTS and after selective captures with 1×, 2× and 3× rounds of SCOTS) with rDNA16S and 23+5S were ampli-fied by PCR digoxigenin (DIG)-labeling mix (Roche diag-nostics, Meylan, France) according to manufacturer's instructions. Nylon membranes containing ER gDNA digested by HindIII were pre-hybridized at 50°C for 2 h in hybridization buffer [SSPE 6× (1× SSPE is 0.18 M NaCl,
10 mM NaH2PO4, and 1 mM EDTA {pH 7.7})], 0.5%
sodium dodecyl sulfate [SDS], 2% (w/v) blocking reagent (Roche diagnostics). Probes were added to the hybridiza-tion buffer and incubated with the membranes for 16 h at 50°C. Blots were then washed twice in buffer containing 2× SSPE, 0.1% SDS (w/v). Colorimetric detection was per-formed with anti-DIG antibody conjugated to alkaline phosphatase (Roche) and BCIP/NBT Buffered Substrate (Sigma Aldrich, France).
Real-time quantitative RT-PCR targeting ribosomal 16S genes
In order to evaluate the contaminant of ER rRNA16S tran-scripts in cDNA samples produced before and after SCOTS, qRT-PCR targeting ER 16S gene was performed on
each sample of Gardel strain passage 39. Sybergreen fluo-rescent master mix reagent (Applied Biosystem) was used for qRT-PCR. Primers 16S-F1 and 16S-R1 used were described in table 1 and the size of the amplicon was 121 pb. qRT-PCR was performed systematically on cDNA before and after each round of SCOTS (1×, 2×, 3×), using the following program: initial denaturation of 10 min at 95°C, followed by 35 cycles of denaturation at 95°C for 30 s, hybridization step at 60°C for 30 s and extension at 72°C for 60 s. In order to quantify the number of copies per sample, a standard curve was established using gDNA of Gardel strain passage 27 serially diluted (from 2.9 × 10⁵ copies to 2.9 × 101). Each sample was analyzed in dupli-cate.
ER gene detection by RT-PCR and qRT-PCR in cDNA
samples after selective capture
The presence of 5 genes in cDNA samples and their enrichment by SCOTS method were evaluated using RT-PCR and qRT-RT-PCR amplifying small fragments of target genes (~120-300 pb) (table 1) that are recA, ffh, rpoD, map1 and pCS20 [18]. map1 gene of ER encodes an outer membrane protein (major antigenic protein) [35,36]. ER specific gene pCS20 is highly conserved and used as target for molecular ER detection [24]. rpoD gene encoding a polymerase sigma factor [37], ffh gene encoding a signal recognition particle protein and recA gene (recombinase A) [38] are three housekeeping genes involved in ER metabolism. The same primers and PCR conditions were used for RT and qRT-PCR.
For ER gene detection by RT-PCR, cDNA samples were diluted in order to assess optimal cDNA concentrations and then to observe the gradual increase of cDNA detec-tion after the different rounds of SCOTS (from 1× to 3×). The dilution of cDNA samples depended on the time of infection: 103 fold for 24 hpi, 104 fold for 72 hpi, 105 for 96 and 120 hpi. These dilutions were used for all the target genes except pCS20. For pCS20, samples were not diluted for 24 hpi, and diluted 10, 103 and 102 fold for 72, 96 and 120 hpi. RT-PCR was performed systematically on cDNA before and after each round of SCOTS (1×, 2×, 3×) using the following program: initial denaturation of 3 min at 94°C followed by 40 cycles of denaturation at 94°C for 50 s, hybridization step at 60°C for 50 s and extension at 72°C for 50 s and a final extension of 7 min at 72°C. DNA of Gardel strain passage 18 was used as a positive control. PCR products were visualized by ethidium-bromide-stained revelation in agarose gels. qRT-PCRs targeting map1, ffh and recA, were performed on the ABI Prism 7000 (Applied Biosystems) in a total reaction volume of 25 μl. This reaction contained 2 μl of undiluted cDNA template (from the initial cDNA reverse transcribed (0.5 μg/μl) before capture and after SCOTS 3×). In order to quantify the number of copies per sample, a standard curve was made with the gDNA of ER (from 2.9 × 10⁵ to 2.9 × 101
copies) as a template. Each sample was done in duplicate. A dissociation curve was produced in order to verify the presence of a single amplicon.
Results
Enrichment of bacterial cDNA after SCOTS
ER cDNAs were produced after 1×, 2×, and 3× SCOTS cap-tures for each time point of infection. A PCR using KpnI primer was performed on cDNAs after each capture. Fig-ure 1 shows amplicons obtained after KpnI PCR on Gardel strain passage 39, at 96 hpi and 120 hpi. The signal detected after capture confirmed the efficiency of the selective capture by high affinity hybridization of cDNA to gDNA. Moreover, we showed a progressive diminution of the size of the amplified transcribed sequences following successive captures. Similar results were obtained for other post infection time points (data not shown). These results indicated that same capture phenomena were observed independently from the time of infection. Southern blots were done on cDNAs before and after each capture for each time point of infection. Southern blots obtained using cDNA at 96 hpi as probes on HindIII-digested ER gDNA are shown in figure 2. DIG-rDNA 23S+5S and 16S were used to reveal the bands sponding to ER rDNA (lane 1). Five distinct bands corre-sponding to rDNA were observed both before capture and after the first capture (figure 2). After successive capture, the results showed a significant increase of the colorimet-ric signal that traduces a larger recognition of ER genes by DIG-cDNA at 96 hpi. These results demonstrated a pro-gressive increase of bacterial cDNA complexity and amount following the successive rounds of captures. For other time points of infection, southern blots were done systematically and similar results were observed with a diminution of the ribosomal cDNA and an increase of the diversity of ER transcripts after the third capture (data not shown).
NKpnI PCR amplicons of cDNAs of Gardel strain passage 39 after SCOTS
Figure 1
NKpnI PCR amplicons of cDNAs of Gardel strain passage 39 after SCOTS. 0×, 1×, 2× and 3×: cDNA
amplicons of NKpnI PCR after 0, 1, 2 or 3 rounds of capture. C+: positive control cDNA with NKpnI tag. C-: Negative control (Water). MW: Molecular weight 100 pb DNA ladder. hpi: hours post infection
MW 0x 1x 2x 3x 0x 1x 2x 3x c+
The diminution of the amplicon sizes after KpnI PCR and results of Southern blot validates the enrichment of ER cDNA and diminution of ribosomal cDNA and eukaryotic contaminant.
Quantification of ribosomal RNA 16S contaminant after SCOTS by qRT-PCR
The quantification of cDNA corresponding to 16S cDNA contaminant was carried out before and after each round of SCOTS at the different time post infection by qRT-PCR (figure 3). Before capture, the amount of 16S cDNA con-taminant varied depending on time points post infection and on the amount of bacteria. At 24 hpi, there was a few 16S cDNA contaminant (89 copies per sample). The range of contamination was between 4 × 10³ to 18.2 × 10³ cop-ies for other time points post infection. We observed a decrease of 46%, 92% and 99% in ribosomal content after the third capture at 72, 96 and 120 hpi, with a final number of copies of 5.6 × 10³, 1.4 × 10³ and 43 copies (figure 3). The main decrease was observed after the first capture. For 24 hpi, the initial number of 16S cDNA cop-ies was already low (<90) and remained low after different captures.
Detection of different ER transcribed sequences by RT-PCR and qRT-RT-PCR before and after capture
Amplicons corresponding to RT-PCR targeting map1, recA, rpoD, ffh and pCS20 at different time points and following successive captures were shown in table 2. Before capture,
the cDNAs of these genes were not detected. For map1 transcripts, one capture was sufficient to obtain a map1 amplicon at any time post infection. There was a signifi-cant and progressive increase of the amplification inten-sity after the second and third rounds, which demonstrated the enrichment of map1 transcripts (table 2). Depending on the gene and time point post infection considered, a positive signal was detected after the first (i.e. ffh at 24 hpi and recA, ffh at 72 hpi), second (i.e. recA, ffh at 96 hpi and ffh at 120 hpi) or third capture (i.e. recA at 24 hpi and 120 hpi). The increase of signal intensity was observed for all genes at any time point post infection after successive captures, except for pCS20 at 24 and 72 hpi. At 24 hpi, undiluted samples were used to detect pCS20 transcripts and there was no signal before capture. At 120 hpi, pCS20 amplification samples were diluted only at 10-2 to observe enrichment, compared to the 10-5 dilution used for the other genes. Globally, 3 rounds of capture were necessary to efficiently enrich the genes poorly expressed.
The qRT-PCR targeting map1, recA and rpoD transcripts before and after 3 rounds of capture allowed to quantify the enrichment due to SCOTS method. Results expressed as the number of transcripts for each gene obtained by qRT-PCR are presented in figure 4. Before capture, the number of transcripts was different depending on the tar-get gene. For example, at 24 hpi there were 1.58 × 10³ cop-ies of map1 transcripts and only 70 and 10 copcop-ies of recA and rpoD. For all time points post infection, map1 was highly expressed compared to the 2 other genes (from 1 to 3 log10 higher than recA and rpoD) (figure 4).
After 3 captures at 24 hpi, there was enrichment around 1000 fold of the amount of recA transcripts (from 70 to 66 × 103copies). For map1 transcripts, the number of copies increased from 1.58 × 10³ to 1 × 10⁸ copies after capture. Even when there was a single transcript per sample, for
Southern blot using DIG labeling cDNAs of Gardel strain at 96 hpi
Figure 2
Southern blot using DIG labeling cDNAs of Gardel strain at 96 hpi. 0×, 1×, 2× and 3×: Southern blots showing
cDNAs of Gardel strain passage 39 before and after one, two and three rounds of SCOTS. rRNA: Southern blot using DIG-rDNA 23S+5S and 16S.
0x 1x 2x 3x
rR
N
A
Quantitative RT-PCR targeting ER rRNA 16S on cDNAs of Gardel strain after SCOTS at different time point post infec-tion: 24, 72, 96 and 120 hours post infection
Figure 3
Quantitative RT-PCR targeting ER rRNA 16S on cDNAs of Gardel strain after SCOTS at different time point post infection: 24, 72, 96 and 120 hours post infection. 0 1 2 3 0 5000 10000 15000 20000 24h 72h 96h 120h Rounds of SCOTS C opy num b e r of r R N A 1 6 S ge ne s
rpoD at 24 and 48 hpi and recA at 48 hpi, there was 11 × 103, 14 × 103 copies and 15.4 × 10³ copies after SCOTS. Before capture, there was an approximate 2 to 3 log10 dif-ference of expression between map1 and recA or rpoD, whereas an approximate 1 log10 difference was measured after capture. The difference of expression between map1 and recA or rpoD was still observed after capture, whatever the culture time considered.
Validation of selective captures using ER Microarrays To validate ER selective captures, whole genome microar-rays of ER were used. Firstly, ER probes specificity was assessed by hybridizations with gDNA of Gardel and Wel-gevonden strains. Of the 1800 probes represented on our microarrays, 99.2 (1758/1772) and 99.1% (1757/1772) of probes were detected for Gardel and Welgevonden strains gDNA respectively (figure 5a). There was no detec-tion of bovine probes corresponding to contaminants. When comparing gDNA hybridizations obtained for 5 replicates per probe on two microarrays slides, there was a high correlation coefficient (R2 = 0.97).
Using ER microarrays, two methods for generating ER transcripts probes were evaluated: direct IVT from "RiboMinus" RNA fraction and cDNA classical random priming for SCOTS samples (figure 5). The percentages of genes detected using samples generated by these methods are presented in figure 5b. Before any treatment (SCOTS 0×), only a small fraction of transcripts could be detected (from 0.05 to 10.4%) for samples collected at 24 and 96 hpi. For early time post infection, there were only 19 genes (1%) detected by microarrays using the IVT method on "RiboMinus" RNA fraction, whereas 3 rounds of SCOTS allowed the detection of 24% of transcripts (figure 5b). Even at 96 hpi, the percentage of transcripts detected was low using the IVT method. SCOTS method allowed the detection of 7 and 3.5 fold more gene transcripts com-pared to untreated and RiboMinus samples. Thus, these results confirmed the efficiency of SCOTS method for transcriptomic analysis.
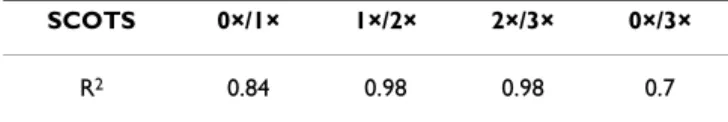
To evaluate a potential bias of the SCOTS method for dif-ferential gene expression analysis, we calculated the coef-ficients of correlation between successive captures on Gardel strain cDNAs at 96 hpi (table 3). The coefficients of correlation between each round of capture were 0.84, 0.98 and 0.98 respectively (table 3). The comparison of an untreated and a three SCOTS capture sample (R2 = 0.7) indicated that SCOTS-mediated amplification was roughly linear.
Table 2: Detection of ER specific genes by RT-PCR on total cDNA before and after SCOTS
Gene 24 hpi 72 hpi 96 hpi 120 hpi
0× 1× 2× 3× 0× 1× 2× 3× 0× 1× 2× 3× 0× 1× 2× 3× map1 - + ++ +++ - + ++ +++ - + ++ +++ - + ++ +++ recA1 - - - + - + ++ +++ - - ++ +++ - - - +++ rpoD - - + ++ - + ++ +++ - - ++ +++ - - - +++ ffh - + ++ +++ - + ++ +++ - - ++ +++ - - ++ +++ pCS20 - + + + - + + + - + ++ +++ - + ++ +++
-: absence of amplicon after RT-PCR, +: Presence of amplicon after RT-PCR.
The number of (+) corresponded to the intensity of amplification signal. 0×, 1×, 2× and 3× corresponded to results obtained on cDNA before and after one, two and three rounds of capture respectively. hpi: hours post infection
Quantitative RT-PCR of map1, recA and rpoD genes on cDNA samples of Gardel strain before and after 3 rounds of capture. hpi: hours post infection
Figure 4
Quantitative RT-PCR of map1, recA and rpoD genes on cDNA samples of Gardel strain before and after 3 rounds of capture. hpi: hours post infection.
B. After SCOTS
24hpi 48hpi 72hpi 96hpi 120hpi
10-1 100 101 102 103 104 105 106 107 108 109 C opy numbe r of ER T ra n scr ip ts pe r sa m p le A. Before SCOTS
24hpi 48hpi 72hpi 96hpi 120hpi
10-1 100 101 102 103 104 105 106 107 108 109 map1 r ecA r poD C o p y num be r of ER T ra n s c rip ts p e r s a m p le
Discussion
Obligate intracellular pathogens are a challenge for func-tional genomic studies to identify genes involved in bac-terial pathogenesis, especially at different stages of development. Until now, only a few studies have been performed on whole Rickettsiales transcriptomes, thus providing a good illustration of this constraint [39].
Glo-bal proteomic expression studies were preferentially used in order to enhance our knowledge on pathogenesis of obligate intracellular pathogens, such as Ehrlichia, Rickett-sia and Anaplasma [40-44]. Proteomic studies also avoided the inconvenience of working with ribosomal prokaryotic and host cell contaminants.
In our Rickettsiales model, we postulated that pathogenic-ity determinants should be differentially expressed in the virulent strains of ER when compared to the same strain attenuated in vitro [45,46]. However, any future whole transcriptomic analysis of Rickettsiales bacteria will need to use efficient tools to eliminate both host cells contam-inant and prokaryotic ribosomal transcripts.
A method of selection of prokaryotic transcripts, the RiboMinus method, based on the removal of eukaryotic ribosomal RNA, was tested for our model. No or few genes were detected on microarrays at any time post infec-tion when using RiboMinus cRNA samples. The failure of the method could be due to the interference of important amount of eukaryotic transcripts. Another strategy, com-bining removal of eukaryotic contaminants with subse-quent random amplification of prokaryotic cDNA, was used previously for Rickettsia conorii and gave convincing results for microarrays analysis [39,47]. However, SCOTS method for microarrays analysis uses small amounts of initial cDNA (3 μg of total RNA) compared to this selec-tive method (50 μg for MicrobENRICH) [47]. Thus, using SCOTS method, there was no limitation to produce bio-logical samples and several different conditions (strains and time-points post infection) could be studied. The innovative method of SCOTS, which has been used previously for non obligatory intracellular parasites [6], was adapted to our ER model to obtain adequate samples for further whole-genome transcripts profile analysis. The size diminution of ER cDNAs following successive captures illustrates a mechanism of generation of small cDNAs due to the nature of the Taq polymerase. Moreo-ver, it shows the capture of smaller transcribed sequences (around 400 to 200 bp) after each successive round of SCOTS. This phenomenon was observed previously by Graham and Clark-Curtiss for Mycobacterium tuberculosis [4]. In their study, they showed that although there were potential biases in representing total mRNA of Mycobacte-rium due to SCOTS method (normalization and enrich-ment of cDNAs), the use of random priming to create cDNA provided a variety of different transcripts, thereby decreasing potential losses during amplification, normal-ization and enrichment. A progressive enrichment of ER cDNA between the first and the third capture was observed by Southern blotting as observed with Mycobac-terium tuberculosis [4].
Detection of probes using Gardel strain cDNAs generated after Ribominus (RM) and SCOTS treatment
Figure 5
Detection of probes using Gardel strain cDNAs gen-erated after Ribominus (RM) and SCOTS treatment.
A: ER Microarray Hybridization with gDNA of Gardel strain passage 40, with cRNAs from Gardel strain passage 47 using RiboMinus purification (RM), with cDNAs from Gardel strain passage 39 before SCOTS (0×) and after 3 rounds of capture (3×). B: Percentage of ER detected probes at 24 and 96 hpi for cRNAs from Gardel strain passage 47 using RiboMinus purification (RM) with cDNAs from Gardel strain passage 39 before SCOTS (0×) and after 3 rounds of capture (3×).
24hpi 96hpi 0 25 50 75 RM SCOTS 0x SCOTS 3x Nu m b e r o f ER pr obe s (% )
gDNA RM SCOTS 0x SCOTS 3x
96hpi
A
B
Table 3: Correlation coefficient (R2) for gene detection by ER
microarrays between the different rounds of SCOTS at 96 hpi
SCOTS 0×/1× 1×/2× 2×/3× 0×/3×
Interference due to ribosomal contaminants in transcrip-tomic analysis was shown previously in a study compar-ing subtractive hybridization and SCOTS methods for Mycobacterium avium [48]. For initial samples, few signals were observed corresponding to rRNAs. After subtractive hybridization and SCOTS, an increased quantity of mes-senger RNAs was observed. The deficiency of detection before mRNA selection seemed to be due to the high amount of rRNAs. In our model, we also obtained a strong decrease of the quantity of ribosomal contaminant as demonstrated by Southern blots and qRT-PCR targeting 16S gene. In an independent experiment, similar results were observed for attenuated Gardel strain by qRT-PCR (data not shown). Even if there was still detection of 16S transcripts in samples after capture, the level of contami-nation was negligible compared to total ER cDNAs and should not hinder transcriptomic analysis.
The detection of all the 5 tested genes including bacterial housekeeping genes rpoD, ffh and recA by RT-PCR or qRT-PCR suggests that SCOTS method in ER is efficient enough to enhance gene detection. Depending on the gene studied, variable numbers of captures were necessary to detect the specific transcript, illustrating the differential expression of genes in relation to life cycle. Three captures are required in order to detect poorly/lowest expressed genes and used for further transcriptomic analysis. Results of recA and rpoD qRT-PCR demonstrated that SCOTS method allowed the detection of transcripts accounted even when present as a single copy for early time-points post infection. Thus, our results demonstrated the effi-ciency of the SCOTS method for further expression analy-sis of an intracellular pathogen at early time-points post infection where the amount of eukaryotic contaminants was high. Beside this study, we report that map1 gene was strongly expressed as demonstrated both by RT-PCR and qRT-PCR. In parallel, we showed that pCS20 was the low-est expressed gene independently of the time of infection. For example, there was no detection of pCS20 transcripts after RT-PCR at early time post infection on undiluted samples.
As multiple PCRs were used for SCOTS method, one could suggest that all the transcripts would have the same level after selective capture. In this study, we demon-strated by both RT-PCR and qRT-PCR that the differential levels of expression were still observed after SCOTS. In a previous study, transcriptional analysis of S. enterica sero-var Typhi within the macrophage revealed approximately 300 genes up-regulated at the defined point post infection compared to the supernatant [6].
In order to finalize the validation of SCOTS method for our model, we used ER microarrays. We first hybridized
Gardel and Welgevonden strains gDNA and observed that more than 99% of probes were detected. These microar-rays offered an exciting opportunity to do the genome-wide- analysis of ER gene expression.
As previously shown by RT-PCR and qRT-PCR on a lim-ited number of genes, our microarrays results with sam-ples generated by SCOTS confirmed the efficiency of this method for our model. Thus, SCOTS method seems to be ideal for whole genome expression profiling of ER. This method is crucial for the study of early time-points post infection: 24% of ORFs could be detected whereas less than 1% was detected on untreated cDNA samples. For late time-points post infection, up to 70.7% of ORFs were detected after 3 rounds. Considering all the time points of infection, 80% of the annotated ORFs were detected in our model (data not shown), which is similar to what was previously observed with Salmonella Typhi within the macrophage [6]. Through the use of SCOTS, comparison of gene expression between ER stages of development and between virulent and attenuated strains could be done on the overall CDS. This allows the targeting of genes involved in the invasion of host cells, in metabolism asso-ciated with bacterial growth (cell wall biogenesis, energy production, translation, traduction) and in pathogenesis sensu stricto.
Moreover, microarrays results demonstrated for overall ER genes that there was a good correlation between expression of genes comparing any round of SCOTS at 96 hpi. The lowest coefficient of correlation (R2 = 0.7) was between SCOTS 0× and 3× samples. This was mainly due to the absence of detection of several genes before capture which could be detected after 3 rounds: the percentage of genes detected increased from 10.4 (SCOTS 0) to 70.7% (SCOTS 3). For genes already detected before capture, their level of expression was saturated after capture dimin-ishing the correlation between SCOTS 0× and 3×. For attenuated Gardel, SCOTS 0× and 3× samples (96 hpi) were hybridized on ER microarrays and a higher correla-tion coefficient (R2 = 0.87) was observed (data not shown). This preliminary result on attenuated Gardel strain, confirmed the limited bias due to SCOTS method on the gene expressions. Our microarrays data supported results obtained by qRT-PCR on map1, recA and rpoD (at any time-point post infection). The differential of gene expression diminished but was still detected before and after capture. However, for further transcriptomic analy-sis, we will focus on genes strongly differentially expressed or presence/absence of genes in order to target genes mainly involved in pathogenesis [39,49]. In our model, difference of gene expression will be assessed by hybridi-zation of SCOTS cDNA on total ER microarrays and then validated by qRT-PCR on untreated cDNA.
Conclusions
Our study reported herein demonstrated that SCOTS method has proven to be suitable for microarray-based transcriptome analysis of ER and as such can be poten-tially applicable to other obligate intracellular bacteria. SCOTS method avoids interferences due to host cells and prokaryotic ribosomal contaminants. Moreover, it allows the enhancement of specific transcripts and induced a limited bias in their relative amount. Thus, SCOTS method will offer the opportunity to study molecular mechanisms that take place in early stages of ER infection and to identify genes involved in the pathogenesis of this obligate intracellular bacterium.
Authors' contributions
Conceived and designed the experiments: LE, FD, DFM, BM, RF, AV, PB, DM, TL, NV. Performed the experiments: LE, VP, CS, VM, NV. Analyzed the data: LE, DFM, BM, NV. Contributed reagents/materials/analysis tools: LE, FD, BM, AV. Wrote the paper: LE, FD, DFM, TL, NV. All authors read and approved the final manuscript.
Acknowledgements
This work was supported by EPIGENEVAC project under contract number [INCO-CT-2005-003713] financed by the European Union, by "Institut National en Recherche Agronomique" and "Centre de Coopération Inter-national en Recherche Agronomique pour le Développement" financial fund and by Franco-Canadian fund: "Fonds France-Canada pour la Recher-che".
We thank Dr Rupert Pegram for his helpful comments.
References
1. Belland RJ, Zhong G, Crane DD, Hogan D, Sturdevant D, Sharma J, Beatty WL, Caldwell HD: Genomic transcriptional profiling of
the developmental cycle of Chlamydia trachomatis. Proc Natl
Acad Sci USA 2003, 100(14):8478-8483.
2. Hinton JC, Hautefort I, Eriksson S, Thompson A, Rhen M: Benefits
and pitfalls of using microarrays to monitor bacterial gene expression during infection. Curr Opin Microbiol 2004, 7(3):277-282.
3. Alland D, Kramnik I, Weisbrod TR, Otsubo L, Cerny R, Miller LP, Jacobs WR Jr, Bloom BR: Identification of differentially
expressed mRNA in prokaryotic organisms by customized amplification libraries (DECAL): the effect of isoniazid on gene expression in Mycobacterium tuberculosis. Proc Natl
Acad Sci USA 1998, 95(22):13227-13232.
4. Graham JE, Clark-Curtiss JE: Identification of Mycobacterium
tuberculosis RNAs synthesized in response to phagocytosis by human macrophages by selective capture of transcribed sequences (SCOTS). Proc Natl Acad Sci USA 1999, 96(20):11554-11559.
5. Daigle F, Graham JE, Curtiss R: Identification of Salmonella typhi
genes expressed within macrophages by selective capture of transcribed sequences (SCOTS). Mol Microbiol 2001, 41(5):1211-1222.
6. Faucher SP, Porwollik S, Dozois CM, McClelland M, Daigle F:
Tran-scriptome of Salmonella enterica serovar Typhi within mac-rophages revealed through the selective capture of transcribed sequences. Proc Natl Acad Sci USA 2006, 103(6):1906-1911.
7. Baltes N, Buettner FF, Gerlach GF: Selective capture of
tran-scribed sequences (SCOTS) of Actinobacillus pleuropneu-moniae in the chronic stage of disease reveals an
HlyX-regulated autotransporter protein. Vet Microbiol 2007, 123(1-3):110-121.
8. Baltes N, Gerlach GF: Identification of genes transcribed by
Actinobacillus pleuropneumoniae in necrotic porcine lung tissue by using selective capture of transcribed sequences.
Infect Immun 2004, 72(11):6711-6716.
9. Provost A, Bezuidenhout JD: The historical background and
glo-bal importance of heartwater. Onderstepoort J Vet Res 1987, 54(3):165-169.
10. Barré N, Uilenberg G, Morel PC, Camus E: Danger of introducing
heartwater onto the American mainland: potential role of indigenous and exotic Amblyomma ticks. Onderstepoort J Vet
Res 1987, 54(3):405-417.
11. Uilenberg G: Experimental transmission of Cowdria
ruminan-tium by the Gulf coast tick Amblyomma maculatum: danger of introducing heartwater and benign African theileriasis onto the American mainland. Am J Vet Res 1982, 43(7):1279-1282.
12. Jongejan F, Wassink LA: Lack of cross-protection between
Cow-dria ruminantium and Ehrlichia phagocytophila. Rev Elev Med
Vet Pays Trop 1991, 44(4):425-428.
13. Mahan SM, Allsopp B, Kocan KM, Palmer GH, Jongejan F: Vaccine
strategies for Cowdria ruminantium infections and their application to other ehrlichial infections. Parasitol Today 1999, 15(7):290-294.
14. Reddy GR, Sulsona CR, Harrison RH, Mahan SM, Burridge MJ, Barbet AF: Sequence heterogeneity of the major antigenic protein 1
genes from Cowdria ruminantium isolates from different geographical areas. Clin Diagn Lab Immunol 1996, 3(4):417-422.
15. Zweygarth E, Josemans AI, Van Strijp MF, Lopez-Rebollar L, Van Kleef M, Allsopp BA: An attenuated Ehrlichia ruminantium
(Wel-gevonden stock) vaccine protects small ruminants against virulent heartwater challenge. Vaccine 2005, 23(14):1695-1702.
16. Jongejan F, Zandbergen TA, Wiel PA van de, de Groot M, Uilenberg G: The tick-borne rickettsia Cowdria ruminantium has a
Chlamydia-like developmental cycle. Onderstepoort J Vet Res
1991, 58(4):227-237.
17. Frutos R, Viari A, Ferraz C, Bensaid A, Morgat A, Boyer F, Coissac E, Vachiery N, Demaille J, Martinez D: Comparative genomics of
three strains of Ehrlichia ruminantium: a review. Ann N Y Acad
Sci 2006, 1081:417-433.
18. Frutos R, Viari A, Ferraz C, Morgat A, Eychenie S, Kandassamy Y, Chantal I, Bensaid A, Coissac E, Vachiery N, Demaille J, Martinez D:
Comparative genomic analysis of three strains of Ehrlichia ruminantium reveals an active process of genome size plas-ticity. J Bacteriol 2006, 188(7):2533-2542.
19. Frutos R, Viari A, Vachiery N, Boyer F, Martinez D: Ehrlichia
rumi-nantium: genomic and evolutionary features. Trends Parasitol
2007, 23(9):414-419.
20. Uilenberg G, Camus E, Barre N: [A strain of Cowdria
ruminan-tium isolated in Guadeloupe (French West Indies)]. Rev Elev
Med Vet Pays Trop 1985, 38(1):34-42.
21. Bezuidenhout JD, Paterson CL, Barnard BJ: In vitro cultivation of
Cowdria ruminantium. Onderstepoort J Vet Res 1985, 52(2):113-120.
22. Martinez D, Swinkels J, Camus E, Jongejan F: [Comparison
between 3 antigens for the serodiagnosis of heartwater dis-ease by indirect immunofluorescence]. Rev Elev Med Vet Pays
Trop 1990, 43(2):159-166.
23. Vachiery N, Lefrancois T, Esteves I, Molia S, Sheikboudou C, Kandas-samy Y, Martinez D: Optimisation of the inactivated vaccine
dose against heartwater and in vitro quantification of Ehrli-chia ruminantium challenge material. Vaccine 2006, 24(22):4747-4756.
24. Martinez D, Vachiery N, Stachurski F, Kandassamy Y, Raliniaina M, Aprelon R, Gueye A: Nested PCR for detection and genotyping
of Ehrlichia ruminantium: use in genetic diversity analysis.
Ann N Y Acad Sci 2004, 1026:106-113.
25. Martinez D, Maillard JC, Coisne S, Sheikboudou C, Bensaid A:
Pro-tection of goats against heartwater acquired by immunisa-tion with inactivated elementary bodies of Cowdria ruminantium. Vet Immunol Immunopathol 1994, 41(1-2):153-163.
26. Perez JM, Martinez D, Debus A, Sheikboudou C, Bensaid A:
Devel-opment of an in vitro cloning method for Cowdria ruminan-tium. Clin Diagn Lab Immunol 1997, 4(5):620-623.
Publish with BioMed Central and every scientist can read your work free of charge "BioMed Central will be the most significant development for disseminating the results of biomedical researc h in our lifetime."
Sir Paul Nurse, Cancer Research UK
Your research papers will be:
available free of charge to the entire biomedical community peer reviewed and published immediately upon acceptance cited in PubMed and archived on PubMed Central yours — you keep the copyright
Submit your manuscript here:
http://www.biomedcentral.com/info/publishing_adv.asp
BioMedcentral 27. Froussard P: A random-PCR method (rPCR) to construct
whole cDNA library from low amounts of RNA. Nucleic Acids
Res 1992, 20(11):2900.
28. Daigle F, Hou JY, Clark-Curtiss JE: Microbial gene expression
elu-cidated by selective capture of transcribed sequences (SCOTS). Methods Enzymol 2002, 358:108-122.
29. Hahn WE, Pettijohn DE, Van Ness J: One strand equivalent of the
Escherichia coli genome is transcribed: complexity and abundance classes of mRNA. Science 1977, 197(4303):582-585.
30. Ko MS, Ko SB, Takahashi N, Nishiguchi K, Abe K: Unbiased
ampli-fication of a highly complex mixture of DNA fragments by
'lone linker'-tagged PCR. Nucleic Acids Res 1990,
18(14):4293-4294.
31. Rouillard JM, Zuker M, Gulari E: OligoArray 2.0: design of
oligo-nucleotide probes for DNA microarrays using a thermody-namic approach. Nucleic Acids Res 2003, 31(12):3057-3062.
32. Hubbard TJ, Aken BL, Ayling S, Ballester B, Beal K, Bragin E, Brent S, Chen Y, Clapham P, Clarke L, Coates G, Fairley S, Fitzgerald S, Fern-andez-Banet J, Gordon L, Graf S, Haider S, Hammond M, Holland R, Howe K, Jenkinson A, Johnson N, Kahari A, Keefe D, Keenan S, Kin-sella R, Kokocinski F, Kulesha E, Lawson D, Longden I, Megy K, Meidl P, Overduin B, Parker A, Pritchard B, Rios D, Schuster M, Slater G, Smedley D, Spooner W, Spudich G, Trevanion S, Vilella A, Vogel J, White S, Wilder S, Zadissa A, Birney E, Cunningham F, Curwen V, Durbin R, Fernandez-Suarez XM, Herrero J, Kasprzyk A, Proctor G, Smith J, Searle S, Flicek P: Ensembl 2009. Nucleic Acids Res 2009:D690-697.
33. Didier G, Brezellec P, Remy E, Henaut A: GeneANOVA--gene
expression analysis of variance. Bioinformatics 2002, 18(3):490-491.
34. Bekker CP, Postigo M, Taoufik A, Bell-Sakyi L, Ferraz C, Martinez D, Jongejan F: Transcription analysis of the major antigenic
pro-tein 1 multigene family of three in vitro-cultured Ehrlichia ruminantium isolates. J Bacteriol 2005, 187(14):4782-4791.
35. Allsopp MT, Dorfling CM, Maillard JC, Bensaid A, Haydon DT, van Heerden H, Allsopp BA: Ehrlichia ruminantium major antigenic
protein gene (map1) variants are not geographically con-strained and show no evidence of having evolved under pos-itive selection pressure. J Clin Microbiol 2001, 39(11):4200-4203.
36. van Vliet AH, Jongejan F, van Kleef M, Zeijst BA van der: Molecular
cloning, sequence analysis, and expression of the gene encoding the immunodominant 32-kilodalton protein of Cowdria ruminantium. Infect Immun 1994, 62(4):1451-1456.
37. Savli H, Karadenizli A, Kolayli F, Gundes S, Ozbek U, Vahaboglu H:
Expression stability of six housekeeping genes: A proposal for resistance gene quantification studies of Pseudomonas aeruginosa by real-time quantitative RT-PCR. J Med Microbiol
2003, 52(Pt 5):403-408.
38. Takle GW, Toth IK, Brurberg MB: Evaluation of reference genes
for real-time RT-PCR expression studies in the plant patho-gen Pectobacterium atrosepticum. BMC Plant Biol 2007, 7:50.
39. Renesto P, Rovery C, Schrenzel J, Leroy Q, Huyghe A, Li W, Lepidi H, Francois P, Raoult D: Rickettsia conorii transcriptional
response within inoculation eschar. PLoS ONE 2008, 3(11):e3681.
40. Ge Y, Rikihisa Y: Identification of novel surface proteins of
Anaplasma phagocytophilum by affinity purification and pro-teomics. J Bacteriol 2007, 189(21):7819-7828.
41. Wang X, Kikuchi T, Rikihisa Y: Proteomic identification of a
novel Anaplasma phagocytophilum DNA binding protein that regulates a putative transcription factor. J Bacteriol 2007, 189(13):4880-4886.
42. Ogawa M, Renesto P, Azza S, Moinier D, Fourquet P, Gorvel JP, Raoult D: Proteome analysis of Rickettsia felis highlights the
expression profile of intracellular bacteria. Proteomics 2007, 7(8):1232-1248.
43. Renesto P, Azza S, Dolla A, Fourquet P, Vestris G, Gorvel JP, Raoult D: Proteome analysis of Rickettsia conorii by
two-dimen-sional gel electrophoresis coupled with mass spectrometry.
FEMS Microbiol Lett 2005, 245(2):231-238.
44. Huang H, Lin M, Wang X, Kikuchi T, Mottaz H, Norbeck A, Rikihisa Y: Proteomic analysis of and immune responses to Ehrlichia
chaffeensis lipoproteins. Infect Immun 2008, 76(8):3405-3414.
45. Jongejan F: Protective immunity to heartwater (Cowdria
ruminantium infection) is acquired after vaccination with in vitro-attenuated rickettsiae. Infect Immun 1991, 59(2):729-731.
46. Martinez D: Analysis of the immune response of ruminants to
Cowdria ruminantium infection. Utrecht: Utrecht University;
1997.
47. La MV, Francois P, Rovery C, Robineau S, Barbry P, Schrenzel J, Raoult D, Renesto P: Development of a method for recovering
rick-ettsial RNA from infected cells to analyze gene expression profiling of obligate intracellular bacteria. J Microbiol Methods
2007, 71(3):292-297.
48. Hou JY, Graham JE, Clark-Curtiss JE: Mycobacterium avium
genes expressed during growth in human macrophages detected by selective capture of transcribed sequences (SCOTS). Infect Immun 2002, 70(7):3714-3726.
49. Faucher SP, Curtiss R, Daigle F: Selective capture of Salmonella
enterica serovar typhi genes expressed in macrophages that are absent from the Salmonella enterica serovar Typhimu-rium genome. Infect Immun 2005, 73(8):5217-5221.