Bandicoot: A python toolbox for mobile phone metadata
The MIT Faculty has made this article openly available.
Please share
how this access benefits you. Your story matters.
Citation
de Montjoye, Yves-Alexandre, Luc Rocher, and Alex Sandy Pentland.
"Bandicoot: a Python Toolbox for Mobile Phone Metadata." Journal
of Machine Learning Research, 17, 2016, pp. 1-5. © 2016
Yves-Alexandre de Montjoye, Luc Rocher, and Alex ‘Sandy’ Pentland
As Published
http://www.jmlr.org/papers/v17/15-593.html
Publisher
JMLR, Inc.
Version
Final published version
Citable link
http://hdl.handle.net/1721.1/115988
Terms of Use
Article is made available in accordance with the publisher's
policy and may be subject to US copyright law. Please refer to the
publisher's site for terms of use.
bandicoot: a Python Toolbox for Mobile Phone Metadata
Yves-Alexandre de Montjoye [email protected]
MIT Media Lab, 02139 Cambridge MA, USA
Imperial College London, Dept. of Computing and Data Science Institute, London SW7 2AZ, UK
Luc Rocher [email protected]
Universit´e catholique de Louvain, ICTEAM, 1348 Louvain-la-Neuve, Belgium
Alex ‘Sandy’ Pentland [email protected]
MIT Media Lab, Cambridge, 02139 Cambridge MA, USA
Editor: Alexandre Gramfort
Abstract
bandicoot is an open-source Python toolbox to extract more than 1442 features from stan-dard mobile phone metadata. bandicoot makes it easy for machine learning researchers and practitioners to load mobile phone data, to analyze and visualize them, and to extract robust features which can be used for various classification and clustering tasks. Emphasis is put on ease of use, consistency, and documentation. bandicoot has no dependencies and is distributed under MIT license.
Keywords: Python, feature engineering, mobile phone metadata, CDR, visualization
1. Introduction
The metadata generated at large-scale by mobile phones and collected by every carrier around the world have the potential to fundamentally transform the way we fight diseases and design transportation systems. Scientists have compared the recent availability of these large-scale behavioral data sets to the invention of the microscope (Giles, 2012) and their business value is considerable (Kaye, 2015). In machine learning, mobile phone metadata have been used to predict people’s gender (Sarraute et al., 2014), age (Sarraute et al., 2014), personality (de Montjoye et al., 2013), literacy rates (Sundsøy, 2016); as well as their likelihood to repay loans (Bjorkegren and Grissen, 2015), subscribe to services (Sundsøy et al., 2014), and commit crimes (Bogomolov et al., 2014). In disaster relief operations for instance, knowing the demographics of a person along with his or her mobility data is extremely valuable (Wilson et al., 2016). As most phones in low and middle income countries are prepaid (ITU, 2013), we often lack these information about the users. Being able to predict million of people’s demographic information with a small training set is therefore tremendously valuable and cost-efficient.
Despite a great potential for impact and close to 10 years of academic and industry research in using mobile phone metadata (Blondel et al., 2015), there were so far no open-source software to process and extract robust features from them. All prediction works were consequently based on a limited number of custom indicators. This has prevented research from progressing: features had to be redeveloped every time and numerous implementation
de Montjoye, Rocher, and Pentland
choices (e.g. reconciling data, choices of thresholds and time periods, edge cases) were lost from one paper to another. This made it hard to replicate results, quantify the impact of new methods, and transfer learnings.
bandicoot solves this problem by providing researchers and practitioners with an efficient open-source Python feature extractor for mobile phone metadata. bandicoot is a complete, easy-to-use and extensible environment: with a few lines of code, a user can load mobile phone data, extract features, and export them. bandicoot’s modular structure makes it easy for users to add new features and leverage existing pre- and post-processing functions. 2. Usage and features
bandicoot provides users with more than 1442 individual, spatial, and social network fea-tures:
Individual features (e.g. percent of nocturnal interactions, time it takes someone to an-swer text message, inter-event time between two phones calls) describe an individual’s phone usage and interactions with his or her contacts.
Spatial features (e.g. entropy of visited antennas, radius of gyration) describe an individ-ual’s mobility patterns. Note that to avoid sampling biases, bandicoot groups location data per 30 min slots.
Social network (e.g. clustering coefficient, assortativity) describe an individual’s social network and compare his or her behavior with the one of their contacts.
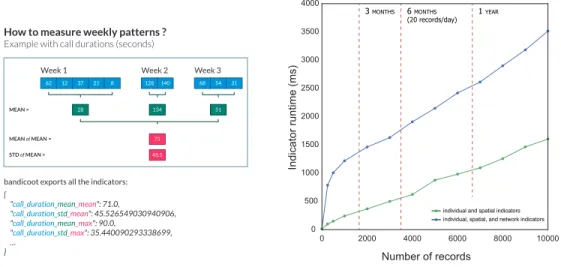
bandicoot computes these indicators or, when they are a distribution their mean and standard deviation, on a weekly basis. It then returns the weekly mean and standard devi-ation to the user (see Fig. 1(a)). The user can also compute indicators only on call/texts, weekdays/weekends, or days/nights and an extended set of weekly summary statistics (me-dian, min, max, kurtosis, and skewness).
bandicoot also standardizes from the mobile phone research literature (Blondel et al., 2015) the definition of conversations between individuals, the conversion of directed to undirected matrices, the assortativity of attributes within ego-networks, as well as a the binning scheme to avoid sampling biases in location data.
3. Project focus
Code quality Correctness and consistency is absolutely crucial for us. The metrics
implemented need to be correct and the values returned stable over time. To ensure this, we implemented functions to generate synthetic mobile phone data, regression tests, and more than 50 function-level unit tests covering 88% of the source code.
Community-driven development The choice of the Python language, as well as a specific focus on readability, helps contributors understand and modify bandicoot. We are actively building a community of users around bandicoot to foster changes and improvements in the source code, develop new features, and to report and help correct faulty behaviors. bandicoot is hosted on GitHub and has already been developed by 9 contributors over
the last three years with many others helping with bug reports, features requests, and discussions.
How to measure weekly patterns ?
Example with call durations (seconds)
bandicoot exports all the indicators: { "call_duration_mean_mean": 71.0, "call_duration_std_mean": 45.526549030940906, "call_duration_mean_max": 90.0, "call_duration_std_max": 35.440090293338699, … } 62 12 37 21 8 Week 1 128 140 Week 2 68 54 31 Week 3 MEAN = 28 134 51 MEAN of MEAN = 71 45.5 STD of MEAN = 3 MONTHS 6 MONTHS (20 records/day) 1 YEAR
individual, spatial, and network indicators individual and spatial indicators
Figure 1: (a) Weekly aggregation of bandicoot’s behavioral indicators. (b) bandicoot’s run-time as a function of the number of records (single core) with and without network indicators
Documentation An extensive documentation has been written and is maintained. This includes an exhaustive description of the input and output of functions, a quick start guide, and a demonstration notebook. A specific part of the documentation is written to help users test and contribute new features.
Easy-to-install and without dependencies bandicoot runs on Python 2 and 3; we support (and test bandicoot with) GNU/Linux, Mac OS, and Windows. bandicoot is meant to (and already is) used in highly secured and heterogeneous telco environments where packages have to be approved and verified. To make its use (incl. in Hadoop environments) and installation easier, we developed bandicoot to be free of any dependencies such as pandas or compilers.
Detecting data issues Numerous data issues can happen in mobile phone data sets: incorrect locations, missing incoming records, duplicates, etc. We have built 38 reporting variables that are automatically added when exporting features. These include details about the underlying data (start and end date, number of records, percentage of antenna missing location information, etc.) and about the data processing (bandicoot version number, type of aggregation used, records that have been removed and why, whether a home location has been detected, etc.).
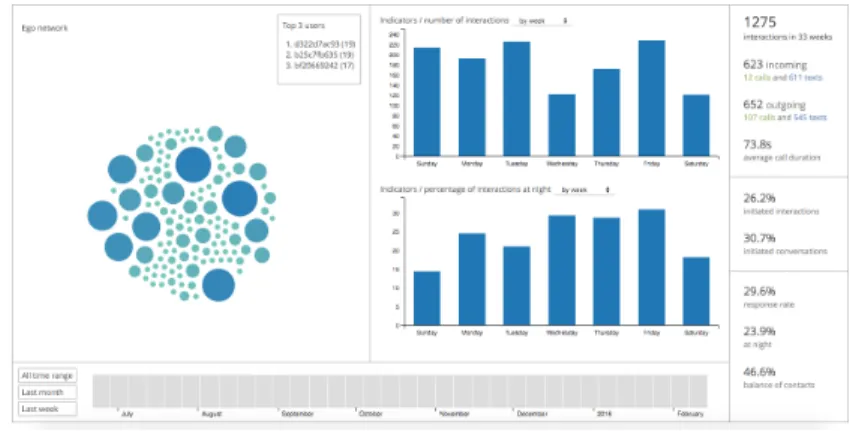
4. Visualization
bandicoot includes an interactive tool to visualize the data of a specific user. The visual-ization allows researchers to inspect the data, detect issues, and spot potentially important patterns. Fig. 2 shows the visualization tool, with options to display only specific weeks
de Montjoye, Rocher, and Pentland
and to plot indicators (or their weekly mean/sum) over the time period considered. It can be generated and served on-the-fly over HTTP, or exported to disk and shared.
Figure 2: bandicoot visualization tool for an individual’s data
5. Performances
While our priority developing bandicoot is to produce correct and verifiable code that can be easily extended, a certain number of implementation choices and optimizations were made to ensure that a standard large-scale dataset can be processed overnight. For instance, bandicoot caches groups of records by week, weekend, call or text to limit both the computing time and the memory footprint. All together these optimizations have sped up computation by a factor 3 compared to a naive implementation.
We tested bandicoot on a computer with an Intel i7 CPU (2.6GHz) and 8GB of memory for users with an average of 20 records per days over 3 months. It takes on average 250ms to compute all 1442 behavioral and mobility indicators using the standard Python interpreter, CPython, and 160ms using pypy, a fast just-in-time compiler. For all indicators, including
network features, the total time is 1.11s using CPython (740ms with pypy). Network
indicators take significantly more time as data for all the neighbors of one node have to be loaded and their behavioral indicators computed. All indicators run in linear time with the number of records (Fig. 1(b)) and a standard large-scale data set of one million mobile phone users is processed in less than 9 hours (resp. 39h for the network indicators) using the multiprocessing code we provide.
6. Conclusion
The application of machine learning algorithms to mobile phone metadata has a great potential for good and businesses. Until now, there were no toolbox to efficiently process and extract robust features from them. This was a major issue for both researchers and practitioners. bandicoot implements a full data pipeline for mobile phone data including more than 1442 features. It has been used in research papers as well as by carriers (e.g. Orange, Telenor) and international organizations (e.g. WFP).
References
Daniel Bjorkegren and Darrell Grissen. Behavior revealed in mobile phone usage predicts loan repayment. Available at SSRN 2611775, 2015.
Vincent D Blondel, Adeline Decuyper, and Gautier Krings. A survey of results on mobile phone datasets analysis. EPJ Data Science, 4(1):1, 2015.
Andrey Bogomolov, Bruno Lepri, Jacopo Staiano, Nuria Oliver, Fabio Pianesi, and Alex Pentland. Once upon a crime: Towards crime prediction from demographics and mobile data. In Proceedings of the 16th International Conference on Multimodal Interaction, pages 427–434. ACM, 2014.
Yves-Alexandre de Montjoye, Jordi Quoidbach, Florent Robic, and Alex Sandy Pentland. Predicting personality using novel mobile phone-based metrics. In Social Computing, Behavioral-Cultural Modeling and Prediction, pages 48–55. Springer, 2013.
Jim Giles. Making the links. Nature, 488(7412):448–450, 2012.
International Telecommunication Union. Itu releases latest global technology
devel-opment figures. http://www.itu.int/net/pressoffice/press_releases/2013/05.
aspx, 2013. Accessed: 2015-10-17.
Kate Kaye. The $24 Billion Data Business That Telcos Don’t Want to
Talk About, 2015. URL http://adage.com/article/datadriven-marketing/
24-billion-data-business-telcos-discuss/301058.
Carlos Sarraute, Pablo Blanc, and Javier Burroni. A study of age and gender seen through mobile phone usage patterns in mexico. In Advances in Social Networks Analysis and Mining, 2014 IEEE/ACM International Conference on, pages 836–843. IEEE, 2014.
P˚al Sundsøy. Can mobile usage predict illiteracy in a developing country? arXiv preprint
arXiv:1607.01337, 2016.
P˚al Sundsøy, Johannes Bjelland, Asif M Iqbal, Yves-Alexandre de Montjoye, et al. Big
data-driven marketing: How machine learning outperforms marketers’ gut-feeling. In Social Computing, Behavioral-Cultural Modeling and Prediction, pages 367–374. Springer, 2014. Robin Wilson, Elisabeth zu Erbach-Schoenberg, Maximilian Albert, Daniel Power, Si-mon Tudge, Miguel Gonzalez, Sam Guthrie, Heather Chamberlain, Christopher Brooks, Christopher Hughes, et al. Rapid and near real-time assessments of population displace-ment using mobile phone data following disasters: the 2015 nepal earthquake. PLoS currents, 8, 2016.