RETINAL DISORDERS
Macular pigment density at the site of altered fundus
autofluorescence
Simon Paul Rothenbuehler&
Ute E. K. Wolf-Schnurrbusch&Sebastian Wolf
Received: 10 July 2010 / Revised: 10 September 2010 / Accepted: 13 September 2010 / Published online: 28 September 2010 # Springer-Verlag 2010
Abstract
Background The purpose of our study was to determine whether abnormalities of increased or decreased fundus autofluorescence (FAF) are associated with local changes in macular pigment (MP) optical density in patients with age-related maculopathy (ARM) and macular degeneration (ARMD).
Methods FAF imaging and MP measurement was per-formed through dilated pupils using a modified confocal scanning laser ophthalmoscope (HRA, Heidelberg Engi-neering, Germany) according to a standard protocol. Two-wavelength autofluorescence method was employed for determination of local macular pigment optical density (LMPOD). Image analysis and measurement of LMPOD at the area of altered FAF was performed using Heidelberg Eye Explorer Software. Mean values of LMPOD at the site of FAF abnormality were compared to an adjacent location with normal background FAF of the same image. Results Sixty-three eyes of 63 patients (28 male, 35 female, mean age 75.8±8.8 years) were included in this analysis. Group 1 comprised 31 cases with focal increased FAF. Mean LMPOD in the area of increased FAF was 0.073± 0.083 compared to 0.075±0.074 in the adjacent area of normal FAF. Group 2 comprised 32 cases of focal
decreased FAF. Mean LMPOD in the area of decreased FAF was –0.004±0.088 compared 0.053±0.075 in the adjacent area of normal FAF. The site of increased FAF showed no significant difference in LMPOD (p=0.927) compared to adjacent areas of normal FAF, while areas of decreased FAF revealed significantly lower LMPOD (p=0.001) compared to adjacent areas of normal FAF. Conclusions Focal increases of FAF due to ARM or ARMD did not lead to change in LMPOD. Presumably, retinal layers containing MP are unaffected by these processes. For lesions exhibiting focal decreased FAF, a reduction of LMPOD cannot be excluded. Further studies are needed to investigate MP in the course of disease. Keywords Macular pigment . Fundus autofluorescence . Age-related macular degeneration . Age-related
maculopathy
Introduction
The human and economic impact of age-related macular degeneration (ARMD) in Western societies is enormous [1–3]. While current research efforts aim at therapeutic approaches and preventive measures, the underlying mo-lecular mechanisms of pathogenesis remain poorly under-stood. The retinal pigment epithelium (RPE) and its dysfunction seem to play a key role in the development and throughout the course of the disease [4, 5]. With the advent of confocal scanning laser ophthalmoscopy, in vivo imaging of fundus autofluorescence (FAF) became avail-able [6,7]. Since retina autofluorescence is mainly derived from lipofuscin fluorophores [8,9], this method is a valid tool for retinal evaluation, providing additional information on RPE viability and function. Earlier studies described
Grant support SNF 3200 Bo-109962/1and Velux 303 S. P. Rothenbuehler
Bern Photographic Reading Center, Universitätsklinik für Augenheilkunde, Bern, Switzerland
U. E. K. Wolf-Schnurrbusch
:
S. Wolf (*) Universitätsklinik für Augenheilkunde, Inselspital, University Hospital Bern,CH-3010 Bern, Switzerland e-mail: [email protected] DOI 10.1007/s00417-010-1528-1
FAF changes in early age-related maculopathy (ARM) and in atrophic ARMD [7, 10]. By classification of distinct patterns of altered FAF, prognostic information on disease course and progression can be identified [11,12].
In relation to age-related macular disease, the macular pigment (MP) was in the focus of research interest and continually investigated over the last decade [13–17]. Its putative protective role is based on a unique combination of its chemical, physical, and anatomical properties. The three carotenoids lutein (L), zeaxanthin (Z), and meso-zeaxanthin are the main constituents of MP. With the highest density of MP in the fovea, its concentration decreases sharply within the first degrees of eccentricity. However, at low levels, L and Z are present throughout the periphery of the retina. The cumulated amount of L and Z of the periphery accounts for roughly half of the central accumulation [18,
19]. MP density shows a wide variability of absolute amount and distribution of macular L and Z between individuals and during the course of disease [20].
The autofluorescence method of MP measurement [20,
21] uses two wavelengths for FAF excitation. The short wavelength is highly absorbed by MP, the long wavelength is only marginally attenuated. Thus, by subtracting both FAF intensities, a distribution map of MP can be calculated and used for further analysis.
Measurement of MP by FAF imaging could be influenced by local variation of autofluorescence intensity. Additionally, an area of disturbed RPE (e.g., local abnormal autofluor-escence) could influence the MP density at this site. We therefore investigated local macular pigment optical density (LMPOD) at the location of circumscribed FAF changes.
Methods
Participants of the prospective observational study “The Role of Macular Pigment in Patients With Age-related Macular Degeneration” (ClinicalTrials.gov Identifier: NCT00494325) were recruited for this cross-sectional study. Inclusion criteria were age>50 years, presence of soft or confluent drusen or an area of geographic atrophy, clear optical media, image quality sufficient for analysis, and the presence of localized areas of well-demarcated abnormal FAF. The study eye was chosen by the criteria of FAF image quality (i.e., sharpness of lesion demarcation).
Diagnosis and stage of disease was assessed by biomicroscopy and 30° color fundus photography (FF 450 plus, Carl Zeiss Meditec, Jena, Germany).
The circumscribed lesions of increased and decreased FAF brightness were divided into group 1 and group 2, respectively. In case either FAF abnormalities were found in one eye, the better demarcated and more centrally located was chosen over the other for the group allocation.
Before examination, drops containing 0.5% tropicamide and 2.5% phenylephrine were applied to the study eye for a pupil diameter dilation of 6 mm or greater.
Prior to examination, informed written consent was obtained after explanation of the nature of and possible risks of our study. The research followed the tenets of the Declaration of Helsinki and Institutional Review Board approval was granted.
MP measurements were obtained with a modified confocal scanning laser ophthalmoscope (mpHRA, Heidel-berg Engineering, HeidelHeidel-berg, Germany) [20] using auto-fluorescence images obtained at two excitation-wavelength based on the pioneering work of Delori et al. [21].
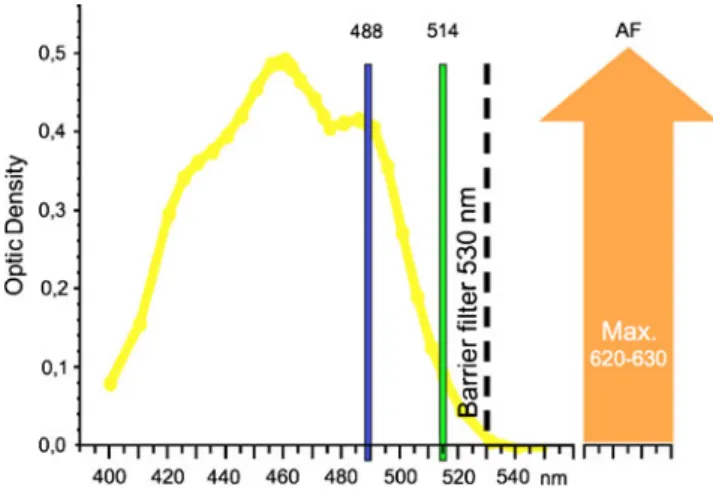
All images for the analysis were acquired through dilated pupils. Subjects were positioned in front of a tabletop and instructed to look straight ahead and to remain steady, and 20° autofluorescence images of the posterior pole at 512 x 512 pixels were obtained at excitation wavelengths of 488 nm and 514 nm. From a sequence of nine single frames, a non-normalized mean image was calculated. A bandpass filter with a short wavelength cut-off at 530 nm was used for the detection of FAF, as shown in Fig.1.
Since the absorbance of MP at 488-nm wavelength is high, and at 514 nm close to zero, excitation laser light was selectively attenuated by the properties of MP as shown in Fig. 1. Thus, based on differential absorption, the single-pass optical density of MP can be calculated from log FAF images at both excitation wavelengths as previously described [22]. For further analysis, a map displaying the MP optical density in a range of gray values from 0 to 255 was used.
FAF images (488-nm excitation wavelength) were analyzed for lesions of focal increased or decreased FAF. Lesions were identified in contrast to the FAF intensity of a visually unaffected area with homogenous signal of
Fig. 1 Absorbance spectrum of macular pigment (yellow) with a maximum absorbance at 460 nm. Excitation wavelengths at 488 nm and 514 nm, barrier filter at 530 nm, imaging by detection of lipofuscin autofluorescence (AF) at 620 to 630-nm wavelengths
background FAF. Areas of altered FAF were marked using the overlay tool of the Heidelberg Eye Explorer Software Version 1.6.2. Concurrently, an unaffected area with homogenous signal of normal background FAF with similar size and eccentricity and adjacent to the alteration was identified and circumnavigated in the same manner. Then, overlays of both areas were transferred to the MP density map (see Fig. 2). Thereafter, the LMPOD was measured using the Heidelberg Eye Explorer software. LMPOD was compared between altered and normal area.
For statistical analysis, GraphPad Prism Software Version 5.02 was used. For analysis of difference in optical density between locations within a group, the Mann–Whitney U test was used. Findings with an error probability of p<0.05 were considered statistically significant.
Results
In total, 63 eyes of 63 subjects were included in this analysis, and 28 subjects were male, and 35 subjects female. Age ranged from 54.0 to 93.7 years with a mean age of 75.8±8.8 years.
ARM was found in 47 eyes, atrophic ARMD was found in 16 eyes. Group 1 comprised 31 cases with focal increase of FAF. Group 2 comprised 32 cases with a focal decrease of FAF.
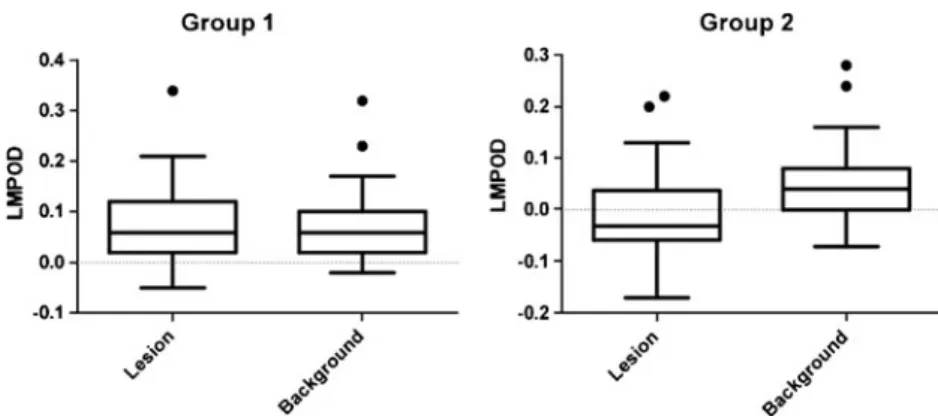
In group 1, the mean LMPOD in the area of increased FAF was 0.073±0.083. Mean LMPOD of the adjacent area of normal FAF was 0.075±0.074 as shown in Fig. 3. No significant difference was found in the comparison of the mean values (p=0.927).
In group 2, the area of decreased FAF exhibited a mean LMPOD of–0.004±0.088. Mean LMPOD of the adjacent area of normal FAF was 0.053±0.075 as shown in Fig.3. Areas of decreased FAF revealed significantly lower optical densities (p=0.001) compared to adjacent areas of normal FAF. The mean size of the FAF lesion was 0.1165 mm2in group 1 and 0.1266 mm2in group 2, showing no significant difference (p=0.847) as shown in Fig. 4. Measurement of the central MP density revealed a mean value of 0.68±0.20 density units (DU) in group 1 and 0.60±0.20 DU in group 2 as shown in Fig. 4. A tendency to lower central MP density in group 2 was found but no statistical significant difference (p=0.103).
Discussion
Alterations in FAF imaging in connection with ARM and ARMD have been investigated in numerous studies so far [6, 11, 12, 23]. In contrast to normal background fluorescence, hyper- and hypofluorescence seem to be focal hallmarks of changes in health and metabolism of RPE and photoreceptor cells. So far, increased FAF intensity in monogenetic and multifactorial disease was primarily attributed to the amount of accumulated RPE lipofuscin [7,8]. As the recent work of Sparrow et al. suggests, other mechanisms might contribute significantly to focal hyper-fluorescence [24]. Factors such as photooxidative modifi-cation of RPE lipofuscin fluorophores or elevated bisretinoid synthetic activity in disabled photoreceptor cells are reported. N-retinylidene-N-reinylethanolamine (A2-E) has been identified as a compound of lipofuscin with toxic properties in terms of detergent effects and inhibition of lysosomal function [25, 26]. Hypofluorescence is mainly attributed to either atrophy of RPE cells or light absorption by melanin pigmentation, hemorrhage, or intraretinal exudates. Changes of FAF have a broad spectrum of appearances. Mainly by description of morphologic fea-tures, distinct patterns have been presented for classification of FAF changes [27]. These patterns seem to offer a certain predictive value for disease progression [23].
In search of a biomarker for assessment of individual ARMD risk and early detection, MP is continuously investigated. A variety of methods are available for the non-invasive measurement of MP. The two-wavelength autofluorescence densitometry used in this study has been evaluated as a safe and highly repeatable method of measurement [6]. Allowing not only for overall
quantifica-Fig. 2 Examples from group 1 (i.e., lesion of hyperfluorescence) and group 2 (i.e., lesion of hypofluorescence) illustrating the measurement of local macular pigment optical density. Above 488-nm fundus autofluorescence (FAF) images. Below Macular pigment optical density (MPOD) maps; 1 indicating the lesion, 2 indicating the reference area
tion of MP but also for analysis of distribution and quantification in circumscribed areas is an advantage of this method of MP imaging [20].
In this study, we investigated LMPOD at the site of altered FAF in contrast to normal background FAF. In other words, we investigated the impact of the underlying disease on the signal at the two wavelengths to find a possible colocalization of FAF and LMPOD alterations. For lesions of focal increased FAF, we found no significant difference in LMPOD when compared to adjacent areas of normal FAF. The current concept implies that increased FAF is caused by lipofuscin accumulation and metabolic alteration in RPE and photoreceptor cells [24]. Our finding suggests that this does not directly affect the distribution of MP. The anatomical location of MP was investigated in earlier studies on primate and human retinas [28,29]. Deposition of MP was linked mainly to the fibers of Henle within the fovea and to the inner and outer plexiform layers in the parafoveal region. In contrast to that, changes of early ARM are mostly confined to the RPE, Bruch’s membrane, and the choroid. With this separate anatomical location, independence of both processes seems to be most likely for lesions leading to hyperfluorescence in FAF imaging.
For lesions of focal-decreased FAF, the comparison to normal FAF areas revealed a significantly lower optical density of MP at this location. Apparently, processes resulting in focal-reduced FAF might lead to a lack of MP optical density. Hypofluorescence in FAF is believed to be
caused by reduced RPE metabolic activity, cell atrophy, or thinning of the RPE monolayer because of underlying drusen [30], increase of melanin content, or absorption of FAF signal, e.g., by hemorrhage, edema, or crystalline deposits. With RPE atrophy and possibly RPE thinning as the main reason for reduced FAF intensity in our cases, one might speculate that reduced metabolism and lack of RPE cells might lead to decreased LMPOD by hindering transport and storage. However, beside the various causes of reduced FAF, one has to consider methodological reasons for this finding as well: The measurement of MP optical density by two-wavelength laser excitation is dependent on a certain intensity of FAF. As levels of extrafoveal L and Z are very low, the difference by absorption of exciting laser light is presumably very small. If a critical intensity of AF is undercut, e.g., by absence of fluorophores, signal-to-noise ratio will decrease and mea-surement will lead to an underestimation of MP optical density. In this setting, the low intensity of FAF could be the reason for a falsely low density of MP at this location. Analysis of central MP density showed no significant difference between group 1 and 2. However, a tendency to lower values in group 2 can be suspected. The sum of lesions of decreased FAF in group 2 could well have influenced the central MP density to lower values.
MP distribution in topographical relation to retinal pathology has been investigated before. As a common finding in macular telangiectasia type 2, a reduction of
Fig. 3 Distribution of local macular pigment optical density (LMPOD) at the site of lesion vs. background reference for group 1 (i.e., hyperfluorescence) and group 2 (i.e., hypofluorescence)
Fig. 4 Size of assessed fundus autofluorescence lesions in mm2 (left) and mean value of the central macular pigment (MP) optical density (OD) for group 1 and group 2, respectively
central MP optical density was reported in several pub-lications [31–33]. Involving the central 4° and a predom-inant loss of Z, the reduction was found to coincide with the disease epicenter temporal to the foveola. In Sjögren-Larsson syndrome, an autosomal recessive hereditary disorder, lack of central MP has recently been reported by van der Veen et al. [34]. In conjunction with FAF changes, the authors suggest a disturbed retinal MP metabolism, presumably located in the Müller cells as the most probable reason for the MP deficiency. Although correlating MP to the location of pathologic changes, to our knowledge local optical density of MP and focal FAF alterations have not been investigated in an almost pixel-to-pixel comparison.
By the current conception, alterations of FAF are caused by changes in metabolic activity of the RPE and photore-ceptor cells. Our results indicate that areas of focal-increased FAF have no influence on the factors determining MP optical density at the very retinal location.
For lesions exhibiting focal-decreased FAF, our results suggest a related reduction of MP optical density at this retinal location, although the weakness of the method of measurement clearly questions this finding.
Focal alterations of FAF are commonly observed in the course of ARMD development. We assume that these changes leave MP density and distribution unchanged for a long time, until the late stage of the disease, with cell loss and profound destruction of retinal layers occurring.
Acknowledgements We thank Mr. Martin Niederhaeuser and Ms. Anita Zenger for the help in the image acquisition and our study coordinator Ms. Sia Mabia Fuster for the efforts and contributions in supporting this investigation.
Clinical Trial Registration This study is registered at www. clinicaltrials.govwith the identifier: NCT00494325.
References
1. Ambati J, Ambati BK, Yoo SH, Ianchulev S, Adamis AP (2003) Age-related macular degeneration: etiology, pathogenesis, and therapeutic strategies. Surv Ophthalmol 48:257–293. doi:
S0039625703000304
2. Klein R, Klein BE, Knudtson MD, Meuer SM, Swift M, Gangnon RE (2007) Fifteen-year cumulative incidence of age-related macular degeneration: the Beaver Dam Eye Study. Ophthalmology 114:253–262. doi:10.1016/j.ophtha.2006.10.040
3. Klaver CC, Wolfs RC, Vingerling JR, Hofman A, de Jong PT (1998) Age-specific prevalence and causes of blindness and visual impairment in an older population: the Rotterdam Study. Arch Ophthalmol 116:653–658
4. Boulton M, Dayhaw-Barker P (2001) The role of the retinal pigment epithelium: topographical variation and ageing changes. Eye (Lond) 15:384–389
5. Bird A (1996) Age-related macular disease. Br J Ophthalmol 80:2–3 6. Delori FC, Fleckner MR, Goger DG, Weiter JJ, Dorey CK (2000) Autofluorescence distribution associated with drusen in
age-related macular degeneration. Invest Ophthalmol Vis Sci 41:496–504
7. von Ruckmann A, Fitzke FW, Bird AC (1997) Fundus autofluorescence in age-related macular disease imaged with a laser scanning ophthalmoscope. Invest Ophthalmol Vis Sci 38:478–486
8. Delori FC, Dorey CK, Staurenghi G, Arend O, Goger DG, Weiter JJ (1995) In vivo fluorescence of the ocular fundus exhibits retinal pigment epithelium lipofuscin characteristics. Invest Ophthalmol Vis Sci 36:718–729
9. Delori FC, Goger DG, Dorey CK (2001) Age-related accumula-tion and spatial distribuaccumula-tion of lipofuscin in RPE of normal subjects. Invest Ophthalmol Vis Sci 42:1855–1866
10. Holz FG, Bellmann C, Margaritidis M, Schütt F, Otto TP, Völcker HE (1999) Patterns of increased in vivo fundus autofluorescence in the junctional zone of geographic atrophy of the retinal pigment epithelium associated with age-related macular degeneration. Graefes Arch Clin Exp Ophthalmol 237:145–152
11. Schmitz-Valckenberg S, Fleckenstein M, Scholl HPN, Holz FG (2008) Fundus autofluorescence and progression of age-related macular degeneration. Surv Ophthalmol 54:96–117. doi:10.1016/j. survophthal.2008.10.004
12. Einbock W, Moessner A, Schnurrbusch UEK, Holz FG, Wolf S, Group FS (2005) Changes in fundus autofluorescence in patients with age-related maculopathy. Correlation to visual function: a prospective study. Graefes Arch Clin Exp Ophthalmol 243:300– 305. doi:10.1007/s00417-004-1027-3
13. Nolan J, O'Donovan O, Kavanagh H, Stack J, Harrison M, Muldoon A, Mellerio J, Beatty S (2004) Macular pigment and percentage of body fat. Investig Ophthalmol Vis Sci 45:3940– 3950. doi:10.1167/iovs.04-0273
14. Mares JA, LaRowe TL, Snodderly DM, Moeller SM, Gruber MJ, Klein ML, Wooten BR, Johnson EJ, Chappell RJ, CMPSGa I (2006) Predictors of optical density of lutein and zeaxanthin in retinas of older women in the Carotenoids in Age-Related Eye Disease Study, an ancillary study of the Women's Health Initiative. Am J Clin Nutr 84:1107–1122
15. Trieschmann M, Beatty S, Nolan JM, Hense HW, Heimes B, Austermann U, Fobker M, Pauleikhoff D (2007) Changes in macular pigment optical density and serum concentrations of its constituent carotenoids following supplemental lutein and zeaxan-thin: the LUNA study. Exp Eye Res 84:718–728. doi:10.1016/j. exer.2006.12.010
16. Richer S, Devenport J, Lang JC (2007) LAST II: Differential temporal responses of macular pigment optical density in patients with atrophic age-related macular degeneration to dietary supple-mentation with xanthophylls. Optometry (St. Louis, Mo) 78:213– 219. doi:10.1016/j.optm.2006.10.019
17. Beatty S, van Kuijk FJGM, Chakravarthy U (2008) Macular pigment and age-related macular degeneration: longitudinal data and better techniques of measurement are needed. Investig Ophthalmol Vis Sci 49:843–845. doi:10.1167/iovs.07-1276
18. Bone RA, Landrum JT, Friedes LM, Gomez CM, Kilburn MD, Menendez E, Vidal I, Wang W (1997) Distribution of lutein and zeaxanthin stereoisomers in the human retina. Exp Eye Res 64:211–218. doi:10.1006/exer.1996.0210
19. Sommerburg O, Siems WG, van Kuijk FJ (2000) Localization of carotenoids in different eye tissues. Biofactors 11:3–6
20. Wüstemeyer H, Jahn C, Nestler A, Barth T, Wolf S (2002) A new instrument for the quantification of macular pigment density: first results in patients with AMD and healthy subjects. Graefes Arch Clin Exp Ophthalmol 240:666–671. doi:10.1007/ s00417-002-0515-6
21. Delori FC, Goger DG, Hammond BR, Snodderly DM, Burns SA (2001) Macular pigment density measured by autofluorescence spectrometry: comparison with reflectometry and heterochromatic
flicker photometry. J Opt Soc Am A Opt Image Sci Vis 18:1212– 1230
22. Wüstemeyer H, Moessner A, Jahn C, Wolf S (2003) Macular pigment density in healthy subjects quantified with a modified confocal scanning laser ophthalmoscope. Graefes Arch Clin Exp Ophthalmol 241:647–651. doi:10.1007/s00417-003-0730-9
23. Holz FG, Bindewald-Wittich A, Fleckenstein M, Dreyhaupt J, Scholl HP, Schmitz-Valckenberg S (2007) Progression of geo-graphic atrophy and impact of fundus autofluorescence patterns in age-related macular degeneration. Am J Ophthalmol 143:463– 472. doi:10.1016/j.ajo.2006.11.041
24. Sparrow JR, Yoon KD, Wu Y, Yamamoto K (2010) Interpretations of fundus autofluorescence from studies of the bisretinoids of the retina. Invest Ophthalmol Vis Sci 51:4351–4357. doi:10.1167/ iovs.10-5852
25. Holz FG, Schütt F, Kopitz J, Eldred GE, Kruse FE, Volcker HE, Cantz M (1999) Inhibition of lysosomal degradative functions in RPE cells by a retinoid component of lipofuscin. Invest Ophthalmol Vis Sci 40:737–743
26. Schütt F, Davies S, Kopitz J, Holz FG, Boulton ME (2000) Photodamage to human RPE cells by A2-E, a retinoid component of lipofuscin. Invest Ophthalmol Vis Sci 41:2303–2308 27. Bindewald A, Bird AC, Dandekar SS, Dolar-Szczasny J,
Dreyhaupt J, Fitzke FW, Einbock W, Holz FG, Jorzik JJ, Keilhauer C, Lois N, Mlynski J, Pauleikhoff D, Staurenghi G, Wolf S (2005) Classification of fundus autofluorescence patterns in early age-related macular disease. Invest Ophthalmol Vis Sci 46:3309–3314. doi:10.1167/iovs.04-0430
28. Trieschmann M, Van Kuijk FJGM, Alexander R, Hermans P, Luthert P, Bird AC, Pauleikhoff D (2008) Macular pigment in the human retina: histological evaluation of localization and distribu-tion. Eye 22:132–137. doi:10.1038/sj.eye.6702780
29. Snodderly DM, Auran JD, Delori FC (1984) The macular pigment. II. Spatial distribution in primate retinas. Investig Ophthalmol Vis Sci 25:674–685
30. Green WR, Enger C (2005) Age-related macular degeneration histopathologic studies: the 1992 Lorenz E. Zimmerman Lec-ture. 1992. Retina 25:1519–1535. doi: 00006982-200507001-00015
31. Charbel Issa P, van der Veen RLP, Stijfs A, Holz FG, Scholl HPN, Berendschot TTJM (2009) Quantification of reduced macular pigment optical density in the central retina in macular telangiectasia type 2. Exp Eye Res 89:25–31. doi:10.1016/j. exer.2009.02.006
32. Gillies MC, Zhu M, Chew E, Barthelmes D, Hughes E, Ali H, Holz FG, Scholl HPN, Issa PC (2010) Familial asymptomatic macular telangiectasia type 2. OPHTHA 116:2422–2429. doi:10.1016/j.ophtha.2009.05.010
33. Helb H-M, Charbel Issa P, van der Veen RLP, Berendschot TTJM, Scholl HPN, Holz FG (2008) Abnormal macular pigment distribu-tion in type 2 idiopathic macular telangiectasia. Retina (Philadelphia, Pa) 28:808–816. doi:10.1097/IAE.0b013e31816d81aa
34. van der Veen RL, Fuijkschot J, Willemsen MA, Cruysberg JR, Berendschot TT, Theelen T (2010) Patients with Sjögren-Larsson syndrome lack macular pigment. Ophthalmology 117:966–971. doi:10.1016/j.ophtha.2009.10.019