DEVELOPMENT OF AN AUTOLAND SYSTEM FOR GENERAL
AVIATION AIRCRAFT
Diana Siegel and R. John Hansman
This report is based on the S. M. Thesis of Diana Siegel submitted to the Department of Aeronautics and Astronautics in partial fulfillment of the requirements for the degree of
Master of Science at the Massachusetts Institute of Technology. The work presented in this report was also conducted
in collaboration with Avidyne, Inc
Report No. ICAT-2011-09 Sept 2011
MIT International Center for Air Transportation (ICAT) Department of Aeronautics & Astronautics
Massachusetts Institute of Technology Cambridge, MA 02139 USA
Development of an Autoland System for General Aviation
Aircraft
by
Diana Siegel
Submitted to the Department of Aeronautics and Astronautics on September 28, 2011, in partial fulfillment of the
requirements for the degree of
Master of Science in Aeronautics and Astronautics
Abstract
Accidents due to engine failure, pilot disorientation or pilot incapacitation occur far more frequently in general aviation than in commercial aviation, yet general aviation aircraft are equipped with less safety-enhancing features than commercial aircraft. This thesis presents the design of an emergency autoland system that includes automatic landing site selection, guidance to the selected landing site and guidance along the final approach, in addition to the automatic landing capability provided by conventional autoland systems. The proposed system builds on the capability of a general aviation autopilot, flight management system and GPS/WAAS augmented, integrated navigation system. The system provides this automatic landing capability without the use of automatic throttle control and without the use of a radar altimeter, which are essential to conventional autoland systems, but are typically lacking on general aviation aircraft. The design addresses the challenge of no automatic throttle control by utilizing only two simple power settings: cruise power and zero power. The lack of radar altimeter is addressed by appropriate flare planning and placement of the target touchdown point. The approach from the point of autoland initiation, to the approach fix at the the landing site, is performed at cruise power, provided that power is available. The final approach from the approach fix to touchdown, is performed at zero power. Control of the touchdown point location during the final approach is achieved through adjustment of the length of the trajectory, whenever the aircraft’s glide performance deviates from the expected performance. The aircraft’s glide performance is measured online as the aircraft tracks the planned trajectory. The performance of the final design is evaluated in simulation in terms of touchdown point dispersion, sink rate and attitude on touchdown.
Thesis Supervisor: R. John Hansman
Acknowledgments
This work has been performed in collaboration with Avidyne, Inc. and was supported by the Avidyne Fellowship.
Contents
1 Introduction 21
1.1 Background . . . 21
1.2 Motivation for Design of Autoland System . . . 22
1.3 Design Goal . . . 25 1.4 Design Constraints . . . 27 1.5 Literature Review . . . 30 2 System Description 33 2.1 System Concept . . . 33 2.1.1 Overview . . . 33
2.1.2 Engine Status Detection . . . 35
2.1.3 Landing Site Selection . . . 36
2.1.4 Autoland Approach Procedure . . . 39
2.1.5 Baseline Holding Pattern and Traffic Pattern . . . 41
2.1.6 Trajectory Planning using Energy Management . . . 44
2.1.8 Aircraft Energy Monitoring and Energy Error Detection . . . 50
2.1.9 Trajectory Updating . . . 53
2.1.10 Placement of the Target Touchdown Point . . . 63
2.1.11 Flare . . . 70
2.2 Autoland - FMS Interface . . . 71
2.2.1 Trajectory Specification . . . 71
2.2.2 Use of Local and Global Coordinate Systems . . . 74
2.3 User Operations . . . 77
2.3.1 Autoland Initiation . . . 77
2.3.2 Increase Throttle Command . . . 77
2.3.3 Status Display for Selected Landing Site and Planned Trajectory . . . 78
2.3.4 Prepare to Land Tutorial . . . 79
2.3.5 Request to Reduce Throttle at Initial Point . . . 79
2.3.6 Request to Apply Brakes . . . 80
3 System Architecture 81 3.1 Static Decomposition . . . 82
3.1.1 Autoland Layers . . . 82
3.1.2 Autoland Components . . . 83
3.1.3 Autoland Modules . . . 85
3.2 Autoland Modes and Phases . . . 89
3.2.2 Phases . . . 91
3.3 Autoland Interfaces . . . 94
3.3.1 External Interfaces . . . 94
3.3.2 Internal Interfaces . . . 97
3.3.3 Design Constants . . . 102
3.3.4 Complete System Diagram . . . 103
4 Simulation Environment 105 4.1 Aircraft Model for Evaluation of Touchdown Point Dispersion . . . 105
4.1.1 Point Mass Model . . . 106
4.1.2 Trajectory Tracking Controller . . . 109
4.2 Aircraft Model for Evaluation of Flare Performance . . . 111
4.2.1 High-fidelity Aircraft Model . . . 111
4.2.2 Flare Controller . . . 112
4.3 Wind Model . . . 113
4.4 Wind Estimator Model . . . 114
4.5 Performance Estimator Model . . . 115
4.6 Energy Manager Model . . . 116
4.7 Trajectory Updator Model . . . 116
5 Results 117 5.1 Evaluation of Effect of Wind on Touchdown Point Dispersion . . . 118
5.1.1 Test Setup For Evaluation of Effect of Wind on Touchdown Point
Dispersion . . . 118
5.1.2 Illustration of Test Case 1 for Evaluation of Effect of Wind on Touch-down Point Dispersion . . . 120
5.1.3 Summary of Effect of Wind on Touchdown Point Dispersion . . . 125
5.1.4 Discussion of Effect of Wind on Touchdown Point Dispersion . . . 126
5.2 Evaluation of Flare Performance . . . 127
5.2.1 Test Setup for Evaluation of Flare Performance . . . 127
5.2.2 Illustration of Test Case 1 for Evaluation of Flare Performance . . . . 128
5.2.3 Summary of Flare Performance Test Results . . . 131
5.2.4 Discussion of Flare Performance Test Results . . . 132
6 Conclusion and Future Work 135 6.1 Conclusion . . . 135
6.2 Future Work . . . 136
A Module Descriptions 141 A.1 Modules of Layer Destination Planning . . . 141
A.1.1 Engine Status Detection . . . 141
A.1.2 Range calculator . . . 142
A.1.3 Landing Site Prioritizer . . . 144
A.1.4 Initial Point Calculator . . . 149
A.2 Modules of Layer Trajectory Planning . . . 152
A.2.1 Energy Calculator . . . 152
A.2.2 L/D 0 estimator . . . 152
A.2.3 L/D expected Generator . . . 157
A.2.4 Path planner to Initial Point . . . 159
A.2.5 Flight Plan Feasibility Monitor . . . 161
A.2.6 Excess Energy Calculator . . . 163
A.2.7 Holding Pattern Generator/Updator . . . 165
A.2.8 Traffic Pattern Trajectory Generator . . . 167
A.2.9 Energy Curve Manager . . . 171
A.2.10 Traffic Pattern Energy Error Detector . . . 174
A.2.11 Traffic Pattern Trajectory Updator . . . 176
A.3 Modules of Layer Trajectory Following . . . 187
A.3.1 Trajectory to Initial Point Follower . . . 187
A.3.2 Holding Pattern Follower . . . 188
A.3.3 Traffic Pattern Follower . . . 191
A.3.4 Flare Controller . . . 194
A.4 Selected Library Functions . . . 195
A.4.1 convertToGlobalCoords . . . 195
A.4.2 getTurnEntryLine . . . 196
A.4.4 calcDistToGo . . . 200 A.4.5 calcInterceptPoint . . . 202
List of Figures
1-1 Autoland integration with its environment . . . 26
1-2 Airspeed and flight path angles for various throttle settings . . . 28
2-1 Overview of autoland concept . . . 35
2-2 Pseudocode for automatic engine status detection . . . 36
2-3 Landing site selection process . . . 38
2-4 Aircraft trajectory during autoland for case engine operational and no obstacles 40 2-5 Sequence of functions performed during approach procedure in case engine operational . . . 41
2-6 Length and shape of the baseline trajectory . . . 43
2-7 Naming convention for holding pattern legs and traffic pattern legs . . . 46
2-8 Energy dissipation with ground distance travelled . . . 47
2-9 Determination of observed glide ratio while in flight . . . 49
2-10 Calculation of the expected glide ratio, L/Dexp, from L/D0 . . . 50
2-11 Concept of excess energy correction through trajectory elongation . . . 51
2-12 Update of energy vs. range-to-go reference curve upon receipt of new aircraft glide performance and wind estimate . . . 52
2-13 Direction and sizing of holding pattern . . . 54
2-14 Trajectory updating method on the downwind leg . . . 56
2-15 Trajectory updating method on the base leg . . . 58
2-16 Example of trajectory updating on the base leg after first update . . . 59
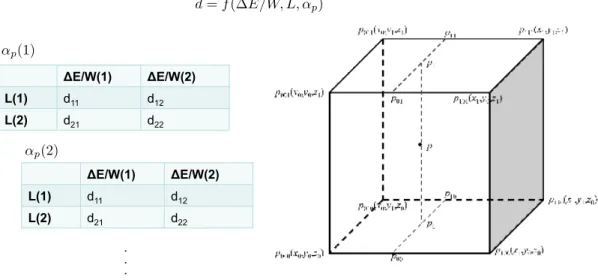
2-17 Concept of a 3D lookup table for determination of d on downwind leg . . . . 61
2-18 Percent change in length of trajectory and amount of final leg length required for range of angles turned away from trajectory . . . 62
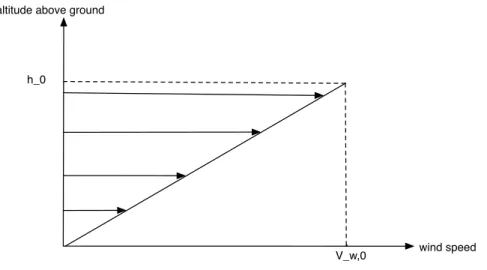
2-19 Example of change in wind speed, S and direction, dir with altitude in the atmospheric boundary layer . . . 65
2-20 Linear approximation of change in wind speed in the boundary layer . . . 65
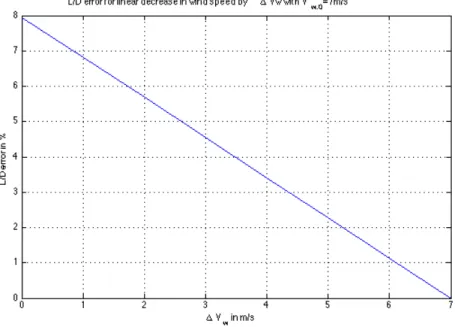
2-21 L/D error resulting from assuming linear reduction in wind speed of Vw,0when wind reduces only by ∆Vw . . . 67
2-22 Overshoot or undershoot from error in estimating expected L/D . . . 68
2-23 Placement of target touchdown point for consideration of L/D estimation error and GPS error . . . 69
2-24 Flare maneuver under uncertainty in vertical position . . . 71
2-25 Specification of the autoland trajectory as set of straight line segments and hold loop . . . 72
2-26 Local North-East coordinate system before and after rotation by amount equal to runway heading . . . 76
2-27 Conceptual visual cue for operator to increase throttle . . . 78
2-28 Conceptional display of target destination and planned trajectory on moving map . . . 78
2-29 Conceptual visual cue for operator to reduce throttle to zero . . . 79
3-1 Autoland layers . . . 82
3-2 Autoland system architecture . . . 83
3-3 Autoland system architecture . . . 85
3-4 Autoland modes as determined by engine status . . . 90
3-5 Autoland phases determining the lateral trajectory followed by the aircraft . 93 3-6 Autoland external interfaces . . . 94
3-7 Autoland component internal interfaces active during phase ”Follow Traffic Pattern” . . . 98
3-8 Autoland component internal interfaces . . . 99
3-9 Full system diagram . . . 104
4-1 Wind profile for linear reduction in wind speed in boundary layer . . . 114
4-2 Wind profile for near-constant wind speed in boundary layer . . . 115
4-3 Wind profile for inversion of wind direction in boundary layer . . . 116
5-1 Left traffic pattern trajectory used to test the performance of the autoland software prototype . . . 119
5-2 Traffic pattern after update from 100 ft altitude error . . . 120
5-3 Energy vs. range-to-go curve before first update . . . 121
5-4 Energy vs. range-to-go curve before first update, enlarged . . . 121
5-5 Energy vs. range-to-go curve after first update . . . 122
5-7 Traffic pattern after second update due to reduction in L/D0 . . . 122
5-8 Energy vs. range-to-go curve before second update . . . 123
5-9 Energy vs. range-to-go curve before second update, enlarged . . . 123
5-10 Energy vs. range-to-go curve after second update . . . 123
5-11 Energy vs. range-to-go curve after second update, enlarged . . . 123
5-12 Trajectory before and after each update and actual trajectory flown . . . 124
5-13 Test setup for performance evaluation of flare controller . . . 128
5-14 Commanded sink rate and actual aircraft sink rate during flare maneuver . . 129
5-15 Altitude vs. horizontal distance travelled during flare maneuver . . . 130
5-16 Change in aircraft position and velocity during flare maneuver . . . 130
5-17 Evolution of angle of attack, flight path angle and pitch during flare maneuver 131 6-1 Autoland integration with its environment . . . 138
A-1 Runway search in engine operational case . . . 146
A-2 Runway search algorithm in engine operational case . . . 147
A-3 Landing site selection process for case Engine Out . . . 148
A-4 Pattern direction from cross product of V1 and V2 . . . 150
A-5 Inferring tailwind component from ground speed and wind speed . . . 155
A-6 Effect of wind on horizontal distance travelled per unit of time . . . 155
A-7 Nodes and edges connecting the nodes on a visibility graph . . . 161
A-9 Baseline and updated trajectory for max. and min. energy error expected
(rotated by−90◦ from local coordinate system) . . . 169
A-10 Local energy vs. range curve function representation . . . 173
A-11 Energy error tolerance bounds . . . 174
A-12 d vs. E/W plot for various L with αp = const = 45◦ . . . 178
A-13 d vs. E/W plot for various αp with L=const = 5,000 ft . . . 179
A-14 Geometry used to determine difference in path length between the current and updated trajectory . . . 181
A-15 d vs. E/W plot for various L with dtotal=500 ft and αp = const = 30◦ . . . . 183
A-16 d vs. E/W plot for various αp with dtotal = 500f t and L = 3, 000f t . . . 183
A-17 d vs. E/W plot for various dtotal with αp = 45◦ and L = 3, 000f t . . . 184
A-18 d vs. E/W plot for extreme ∆E/W to illustrate corner cases . . . 185
A-19 Geometry used to determine location of IP and OP . . . 190
A-20 Calculation of turn entry line . . . 197
A-21 Geometry used to determine whether turn entry line has been crossed at location, P . . . 200
A-22 Calculation of Range-To-Go until start of the next segment . . . 202
A-23 Calculation of distance from line . . . 203
A-24 Geometry used to determine the lead distance to the waypoint at which a turn should be initiated . . . 205
List of Tables
1.1 GA accidents in 2007 and 2008 . . . 23
1.2 Requirements on autoland system . . . 27
3.1 Autoland external interfaces . . . 96
3.2 Autoland internal interfaces . . . 101
3.3 Autoland design constants . . . 102
5.1 Summary of test results . . . 125
Chapter 1
Introduction
1.1
Background
Automatic landing systems have existed for about half a century, with British Airways having made the first automatic landing during a commercial flight in June 1965 using an auto-matic flare controller in the pitch axis [1]. A landing with full control in all three axes was achieved shortly after in 1966. Landing aids that guide the aircraft down to flare height have been developed since 1920 [16]. On September 19, 1930, H. Diamond and F.W. Dunmore presented the design and hardware for a landing aid based on radio navigation similar to today’s Instrument Landing System (ILS) [9]. Today’s commercial autoland systems utilize
the ILS’ vertical and lateral guidance to descend towards the runway at a glide path of−3◦,
while keeping the aircraft’s track aligned with the runway centerline. At around 30 ft above the ground, the aircraft enters the flare mode, during which the aircraft pitches up to reduce the vertical speed from its current descent rate to 1-3 ft/s by touchdown [18].
Automatic landing equipment is certified to either category CAT I, CAT II or CAT III, which determines the minimum altitude above the touchdown zone that the automatic land-ing system may be used. This minimum altitude is defined as the decision height. At the decision height, the pilot must have the runway in sight and be able to see as far down the
runway as prescribed by the minimum runway visual range. If, at the decision height, the runway is not in sight, or runway visual range is smaller than the minimum range specified, the pilot is required to execute a missed approach and go-around to re-attempt the landing or divert to another airport. In order to be able to perform an approach in a specific cat-egory, both the on-board and the ground-based equipment need to be certified to at least this specific category.
General aviation aircraft level equipment is typically certified to CAT I only, which spec-ifies a decision height not lower than 200 ft and a runway visual range not less than 1,800 ft. Therefore, general aviation autopilot systems must be decoupled at 200 ft and the land-ing performed manually. Commercial aircraft are typically certified to CAT III, which is sub-divided into CAT IIIa, CAT IIIb and CAT IIIc. CAT IIIc specifies zero decision height and zero runway visual range and is to the author’s knowledge at this time not certified for any ground-based equipment at any airport worldwide. CAT IIIb authorizes landings with as low as zero decision height and runway visual range as low as 150 ft. The CAT IIIb ILS approach to runway 25L at LAX, for example, is certified for zero decision height and runway visual range of 600 ft. Certification to CAT III requires redundant auto-flight systems including redundant ways of actuating all flight controls and redundant autopilots. Furthermore redundant radar altimeters are required to accurately measure the distance over ground. This type of equipment is commonly found on commercial aircraft but not typically on general aviation aircraft since the hardware cost is prohibitive for most private operators.
1.2
Motivation for Design of Autoland System
Accidents in commercial aviation have continuously decreased since the early days of avia-tion with typical fatal accident rates now being less than 0.02 per 100,000 flight hours with a total of 16 million flight hours [22]. The fatal accident rate in general aviation, however, is more than 50 times higher than that, with a rate of 1.3 per 100,000 flight hours for a total of 30 million flight hours [6]. In part, this is due to the fact that general aviation pilots fly
2007 2008 Total (fatal) Total (fatal) Mechanical failure (with power loss) 132 (14) 104 (9) Unknown loss of power 118 (12) 102 (14)
Fuel mismanagement 90 (9) 73 (9)
Pilot incapacitation 6 (4) 3 (3)
Total loss of power +
pilot incapacitation accidents 346 (39) 283 (35) Total number of GA accidents 1385 (252) 1254 (236) Loss of power +
pilot incapacitation % of all GA accidents 25.0% (15.5%) 22.6% (14.8 %)
Table 1.1: GA accidents in 2007 and 2008
shorter routes and hence have more takeoffs and landings, the most accident-prone part of the flight, compared to commercial operators. The difference in pilot training and aircraft equipage, however, also contributes to the high accident rates in general aviation compared to commercial aviation. Commercial aircraft are equipped with many safety enhancing fea-tures, such as traffic advisory systems, ground proximity warning systems, etc. that general aviation aircraft lack. Given the accident statistics, however, there is an equal need for ad-ditional safety enhancing features on general aviation aircraft.
Accidents in general aviation occur due to mechanical failures, adverse weather and pi-lot error to name a few. This thesis addresses two specific causes for accidents in general aviation, which taken together produce a large proportion of the fatal accidents: pilot in-capacitation and loss of power. Though pilot inin-capacitation contributes few numbers of accidents, the chance that this type of accident ends fatal, is much higher than for any other type of accident. Pilot incapacitation may occur due to hypoxia from excess altitude, or any other medical condition. Loss of power is either due to mechanical failure or fuel mismanagement, which occurs surprisingly often, despite being entirely preventable. Table 1.1 summarizes accident statistics for general aviation aircraft in 2007 and 2008. Accidents due to loss of power and pilot incapacitation amounted to 25.0% and 22.6% of all general aviation accidents in 2007 and 2008 respectively [3, 2].
inca-pable to maintain control of the aircraft. In case of loss of power, the achievable flight range is heavily reduced, which makes it difficult for the pilot to judge which landing sites are reachable. Hence, providing automatic control of the aircraft’s trajectory and selecting and guiding the aircraft to a reachable landing site, are two main objectives that an autoland system aimed at the scenarios of pilot incapacitation and loss of power will need to address. There would be no obstacles to implementing this kind of system, if autoland had ac-cess to a representation of the aircraft’s environment and location of landing sites, and had automatic control over all flight control surfaces and the throttle. The autopilot and flight management systems as commonly found on commercial aircraft, provide precisely this func-tionality. A decade ago, these systems were rarely found on general aviation aircraft, but they are starting to be integrated more and more on this class of aircraft.
For example, the Cirrus SR-22 incorporates a complete flight automation solution with autopilot and flight management system. This system allows full control of the aircraft’s motion in the lateral plane, but only limited control in the vertical plane, since this class of aircraft typically lacks automatic throttle control. Furthermore, its integrated naviga-tion systems (INS) features WAAS (wide area augmentanaviga-tion system) enabled GPS receivers, which provide a much better position accuracy than previous GPS receivers. Without Se-lective Availability, which was turned off in 2000, previous GPS receivers achieved a typical accuracy of 15 m laterally and 20 m vertically. This level of accuracy was clearly insufficient for the landing task. The WAAS specification requires that a position accuracy of better than 7.6 m be achieved both laterally and vertically at least 95% of the time. However, measurements in the continental US have shown that GPS/WAAS receivers achieve a typ-ical accuracy of < 2 m laterally and verttyp-ically, which provides the potential to perform a precision approach based on the WAAS position information only [4]. This improvement in the accuracy of position sensing is important, since general aviation aircraft typically do not possess a radar altimeter, which provides commercial aircraft with centimeter level vertical position accuracy during the final stage of the landing.
1.3
Design Goal
The aim of this thesis is to design an autoland system to be used in case of emergency. Specifically, the design addresses the following scenarios:
• Partial or complete pilot incapacitation • Loss of power
Since loss of power can occur at any point during the flight and the pilot can become incapacitated at any point in time, the autoland system to be developed needs to have a larger scope than the typical autoland systems on commercial aircraft, which only take over once the aircraft is aligned with the runway centerline on final approach. For the case of partial or complete pilot incapacitation, the pilot needs to be able to rely on autoland to automatically select a suitable landing site, guide the aircraft to the landing site and perform the approach and landing. For complete pilot incapacitation, autoland may not require any input from the pilot. However, there is the possibility of a passenger being present, which autoland aims to draw on, in order to provide control inputs to enhance autoland performance in the event of complete pilot incapacitation. This passenger is assumed to be untrained in piloting the aircraft, so that any interaction with the passenger should be kept as simple as possible. The same applies to any interaction with a partially incapacitated pilot.
For the case of loss of power, the pilot can assumed to be alert. However, in this situation, it is difficult for the pilot to judge which landing sites are reachable, how to best reach the landing site given en-route terrain and how to match the length of the final approach to the glide performance of the aircraft. Hence, automatic landing site search and guidance to the landing site is required in this scenario, in addition to guidance along the final approach.
This capability will need to be achieved with only the typical hardware equipage found on a general aviation aircraft. Adding hardware is considered to not be an option, since the cost would inhibit adoption of the system. The model aircraft used to represent a ”typical” general aviation aircraft is a Cirrus SR-22 equipped with an Avidyne DFC-90 autopilot,
GPS/WAAS augmented integrated navigation system (INS) and a flight management system (FMS). It is acknowledged that many general aviation aircraft do not possess this level of automation. However, this design will be targeted at aircraft that are already equipped with an autopilot, FMS and INS.
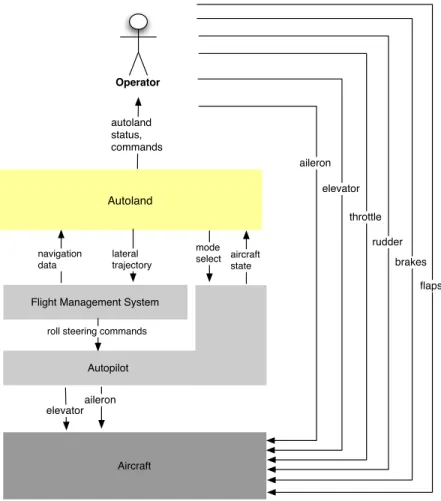
Figure 1-1 shows the environment, in which autoland is expected to operate. For landing
Flight Management System Autoland Operator autoland status, commands aircraft state elevatoraileron throttle elevator aileron lateral trajectory navigation data Autopilot
roll steering commands
mode select Aircraft rudder brakes flaps
Figure 1-1: Autoland integration with its environment
site selection and trajectory planning, autoland can draw aircraft state information, such as aircraft location, velocity and angular rates from the autopilot, and navigation data from the FMS. After having constructed a path to the selected landing site, autoland can pass the desired trajectory to the FMS for tracking in the lateral plane. Based on the commanded trajectory and the aircraft’s current position, the FMS generates roll steering commands, that the autopilot subsequently passes on to the aileron servo. The autopilot itself controls
Functional requirements
FUNC 1 Select a suitable landing site
FUNC 2 Compute an obstacle-free trajectory to the selected landing site
FUNC 3 Guide the aircraft to the selected landing site FUNC 4 Compute a feasible approach pattern to
the touchdown zone
FUNC 5 Guide aircraft along the approach pattern FUNC 6 Perform automatic touchdown
FUNC 7 Indicate autoland status to pilot and passenger Non-functional requirements
NFUNC 1 Implement functionality as software upgrade only (no additional hardware to be included)
NFUNC 2 Commands given to the operator shall be simple enough to require no prior pilot training
NFUNC 3 Design system interface to the FMS and the autopilot so that little to no modification of the FMS/autopilot functionality is required
Table 1.2: Requirements on autoland system
the elevator based on the selected vertical mode. Aileron and elevator may be actuated manually or automatically, as illustrated by the connector from the operator to the aircraft and from the autopilot to the aircraft. The throttle, rudder, brakes and flaps, however, may only be actuated manually. This imposes natural limitations on the performance of the autoland system for general aviation aircraft when compared to the performance of the autoland system of a commerical aircraft, which also possesses automatic control over rudder, throttle and brakes. In addition to that, autoland will need to perform the touchdown without a radar altimeter. A summary of the requirements on the autoland system to be developed is given in table 1.3.
1.4
Design Constraints
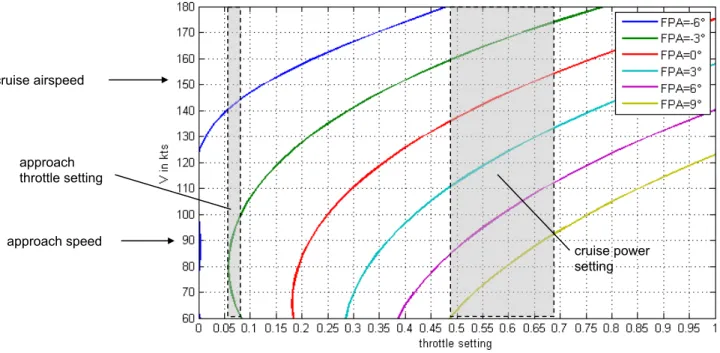
The lack of auto-throttle has the strongest effect on autoland performance, since it limits the achievable flight path angles. Figure 1-2 shows the limitations imposed by the lack of throttle control, by illustrating the range of airspeeds and flight path angles achievable for a
given throttle setting. The throttle setting ranges from 0 to 1 representing a change in engine power output from 0% to 100% ignoring losses and non-linear behavior. If the throttle is stuck in one position, the aircraft’s motion in the vertical plane can only be effected by the elevator. The elevator can be used to increase or decrease the flight path angle and increase and decrease the airspeed, but cannot control both the flight path angle and the airspeed at the same time. As a result, the elevator can increase the flight path angle only until the airspeed reaches the stall speed, and decrease the flight path angle only until the airspeed exceeds the aircraft’s maximum design speed. Hence, the lack of auto-throttle limits the range of flight path angles achievable for a given throttle setting.
If the pilot became incapacitated during cruise flight, i.e. 0◦flight path angle, the throttle
approach speed cruise airspeed approach throttle setting cruise power setting
Figure 1-2: Airspeed and flight path angles for various throttle settings
would typically be fixed between 50% and 70%. The airspeed would hence measure between 140 - 160 kt. The standard ILS glideslope guides the aircraft along a flight path angle of
−3◦. At a throttle setting of 60%, this flight path angle would result in an airspeed of
Approaching at this speed would result in the nose wheel hitting the ground first, if an attempt to land were made, or the aircraft floating off the runway and regain altitude, if the nose was attempted to be pulled up before touchdown. In order to avoid stall or excessive airspeed during final approach, the throttle setting should be kept within 6% to 8%. It should be recognized, that manually setting the throttle to this very narrow region is a non-trivial task, especially when the exact numbers will need to be adjusted for wind and aircraft performance from one landing to another. Assuming the pilot is incapacitated, a passenger would most likely not be able to establish the correct throttle setting in time. Therefore, the autoland system to be developed, is forced to consider alternatives to the standard approach
on a −3◦ glideslope. During the loss of power scenario, the throttle setting can be taken as
effectively zero. Inspection of Figure 1-1 shows that the flight path angle at the recommended
approach speed of 90 kt is −6◦.
The lack of radar altimeter is considered to have the second strongest effect on autoland performance. Not knowing the exact time and location, at which the aircraft will touch down, leads to touchdown point dispersion and the requirement on autoland to plan the flare so that the aircraft an earlier, or later than expected touchdown can be tolerated.
The lack of rudder affects autoland’s ability to ”de-crab” the aircraft during a crosswind landing before touchdown, i.e. aligning the nose of the aircraft with the runway centerline. Touching down sideways with the nose pointing off the runway centerline, would exert an undesirable load on the landing gear and potentially cause the aircraft to run off the side of the runway. However, this is deemed to be tolerable, given that the system is aimed at an emergency situation.
Finally, if neither the pilot nor the passenger are able to operate the brakes, the lack of automatic braking would cause an elongation in rollout distance of at minimum a factor of five, which would cause the aircraft to run off the end of the runway. This is considered to be a dangerous scenario, since obstacles are likely to be present beyond the end of the runway. Hence the pilot or passenger would need to be requested to apply brake pressure, if at all possible. If no manual input can be provided, autoland would need to exercise any
means available to decrease the stopping distance. One possibility is to deliberately run the aircraft off the side of the runway to utilize the higher rolling friction provided by grassy or dirt areas.
It should be noted that, if the aircraft autoland is designed for, uses a retractable gear, the pilot would need to be requested to lower the gear before the approach is started. Since the Cirrus SR-22 is fitted with non-retractable landing gear, this step is not necessary.
1.5
Literature Review
Emergency landing aids have previously been investigated for application to commercial aircraft. Meuleau, Plaunt and Smith proposed an emergency landing planner for damaged aircraft, which determines potential landing sites and feasible trajectories to the landing site and organizes each solution by increasing amount of risk. The decision to which airport to fly along which route is left to the pilot [15]. Furthermore, Atkins, Portillo and Strube presented an emergency flight planner specifically applied to total loss of thrust for general aviation aircraft. This planner calculates the aircraft’s reachable footprint and uses prioriti-zation based on information from the FMS database to automatically find the most suitable landing site. Subsequently, the planner generates a trajectory to the touchdown zone by using estimates on the minimum and maximum achievable vertical flight path angle. The planner is adaptive in the sense that it updates the projected trajectory based on changes in aircraft performance [7]. The space shuttle’s mission abort flight manager (SAFM) uses a similar approach. Based on the current state vector of the shuttle, the SAFM determines a feasible landing site and calculates a trajectory to this landing site using aircraft performance boundaries. These boundaries are determined from knowledge of the maximum and mini-mum drag profiles achievable by the control system [14]. The space shuttle’s terminal area energy manager (TAEM) synthesizes a landing trajectory from pre-defined maneuvers and controls energy vs. range-to-go until touchdown by modulating dynamic pressure and speed brake. If these modulation tequniques are insufficient, the TAEM elongates or shortens the
trajectory to match the observed shuttle energy [10].
Controllers that guide the aircraft along a suitable vertical profile once the aircraft has been aligned with the runway centerline have been designed for commercial aircraft, small and large-scale Unmanned Aerial Vehicles (UAV) and also for general aviation sized aircraft. In all cases, automatic control over thrust, however, has been assumed. Wagner and Valasek, for example, investigated the performance of a QFT controller in comparison to the standard proportional-integral controller for automatic landing of a medium-sized UAVs and general aviation aircraft [21]. Shue and Agarwal designed an H2/H-Infinity controller for automatic landing of commercial aircraft [19].
In 1994, the FAA and UPS successfully tested automatic landings using only differential GPS (DGPS) for positioning information with a Boeing 757 [13]. DGPS uses local ground stations installed at the airport to transmit corrections for the raw GPS signal received from the satellite. Hence, given accurate position information and automatic throttle control, automatic landing controllers have been proven successful for any size of aircraft from small UAVs to large transport aircraft. The specific contribution of this thesis, is to investigate the feasibility of an automatic landing system for general aviation aircraft without automatic throttle control and positioning information only to the accuracy of WAAS augmented GPS.
Chapter 2
System Description
2.1
System Concept
2.1.1
Overview
The autoland system proposed encompasses the tasks from autoland initiation, automatic scenario detection, landing site selection and trajectory planning, to final approach and landing. The autoland system resolves the challenge of no automatic throttle control by using only two simple, distinct power settings: cruise power and zero power. Cruise power is used to fly from the point of autoland initiation to an initial point located at a fixed distance and direction from the runway threshold of the selected landing site. Zero power is then used to fly the final approach from the initial point to the touchdown point. This choice is due to the fact that at zero power, it is always possible to perform a landing without further input from the pilot, assuming that initial conditions and wind speed remain within design range.
If the autoland system attempted to perform an approach on the standard −3◦ glideslope,
the system would need to rely on the pilot to reduce the throttle to zero at the time of flare in a timely manner, or else the aircraft would be trapped in a situation, where it is unable to climb in order to abort the landing, and unable to land due to excess power. Excess power
on landing would either result in the nose-wheel touching down first or the aircraft floating off the runway. Furthermore, requesting the operator to reduce the throttle all the way to zero is a simple command to follow. It is reasonable to assume that a partially incapacitated pilot or untrained passenger will be able to follow a command requesting to pull the throttle back when given visual and audible cues. Finally, this approach has the advantage that the ”Incapacitated Pilot” and ”Loss of Power” scenarios can be treated equally from the start of the gliding approach at the initial point. The two cases need to be treated differently only for landing site selection and guidance to the initial point. Figure 2-1 summarizes the overall design concept.
After initiation, autoland automatically determines whether the engine is operational or has failed. Based on the engine status, autoland selects a landing site within the aircraft’s range and guides the aircraft to the initial point. At the initial point, autoland requests the pilot to reduce the throttle to zero, if the power is not zero already, so that the final approach can be performed at power off. With this choice, the timing of the throttle reduction is not critical, which reduces reliance on the human operator. As long as the power has not been reduced to zero, autoland commands the aircraft to loiter in a holding pattern at the initial point. With this approach, the system is also capable of fully autonomous operation, given that the initial throttle setting is sufficient for straight and level flight. In the event that the pilot is fully incapacitated and cannot actuate the throttle, the aircraft loiters until fuel is depleted. Once the power has reduced to zero due to fuel starvation, the approach is started. With this concept, the autoland system is capable of autonomously guiding the aircraft from its current location to the selected landing site given that the throttle setting is greater than the setting required to maintain straight and level flight, or smaller than the maximum power at which a successful power on approach can be performed. If the power setting is in between these thresholds, the aircraft will not be able to hold altitude, while not being able to land in a nose-up attitude. In this situation, autoland will audibly and visually request the operator to increase throttle, while aiming for an unpopulated area at wings level. As soon as autoland has detected an increase in power, re-planning will be performed in order
6 Autoland initiation by button press Automatic engine status detection Limited number of possible landing sites
Engine failed Engine operational ? Runway Large number of possible landing sites Landing site selection based on range Final approach with power-off Runway Reduce power to zero
Figure 2-1: Overview of autoland concept to select a more favorable emergency landing site.
2.1.2
Engine Status Detection
Engine status detection is performed automatically using the %power indicator available on the Cirrus SR-22. The engine status will either be classified as ”Engine Operational”, ”Engine Out” or ”Indeterminate”. The engine status is deduced to be ”Engine Operational” if the engine output power is high enough so that straight and level flight can be maintained.
This setting will vary from aircraft to aircraft and is denoted by pu. For the SR-22, this
value is about 20%. The engine is deduced to have failed, if power output is smaller than the maximum power setting at which a successful power-on approach can be performed. This
Engine Status Detector
while status == “Indeterminate”!
if %power > p_u%!
status = “Engine Operational” !
elseif %power < p_l%! status = “Engine Out”!
request pilot to increase throttle to cruise power!
else!
status = “Indeterminate”!
request pilot to increase throttle to cruise power!
end if;! end while;!
% power
engine status
Figure 2-2: Pseudocode for automatic engine status detection
for different aircraft. In case the power setting is in between pu and pl, the engine status
becomes ”Indeterminate”. This is a dangerous case, since it is not immediately handled by the current system design without throttle adjustment from the operator. At this throttle setting, the aircraft is neither capable of maintaining altitude nor capable of performing a landing without risking nose-wheel barrowing or floating down the runway. Furthermore, the shallow descent angle also makes the aircraft prone to hitting obstacles while on approach. If this case is detected, autoland visually and audibly requests the pilot to increase throttle to a cruise power setting, which is about 60%.
2.1.3
Landing Site Selection
The landing site selection function is responsible for choosing a landing site within range that can be reached without colliding with terrain or known man-made obstacles along the way. The term ”within range” requires that the achievable range is 30% higher than the range required to reach the landing site from the current location in order to provide margin. Landing site selection operates differently depending on engine status. The achievable range is determined from glide performance in case the engine is out and from fuel range in case
the engine is operational. Furthermore, since there is a large difference in range between cases engine out and engine operational, the landing site search is performed under more or less demanding criteria levels. The criteria levels will be divided into levels 1-4.
In case engine operational, it is likely that there is a very large number of candidate runways within range. Therefore, the landing site selection process can afford to be more selective. However, a runway 1,000 miles away that is twice as long as a runway 50 miles away, is not better than the runway close by, if the length of the runway close by is sufficient. Hence, not all runways within range should be retrieved and compared to find the very best. Rather, autoland searches for a runway that fulfills a set of ”good enough” criteria within increasing search radii and stops the search process as soon as a runway is found that meets the criteria. This ensures that runways closest to the aircraft’s current position are prior-itized. For the engine operational case, the ”good enough” criteria simply consists of the requirement that the runway is at least 5,000 ft long. This is the length required for rollout, absorption of the touchdown point dispersion due to GPS/WAAS vertical position error, error in estimation of wind and glide performance, and a 1,000 ft safety margin. Many other criteria could have been applied, such as wind conditions at the landing site, runway surface, availability of facilities, etc. However, runway length was determined to have the strongest influence on success or failure of the landing and is therefore used as the single selection criteria for the engine operational case. Any runway longer than 5,000 ft is considered to fulfill criteria level 1.
If the engine is out, the range is dramatically reduced, which limits the number of can-didate runways up to the point where no reachable runway can be found at all. Therefore, it makes little sense to impose criteria level 1. Instead, autoland searches the full range for a candidate runway and selects the longest one it could find. This runway is then said to fulfill criteria level 2, which only requires that the selected landing site is a runway. In case that no runway could be found, the landing site selector relaxes the criteria level further and searches for a known emergency landing site, which are pre-loaded into the FMS from a database such as the Worldwide Soaring Turnpoint Exchange maintained by the glider
community [11]. A known emergency landing site fulfills criteria level 3. Finally, criteria level 4 consists of any unpopulated area.
In case the engine status is classified as ”Indeterminate”, the criteria level is initialized to level 4. This is due to the aircraft not being able to perform a landing according to the autoland approach procedure at this intermediate power setting. Hence, the goal is to guide the aircraft away from regions were it could cause damage to the population and to minimize the chances of the aircraft colliding with man-made obstacles.
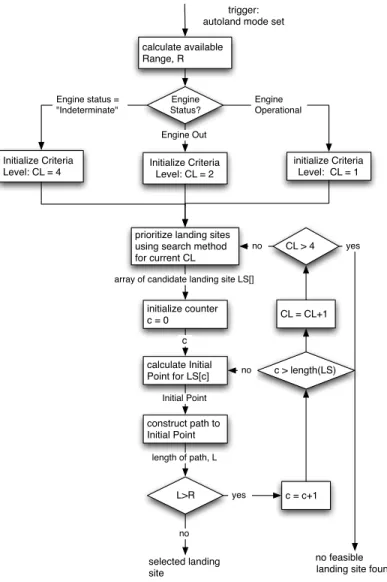
Figure 2-3 illustrates the landing site selection procedure. First, autoland determines
calculate available Range, R Engine Status? Initialize Criteria Level: CL = 2 initialize Criteria Level: CL = 1 Engine status = "Indeterminate" Engine Operational trigger: autoland mode set
prioritize landing sites using search method for current CL
initialize counter c = 0
calculate Initial Point for LS[c] array of candidate landing site LS[]
c construct path to Initial Point Initial Point L>R length of path, L c = c+1 yes c > length(LS) no CL = CL+1 CL > 4 no feasible landing site found
yes no selected landing site no Initialize Criteria Level: CL = 4 Engine Out
the achievable range and initializes the criteria level. Landing site search is initialized with criteria level 1 in case engine out, criteria level 2 in case engine operational and criteria level 4 for engine status indeterminate. The landing site prioritization function then searches for candidate landing sites at the specified criteria level and orders them according to prefer-ence. The operation of this function is detailed in the appendix, chapter A.1.3. For criteria level 1 and 2, i.e. runways, candidates are ordered by runway length, with the approach direction chosen as the headwind direction, if available. For criteria level 3, i.e. emergency landing sites, distance to go to the landing site is used for prioritization. For criteria level 4, i.e. unpopulated area, the size of the area determines the position in the ordered list. Autoland then steps through the list of candidate landing sites and attempts to generate an obstacle-free trajectory to the landing site. If successful, the landing site is selected and all lower ranked candidates discarded. If the end of the list is reached and no feasible trajectory could have been generated, autoland relaxes the criteria level and repeats the search at the new criteria level and the process repeats. Details of path planning function, that attempts to generate an obstacle-free trajectory to the initial point are discussed in the appendix, chapter A.2.4
2.1.4
Autoland Approach Procedure
After the landing site has been selected and a feasible path to the initial point determined, autoland uses the trajectory following functionality of the the FMS to guide the aircraft from its current position to the initial point. If there are no obstacles along the straight line trajectory between the aircraft’s current location and the initial point, the aircraft flies a straight line path to the initial point and aligns with the downwind leg by the time it reaches the initial point as shown in Figure 2-4. In this illustration, it is assumed that the engine is operational and that straight and level flight is possible. In case the engine is out, the aircraft would lose altitude along the path to the initial point and the straight line trajectory to the initial point would slope downwards.
At the initial point, autoland requests power to be cut, if it is not zero already. While
Figure 2-4: Aircraft trajectory during autoland for case engine operational and no obstacles waiting for the power cut to occur, autoland keeps the aircraft in a holding pattern at constant altitude. The final approach trajectory is a standard right or left traffic pattern consisting of downwind leg, base leg and final leg. After power has been cut, the aircraft’s altitude, or expressed differently, the aircraft’s energy, could still be too high to start the traffic pattern. In this case, autoland calculates the number and length of holding pattern loops required in order to reduce the aircraft energy from its current level to the energy level required to start the traffic pattern. Upon exit of the holding pattern, autoland adjusts the length of the baseline traffic pattern to match the current aircraft energy and the expected glide performance. Autoland begins to track the generated pattern, using the autopilot to maintain the recommended approach speed of 90 kt.
As pointed out in chapter 1.4, the aircraft will only be able to follow the generated tra-jectory at constant airspeed, if its performance matches the expected performance exactly. Naturally, the actual glide performance of the aircraft will differ from the expected perfor-mance. This difference will make the aircraft deviate off the trajectory, which would result in the aircraft landing long or short of the target touchdown point. In order to correct any error in expected and actual glide performance of the aircraft, autoland monitors the
air-craft’s energy status and adjusts the length of the trajectory in the lateral plane if deviations off the planned trajectory in the vertical plane are observed. This scheme effectively makes the path length the controlled variable to substitute for the lack of control over the aircraft power. Figure 2-5 illustrates this process.
The autoland trajectory can be thought of to consist of three trajectory phases: The
Fly straight and level to Initial Point
Initial
point Loiter at Initial Point until E < E_max Follow traffic pattern traj. Update traffic pattern traj. Baseline trajectory Reduce
power to zero Updated trajectory Energy error
Generate traffic pattern trajectory
Figure 2-5: Sequence of functions performed during approach procedure in case engine op-erational
trajectory to the initial point, the holding pattern and the traffic pattern. While in the hold-ing pattern and traffic pattern, autoland uses trajectory updathold-ing to remove energy errors. While the aircraft is tracking the trajectory to the initial point, autoland cannot shorten the path since it already presents the shortest path found. Therefore, the trajectory is planned including range margin, which is monitored as the aircraft proceeds towards the initial point. If the range margin becomes depleted before the initial point is reached, autoland performs re-planning of the currently selected destination and trajectory.
2.1.5
Baseline Holding Pattern and Traffic Pattern
The baseline holding pattern consists of two 180◦, constant radius turns with zero straight
line segments in between the two semi-circles as shown in Figure 2-6. Elongation of the holding pattern to compensate of energy errors is achieved by increasing the length of the straight line segments. The zero length straight line segments were chosen as a baseline, since this provides the smallest possible discretization of altitude levels, at which the holding pattern can be exited.
trajectory is φ = 22.5◦. At an airspeed of 90 kt, this results in a turn radius of 1,600 ft from
equation 2.1, which results in a circle track length of 10,000 ft.
r = V
2
g· tan(φ) (2.1)
where g = 9.81sm2. For a baseline glide ratio of 10:1, the altitude levels at which the turn
can be exited are spaced by 1,000 ft, which creates a challenge for the trajectory generation
process upon exit of the holding pattern. If the bank angle was increased to 30◦, the turn
radius would reduce to 1,100 ft and the circle track length to 7,000 ft, which is a significant improvement. More importantly, however, a small turn radius is needed while following the traffic pattern, in order to allow trajectory updating for a sizable proportion of the overall length of the traffic pattern. When using the current FMS trajectory tracking functions without modification, trajectory updating is inhibited while the FMS captures the course
of a new leg. For the two 90◦ turns within the traffic pattern, this means that trajectory
updating is inhibited for one turn radius on the downwind leg and for two turn radii on the base leg. Given that the usual length of the traffic pattern legs is between 3,000 - 5,000 ft, a turn radius of 1,600 ft for the smallest sized traffic pattern would completely inhibit trajectory updating on the base leg. Even if the leg lengths were increased to 5,000 ft, the proportion of the traffic pattern available for trajectory updating is still unsatisfactory at less than 50%. Therefore, it is recommended to increase the nominal bank angle during
turns to 30◦, which will be assumed to be the nominal bank angle for the remainder of this
thesis.
The baseline traffic pattern trajectory is a standard, rectangular, right or left traffic pat-tern as shown in Figure 2-6. The traffic patpat-tern direction is chosen so that the runway is not crossed during the aircraft’s approach to the initial point. Implementation details are provided in the appendix, chapter A.1.4. The length of the pattern legs is a tradeoff between the capability to correct energy errors as the aircraft follows the downwind leg and base leg and the amount of energy error accumulated on the final leg. The shorter the final leg, the less energy error can be accumulated on the final leg, but at the same time, the less energy
r
L_B = 1,500 m = 5,000 ft L_F = 1,500m = 6,000 ft
Target touchdown point, TD
Initial point, IP 500 ft
r
r Latest intersection
of updated base leg
r r Holding pattern L_D=1,500 m = 5,000 ft F_B F_F r=340 m = 1,100 ft V=90 kts Eloop= Lloop L/Dl = 2rπ L/Dl (78) L/Dl= L/D0· cos(φ)3/2= 0.8· L/D0 (79) φ = 30◦
where L/Dx represents the (L/D)expected on the leg denoted by subscript x, with LT 1 = LT 2 = rπ2. Excess energy ∆E can be found from:
∆E/W = E/W− ET D/W− Ebase/W (80) The excess energy ∆E is allocated by moving F D outwards by distance d as described earlier. The distance to be added to the minimum length of the downwind leg and final leg becomes:
∆L = ∆E/W
(L/D)−1d + (L/D)−1f (81) where (L/D)dand (L/D)f are the(L/D)expected on the downwind leg and the base leg respectively.
Hence, the total lengths between the fixes become: L�
D= LD+ ∆L : distance between Initial Point and downwind leg fix F D L�B= LB : distance between downwind leg fix F D and base leg fix F B L�F = LF + ∆L : distance between base leg fix F B and target touchdown point
The position of the unknown downwind leg fix F D and base leg fix F B can then be found from the knowledge of the total leg lengths and the location of the initial point, I and the target touchdown point, T. Using I as the origin of a local North-East coordinate system, the location of F D becomes:
F DN orth= LDcos(χD) (82) F DEast= LDcos(χD) (83) Similarly, using T as the origin of a local North-East coordinate system, the location of F B becomes:
F BN orth= LDcos(π− χF) (84) F BEast= LDcos(π− χF) (85) π− χF represents the course in the opposite direction of the final leg course χF.
7.12 Energy Curve Manager
7.12.1 Inputs
• L F: length of straight line segment of final leg excluding the turn segment and excluding intercept margin
• L B: length of straight line segment of base leg excluding turn segments
• L D: length of straight line segment of downwind leg excluding the turn segment • (L/D)expected: expected glide ratio, one per segment of the trajectory
• E TD/W: desired touchdown energy • r: aircraft nominal turn radius
Margin for aircraft to intercept final leg from base leg 1000 ft
Margin for potential undershoot due to glide performance estimation error and GPS error
Figure 2-6: Length and shape of the baseline trajectory
error can be corrected while still on the base leg. The maximum amount, by which the remaining trajectory can be shortened at the start of the base leg is 30%, which is achieved, if base leg and final leg are of equal length. A similar argument applies to the downwind leg and base leg, which motivated the use of all equal length legs. The length of the legs was chosen to be 5,000 ft in order to provide a trajectory updating capability of greater than 50% of the time on the downwind leg and base leg if the turn radius is 1,100 ft. The choice of 5,000 ft of base leg length presents a compromise between trajectory updating capability on the base leg and the goal to minimize the length of the final leg.
Trajectory updating capability during the turns would allow for continuous energy correc-tion capability and allow for a shorter traffic pattern and hence final leg, but would require the FMS to accept course changes, while it is capturing a previously updated course. Alter-natively, a direct interface to the autopilot could be implemented. For the current design, the simple autoland/FMS interface is deemed sufficient. For subsequent iterations, perfor-mance enhancements can be achieved by modifying the autoland/FMS interface if considered
necessary.
2.1.6
Trajectory Planning using Energy Management
In order to determine the number and length of loops the aircraft follows in the holding pattern and to determine the length of the traffic pattern after the aircraft has exited the holding pattern, autoland requires knowledge of:
1. The amount of energy available to dissipate normalized by the aircraft weight ∆E/W . 2. The rate of energy dissipation with ground distance travelled.
The aircraft energy at any point in time is defined as the sum of kinetic and potential energy.
E = mgh +1
2mV
2 (2.2)
By normalizing the energy, E, by the aircraft weight, W , no knowledge of the exact aircraft mass is required to compute the numerical value of E/W .
E/W = h + V
2
2g (2.3)
Furthermore, the normalization by weight results in E/W being expressed in units of altitude, which allows ”energy” to be replaced by ”altitude” whenever the airspeed does not change. The amount of energy available to dissipate, ∆E/W , is simply the difference between the
current energy, E/W , and the desired energy at touchdown, Etd/W .
∆E/W = E/W − Etd/W = (h0+ V2 0 2g)− (htd+ V2 td 2g) (2.4)
where h0 and V0 denote the current altitude and airspeed respectively, while htd and Vtd
denote the touchdown zone elevation and desired airspeed at touchdown respectively.
which is 90 kt for the Cirrus SR-22. In order to reduce the descent rate before touchdown,
autoland performs a flare maneuver that causes the airspeed to reduce from Vbg =90 kt
to Vtd =75 kt. Hence, if V0 = Vbg, the energy available to dissipate simply becomes the
difference between the altitude of the current location and the altitude of the touchdown zone, plus the difference in kinetic energy resulting from reducing the airspeed from 90 kt to 75 kt, which is equivalent to an additional 100 ft of altitude.
The rate of energy dissipation with ground distance travelled, R, can be derived by differentiating equation 2.3 with respect to R and setting the airspeed, V , equal to the
constant best glide speed, Vbg. This is justified even though the airspeed is changing from
Vbg to Vtdduring the flare phase, since the flare is an out-of-trim maneuver, where the reduced
altitude loss is compensated for by a reduction in airspeed. The total loss of energy over ground distance travelled during the flare maneuver, however, is the same as during the gliding approach phase. The energy dissipation rate with ground distance travelled can be written as: d dR(E/W ) = dh dR = 1 L/D (2.5)
Due to the trajectory being planned for constant airspeed, the rate of change of energy normalized by weight is only dependent on the rate of altitude lost over ground distance travelled. This value is known as the aircraft’s L/D or glide ratio. It is directly related to
the flight path angle γ by the relation: tan γ = 1
L/D. Here, it is assumed that the glide ratio
and flight path angle are referenced to the inertial frame. If no wind is present, the glide ratio of the aircraft as measured with respect to the airmass and as measured with respect to the ground is equal. If wind is present, the aircraft travels a different distance over ground than it travels through the airmass. The convention adopted here, is that the ”glide ratio through the airmass” is adjusted for wind effects so that glide ratio always refers to the ratio of altitude lost, over ground distance travelled.
From knowledge of the wind speed and direction at the selected landing site, the course of the downwind leg, base leg and final leg, as well as the nominal bank angle during turns, autoland calculates the expected glide ratio on each segment of the holding pattern and the
traffic pattern. The segments of the holding pattern are: Turn to outbound leg, outbound leg, turn to inbound leg and inbound leg. The segments of the traffic pattern are: Downwind leg, Turn 1, Base leg, Turn 2 and Final leg, where Turn 1 represents the turn from the downwind leg to the base leg and Turn 2 represents the turn from base leg to final leg. The location of each leg is illustrated in Figure 2-7. The expected glide ratios on each of the traffic pattern
inbound leg
outbound leg
turn to outbound leg turn to inbound leg
downwind leg
base leg final leg
turn 2
turn 1
Figure 2-7: Naming convention for holding pattern legs and traffic pattern legs
segments are referred to by L/Dd, L/Dt1, L/Db, L/Dt2 and L/Df in this order. The energy
dissipated on the base leg segment for example becomes:
∆Eb/W =
1
L/Db · L
B (2.6)
where LBdenotes the length of the base leg segment. The energy dissipated on the remaining
segments can be calculated in a similar manner. Assuming constant glide ratio along each individual segment, energy dissipation along each segment is linear with ground distance travelled.
The complete ”energy vs. range-to-go until the planned touchdown point” curve for the rectangular traffic pattern therefore becomes a piecewise linear, continuous function as shown in Figure 2-8. The currently available energy E/W at the current range to go until the target
touchdown point, R, is shown on the right hand side of the the figure. The desired energy
at touchdown, Etd/W , with zero range to go, is shown on the left hand side. The required
length of the traffic pattern is found from matching the length of the downwind leg, base
leg and final leg to the energy available to dissipate, ∆E/W = E/W − Etd/W . The length
of the turn segments are a result of the choice of the traffic pattern shape and length of the pattern legs and cannot be chosen freely for energy matching.
In the holding pattern, the length of the pattern is adjusted to match the energy
27 Energy on touchdown, E_td/W Energy currently available, E/W Current position: On final leg
Length of base leg, L_B
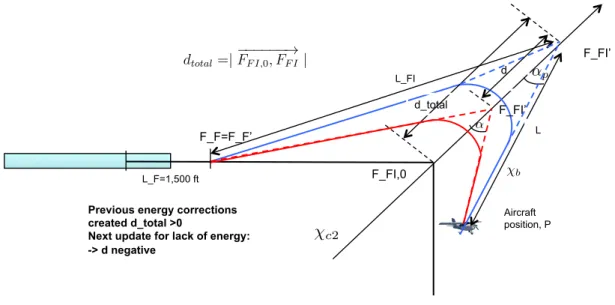
Vv,cmd= (Vv,0− 3.3) · (1 − e−t) + 3.3 (20) Vv,0= V · tan(γ) (21) γ = arcsin(L/D) (22) R = 0.77·h− htd L/D (23) Etd/W = htd+ V2 td 2g (24) E/W = h +V 2 2g (25) χc2 χc1 αp= 15◦ αp= 45◦ αp= 75◦ dtotal=|−−→FB,0,−→FB| (26)
2
Design Concept
-Engine on guidance to Initial Point -Engine off approach from Initial Point -Use standard traffic pattern -Use Holding pattern -Use trajectory updating for energy management
3
Functional requirements
The autoland function is designed to allow an aircraft to semi-autonomously (with the pilot following simple throttle commands) perform an emergency landing from any point of initiation at altitude. For this purpose, autoland needs to employ several functions.
1. Select destination
2. Guide the aircraft to an initial point on the standard traffic pattern at the selected destination 3. Hold the aircraft on a holding pattern by the initial point until the aircraft’s energy has reduced to
within a band of energy required to commence the standard traffic pattern
4. Guide the aircraft along the traffic pattern while updating the traffic pattern length as the aircraft’s energy deviates from the expected energy
5. Perform a flare maneuver as the aircraft reaches the flare altitude above the landing site 6. Capability to absorb errors in wind measurements and uncertainty in wind profile with altitude 7. Capability to absorb errors in L/D0 estimation
Vv,cmd= (Vv,0− 3.3) · (1 − e−t) + 3.3 (20) Vv,0= V· tan(γ) (21) γ = arcsin(L/D) (22) R = 0.77·h− htd L/D (23) Etd/W = htd+ V2 td 2g (24) E/W = h +V 2 2g (25) χc2 χc1 αp= 15◦ αp= 45◦ αp= 75◦ dtotal=|−−→FB,0,−→FB| (26) 2 Design Concept
-Engine on guidance to Initial Point -Engine off approach from Initial Point -Use standard traffic pattern -Use Holding pattern -Use trajectory updating for energy management
3 Functional requirements
The autoland function is designed to allow an aircraft to semi-autonomously (with the pilot following simple throttle commands) perform an emergency landing from any point of initiation at altitude. For this purpose, autoland needs to employ several functions.
1. Select destination
2. Guide the aircraft to an initial point on the standard traffic pattern at the selected destination 3. Hold the aircraft on a holding pattern by the initial point until the aircraft’s energy has reduced to
within a band of energy required to commence the standard traffic pattern
4. Guide the aircraft along the traffic pattern while updating the traffic pattern length as the aircraft’s energy deviates from the expected energy
5. Perform a flare maneuver as the aircraft reaches the flare altitude above the landing site 6. Capability to absorb errors in wind measurements and uncertainty in wind profile with altitude 7. Capability to absorb errors in L/D0estimation
6
Figure 2-8: Energy dissipation with ground distance travelled
difference between the current energy level E/W and the energy required to fly the traffic
pattern E/Wtp,0. E/Wtp,0 can be derived from knowledge of the length of the traffic pattern
segments and the expected glide performance on each segment:
E/Wtp,0= LD− r L/Dd + rπ 2L/Dt1 + LB− 2r L/Db + rπ 2L/Dt2 +LF − r L/Df (2.7)
The length of the holding pattern is adjusted by shortening or elongating the length of the inbound leg and outbound leg and number of loops in the pattern. Details on the adjustment
of the length of the holding pattern and traffic pattern to match energy targets are discussed in chapter 2.1.9.
2.1.7
Performance Prediction using Online Performance
Estima-tion
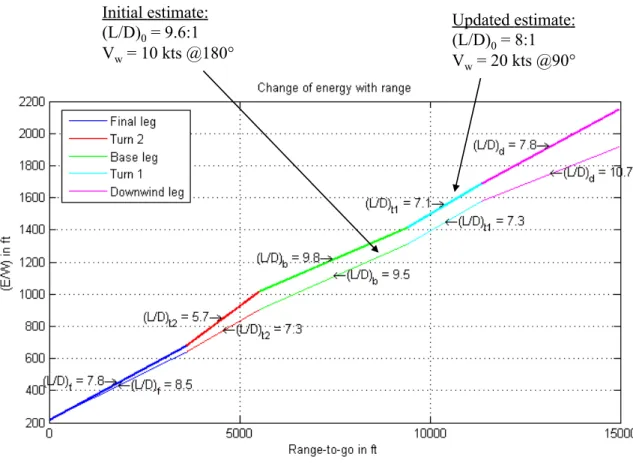
In order to determine the energy dissipation with distance over ground flown for each traffic pattern segment, autoland requires information on the expected glide ratio of the aircraft on each segment. The Cirrus SR-22 manual states that the glide ratio at best glide speed is 9.6:1 with flaps retracted, which could potentially be used as an input for performance prediction. However, there is no guarantee that the aircraft will be in a clean configuration when autoland is initiated. Furthermore, the propeller could be windmilling or be stopped, which would make a large difference in observed glide ratio. Therefore, autoland monitors the aircraft’s performance as the aircraft glides at best glide speed and uses the deduced glide ratio for performance prediction on the following traffic pattern legs. For this purpose,
autoland first determines an instantaneous glide ratio, L/Di from the change in energy,
∆E/W , and ground distance travelled, R, within one sampling interval. Autoland deduces the change in energy from the change in altitude and airspeed, and deduces the distance travelled from the change in position as shown in Figure 2-9.
This instantaneous glide ratio contains the effect of wind and any non-zero bank angle, which both modify the measured glide ratio from the glide ratio that would be observed in still air with wings level. However, this no-wind, wings-level glide ratio is required for performance prediction on subsequent legs. Hence, any wind and bank angle effects are
removed from the measured, instantaneous glide ratio, L/Di, to yield L/Di,0. The wind
effect is broken up in crosswind and tailwind effect, with the tailwind having the strongest influence on the glide ratio. A 25% tailwind results in a 25% increase in glide ratio. The crosswind effect is much smaller but still yields a change in glide ratio of 3% for a 25% crosswind. Since glide ratio estimates are expected to be accurate to within 5%, this effect