HAL Id: hal-01491023
https://hal-centralesupelec.archives-ouvertes.fr/hal-01491023
Submitted on 9 Dec 2020
HAL is a multi-disciplinary open access
archive for the deposit and dissemination of
sci-entific research documents, whether they are
pub-lished or not. The documents may come from
teaching and research institutions in France or
abroad, or from public or private research centers.
L’archive ouverte pluridisciplinaire HAL, est
destinée au dépôt et à la diffusion de documents
scientifiques de niveau recherche, publiés ou non,
émanant des établissements d’enseignement et de
recherche français ou étrangers, des laboratoires
publics ou privés.
A Statistical Study of DORT method for Locating Soft
Faults in Complex Wire Networks
Moussa Kafal, Benoît Jaume, Andréa Cozza
To cite this version:
Moussa Kafal, Benoît Jaume, Andréa Cozza. A Statistical Study of DORT method for Locating Soft
Faults in Complex Wire Networks. Compumag 2017, Seoul National University; Korean Institute of
Electrical & Engineers; Korea Institute of Information & Technology Facilities Engineering, Jun 2017,
Daejeon, South Korea. �hal-01491023�
A Statistical Study of DORT Method for Locating Soft Faults in
Complex Wire Networks
Moussa Kafal
1, Student, IEEE, Jaume Benoit
1*, and Andrea Cozza
2, Senior, IEEE
1CEA, LIST, 91120 Palaiseau, France, [email protected] 1*CEA, LIST, 91120 Palaiseau, France, [email protected]
2Group of Electrical Engineering - Paris (GeePs), CentraleSupelec, Universite Paris-Saclay, 91192 Gif-sur-Yvette CEDEX, France, [email protected]
Decomposition of the time reversal operator (DORT), a recently applied time reversal method to transmission lines, has shown to be effective in detecting and locating soft faults in complex wire networks. In this paper, we will conduct a statistical study investigating the influence of several parameters, namely the number of testing ports in addition to noise, on the performance of DORT technique after having proposed a suitable fault location criterion. Notably, this would allow a closer inspection of the method’s practicability for future implementation in real-life networks.
Index Terms—Complex wire networks, DORT method, fault location, noise, statistical study.
I. INTRODUCTION
lectrical cables are present in almost all modern systems where the transfer of energy and information is necessary to guarantee a proper functioning and a good performance of a system. Accordingly, safety issues related to faulty electrical wiring necessitated the availability of techniques capable of detecting the presence of faults that could potentially put in jeopardy a whole system. While several wire diagnosis methods have been introduced during the last few decades [1], [2], time reversal (TR) based methods originally developed in acoustics, have shown to be effectual in locating soft faults; which are minor alterations that may affect a cable, in different complex networks.
For instance, DORT [3], a computational TR method, standing for the decomposition of the time reversal operator, allows synthesizing testing signals from the analysis of the network’s TR operator (TRO) which are bound to focus on the fault’s position once injected into the ports of a network under test (NUT). In fact, the two varieties of DORT, the standard version in [4] and the enhanced one (EDORT) in [5] provided promising results in locating single as well as multiple soft faults in different complexity NUTs. It is noteworthy that the process of locating a fault by DORT was accomplished by fetching the energy peak associated to the constructive interference of the injected testing signals on the position of the fault, along a predefined path of the NUT. Although, this allowed a clear identification when dealing with simple network structures and with a sufficient number of testing ports, an increasing complexity in the interpretation is noticed when the NUT’s complexity increases and when the number of testing ports decreases. In this paper, we will propose a contrast enhancing method for a more accurate location of soft faults in complex NUTs. This will be followed by a statistical investigation studying the influence of the number of testing ports in addition to the presence of noise, on the DORT’s performance.
II. FAULT LOCATION CRITERION USING THE DORT METHOD
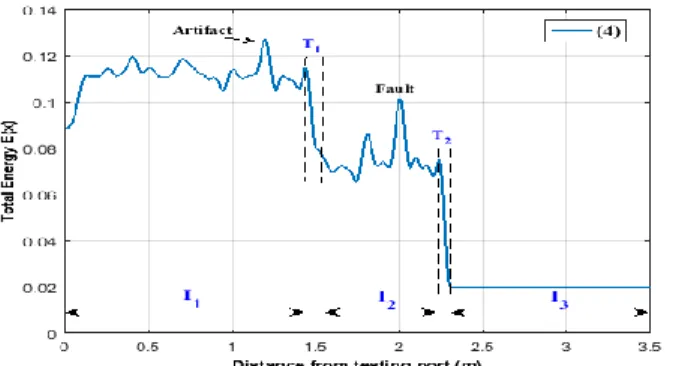
As previously stated, DORT method enables synthesizing signals focusing at the fault position, thus leading to a higher energy observed at its position. However, the guided nature of transmission lines imposes that these signals also interact with each other and with junctions present in complex networks, therefore producing constructive interferences at different points in the NUT. In fact, this situation is expected to worsen once the number of injected testing signals associated to their corresponding testing ports decreases. To better illustrate this point, let us consider the double junction (DJ) NUT of Fig. 1 assuming the presence of a single soft fault F3 at a distance 2 m from the reference testing port {1} on its 3rd branch. The energy diagram of Fig. 2 is obtained after applying DORT method with two testing ports at {1} and {3} and observed along the 3rd path (linking {1} to {3}). Notably, if we consider the absolute values of the peaks, the dominant value will be that of the peak situated at 1.2 m from {1}, and not corresponding to the fault which is situated at 2 m from {1}. But if we consider the amplitude of each peak relative to the local plateau (I1, I2 or I3), the fault’s peak will be the dominant one and its detectability becomes direct and easy. This example shows the necessity of considering the relative amplitudes of the peaks instead of the absolute ones, whence the need to calculate some kind of contrast, to be able to formalize the location process accordingly. A fault location criterion based on what preceded is derived which is based on defining each of the delimiting intervals Ii in the energy diagram of an NUT followed by calculating the plateau related to each one of them along different paths of the NUT. After that we proceed to the calculation of the contrast of the local peaks as the ratio of the amplitude of the peak to that of the corresponding plateau previously calculated. Consequently, the highest contrast peak hints at the location of the fault. For illustration purposes, we reconsidered the example of Fig. 1, where the corresponding contrast diagram for all paths as presented in Fig. 3 points out an important fact: we are able to
directly pinpoint the location of the soft fault using only two testing ports. It is situated on the third or fourth path, at a distance of 2 m from {1}.
Fig. 1. Layout a double-junction (DJ) NUT containing several soft faults on different positions.
Fig. 2. The energy diagram produced after applying DORT on the DJ NUT of Fig. 1 with two testing ports at {1} and {3} observed along the third path.
III. INFLUENCING PARAMETERS ON DORT METHOD
The previous example showed that the performance of DORT method is influenced by the number of testing ports where a detailed study could be found in [4]. In fact, a change in their number might allow or not to locate the faults in an NUT. In order to conduct a statistical study to analyze this parameter, a database containing a large number of NUTs is necessary, where the DJ NUT earlier studied serves as a good choice as it is considered to be complex compared to those usually studied in this domain (single cables in most cases). In the DJ configuration of Fig. 1, we considered three different fault positions (F1, F2 and F3). For each position, we generated a set of NUTs, where the lengths were randomly chosen. For each of these configurations, we also considered the cases of having 1, 2, 3, and 4 testing ports, where we generated a total set of 4000 different files.
After this first step of generating the database, we proceeded to analyzing the results. Thus we wrote several functions aiming to extract and analyze the desired information, based on the contrast location criterion we earlier developed. The first step is to determine the contrast for all the peaks in the NUT, based on the ideas discussed in section II, and then we choose the maximum contrast. If its spatial position corresponds to that of the fault, we consider that the fault is located, if not, the fault is not correctly located. Consequently, this will provide the rates of the number of successes (i.e., when we locate the fault for a given NUT) to the total number of analyzed NUTs. This rate will be referred to as PSR, with SR being the success rate. On the other hand, in order to have a better idea of the value of the location
probability, we proceeded to an estimation of the latter based on the Maximum Likelihood Estimation (MLE), and the estimated value of this probability is going to be referred to as PMLE.
Fig. 3. The contrast computed along the different path branches of the NUT of Fig. 1.
TABLE I
LOCATIONPROBABILITIESPMLEOFTHEFAULTSINTHENUTOFFIG.
1INTERMSOFTHENUMBEROFTESTINGPORTS.
Fault Number of Testing Ports
1 2 3 4
F1 0 0.5138 0.75 1
F2 0 0.5 0.75 1
F3 0 0.7183 1 1
In particular, table I shows that one testing port leads to a null location probability, whilst adding more testing ports increases this probability so as it converges to 1 once all the NUT’s testing ports are used. Thus, based on the DORT properties and the preliminary analysis obtained, one can expect to have a higher location probability when testing ports exist from both sides of the fault (as that of F3), and a low location probability in the opposite cases. In fact, this factor is one of many other factors that might influence the method’s performance, whence the necessity to analyze these parameters and their possible effects on the DORT performance through a similar statistical study shall be very interesting. In this event, the same statistical analysis is being investigated to study the influence of noise (Additive White Gaussian Noise (AWGN)) on the location probability for DORT method.
REFERENCES
[1] M. K. Smail, L. Pichon, M. Olivas, F. Auzanneau, and M. Lambert, “Detection of defects in wiring networks using time domain reflectome-try,” IEEE Transactions on Magnetics, vol. 46, no. 8, pp. 2998–3001, 2010.
[2] M.K. Smail, T. Hacib, L. Pichon, and F. Loete, “Detection and location of defects in wiring networks using time-domain reflectometry and neu-ral networks,” IEEE Transactions on Magnetics, vol. 47, no. 5, pp. 1502– 1505, 2011.
[3] C. Prada and M. Fink, “Eigenmodes of the time reversal operator: A solution to selective focusing in multiple-target media,” Wave motion, vol. 20, no. 2, pp. 151–163, 1994.
[4] L. Abboud, A. Cozza, and L. Pichon, “A noniterative method for locat-ing soft faults in complex wire networks,” Vehicular Technology, IEEE Transactions on, vol. 62, no. 3, pp. 1010–1019, 2013.
[5] M. Kafal, A. Cozza, and L. Pichon, “Locating multiple soft faults in wire networks using an alternative dort implementation,” Instrumentation and Measurement, IEEE Transactions on, vol. 65, no. 2, pp. 399–406, 2016.