First International Conference on Bio-based Building Materials June 22nd - 24th 2015
Clermont-Ferrand, France
INFLUENCE OF CELLULOSE PULP FIBER ADDITION ON THE HYDRATION OF
CEMENTITIOUS PASTES WITH SILICA FUME
I. S. Siqueira1*, R. D. Toledo Filho1, E. A. B. Koenders1,2
1
COPPE Institute/ Civil Engineering Program, Federal University of Rio de Janeiro (UFRJ), Rio de Janeiro, Brazil
2 Institute for Constructions and Building Materials, Technical University Darmstadt, Darmstadt, Germany
*Corresponding author; e-mail: iolanda@coc.ufrj.br
Abstract
The use of natural fibers in cementitious materials can provide multiple benefits on both the issue of reducing the environmental impact and the mechanical behavior, while enhancing the toughness and post-cracking resistance. However, to be able to use these materials in various areas of engineering it is necessary to better understand its behavior in the fresh, hardening and hardened state. The present study aimed at investigating the influence of cellulose fibers (eucalyptus and pine) on the hydration of cement pastes containing silica fume. For this goal, composites were produced with volumetric fiber fractions of 0, 0.25, 0.50 and 1.0%. The matrix was composed of cement, silica fume, silica sand, water and superplasticizer. The ratio of materials was 1: 1: 0.55 (cementitious blend: silica sand: water/cementitious blend). The ratio of the cement blend was: 0.65 :0.35 (cement :silica fume). Hydration was studied from tests using ultrasonic pulse velocity, adiabatic calorimetry, electrical conductivity, isothermal calorimetry. The evolution of the compressive strength with time for the mixtures under consideration was determined until the age of 180 days. From the results, it was observed that the dormant stage period was not affected by the presence of pulps, but once commenced, a retardation of the hydration reactions occured. Furthermore, an inclination in the rate of hydration during the acceleration period developed that could be associated with the kinetics and the formation of various hydration products, including pozzolanic C-S-H. Through adiabatic calorimetry tests, it was concluded that pine fibers cause a larger reduction in total heat release than eucalyptus fibers. This is due to the fact that pine fibers contain more hemicellulose, lignin and extractives than eucalyptus fibers. Finally, comparing non-destructive testing results with the compressive strength results, a reduction in the ultimate strength (after 180 days) appeared, which is in agreement with the lower formation of hydrated products indicated by the adiabatic and isothermal tests.
Keywords:
Hydration reactions; Cellulose fibers; Ultrasonic pulse; Adiabatic calorimetry; electrical conductivity; isothermal calorimetry
1 INTRODUCTION
The use of natural fibers has several advantages, such as its abundance availability, low cost and energy consumption to manufacture them, and, moreover, a renewable resource. Furthermore, composites with natural fibers may have similar mechanical behavior as composites made with artificial fibers, like toughness and post-cracking resistance. However, these new class of natural materials also show differences in hydrational performance. It is therefore necessary to characterize these materials that allow them to be a serious alternatives to synthetic fibers in various areas of engineering.
One of the problems that occurred when using natural fibers in cementitious composites is the durability of
the system. In normal systems, a cementitious matrix is characterized as an alkaline medium induced by the hydration reactions in the hardening process. This can become a problem whenever using natural fibers as a reinforcement. In a cementitious matrix, hydration products (mainly calcium hydroxide) migrates to the lumen (inner cavity characteristic of natural fibers) causing a mineralization of the fiber surfaces. This mineralization process decreases the durability of the cementitious fiber composite as well as the alkalininity attack and change in fiber volume due to its high water absorption [Toledo Filho 2000; Silva 2010; Ardanuy 2011]. One of the preventative actions to overcome this problem is using pozzolans that reduce the amount of calcium hydroxide present in the matrix [Toledo Filho 2003; Mohr 2007]. It’s a very promising technique to reduce the active content of calcium
hydroxide in matrices. Many different pozzolans may be used for this purpose, for example, fly ash, silica fume or metakaolin. However, the pozzolan used in this study was silica fume.
Another important issue that should be considered when working with cementitious composites of cellulose fibers (ie, natural fibers) is the compatibility between the fibers and the matrix. Natural fibers are composed of organic compounds such as, for example, polysaccharides, and these substances may affect the rate of hydration reactions, i.e. change the rate of the cement hydration process. Depending on the chemical composition and quantity of fibers used, this effect may lead to an acceleration or retardation. For fibers such as sisal, coir, jute, sugar cane bagasse, a clear delay in the hydration reactions was observed [Aggarwal 1990; Bilba 2003; Chakraborty 2013]. For cellulose fibers two different effects were observed [Ardanuy 2011; Hoyos 2013]. Ardanuy [2011] analyzed the effect of bamboo fibers (size less than 0.2 mm), kraft pinus unbleached and cotton finders on the
hydration of the cementitious matrix. Results showed a decreased total heat released due to the use of bamboo fibers. Contrarily, for the cellulose fibers, both
pinus as cotton, this total heat release increased by
around 10%. According to the authors, these changes in hydration depend on the nature and purity of the fibers. Pereira [2003] also observed that not only the compound classified as extractives could affect hydration. The authors proposed that it would be hemicellulose in the fibers of the present compounds that significantly affects the hydration of the cement grains. Hoyos [2013] conducted semi-adiabatic tests for mixtures containing crystalline cellulose microfibers and calculated an overall coefficient of heat transfer to achieve the adiabatic temperature rise curves. The fiber percentages used were 0, 1, 2 and 3% by mass of cement. It was observed that the addition of these fibers significantly reduced the total adiabatic tempersture elevation. The present study aimed at investigating the influence of cellulose fibers (eucalyptus and pinus) on the hydration of cement
pastes containing silica fume. To this end, the mixtures were subjected to the following tests: adiabatic calorimetry; isothermal calorimetry; electrical conductivity; ultrasonic pulse velocity; and compressive strength.
2 MATERIALS 2.1 Cementitious Matrix
The following materials were used for the production of composite matrix: class G Portland cement; silica fume; silica sand; superplasticizer of a third generation carboxylic ether based (Glenium 51) and deionized water. The cement used in this study was the Class G Portland cement. The chemical composition of this cement is presented in Tab. 1. The chemical composition showed that the cement is mainly composed of calcium oxide (63.5%) and silicon dioxide (20.9%).
The other cementitious material utilized was silica fume. The silica fume used had a silicon dioxide (SiO2)
content of 95.4%, and an average particle diameter of 0.4 µm. Finally, one fine fraction of aggregates was also changed and replaced by silica sand. It’s average particle diameter is 130 µm.
Tab. 1: The chemical composition of class G Portland cement. Oxides Fraction in (%) Loss on ignition 1.43 SiO2 20.9 Al2O3 4.32 Fe2O3 5.05 CaO 63.5 MgO 1.60 SO3 2.29 Na2O 0.26 K2O 0.65 2.2 Fibers
Two types of cellulose fibers were selected for this study: bleached kraft eucalyptus fibers and unbleached kraft pinus fibers. The eucalyptus fibers had a fiber length of 0.8 mm. The water content in the eucalyptus fibers at ambient conditions was 8.8% - data obtained following the [ASTM C642 – 97]. The pine fibers were taken from the species Pinus Radiata. Length of the
fibers was 4 mm and the water content in the fibers at ambient conditions was 8.3% [ASTM C642 – 97]. The chemical analysis of the eucalyptus and pinus
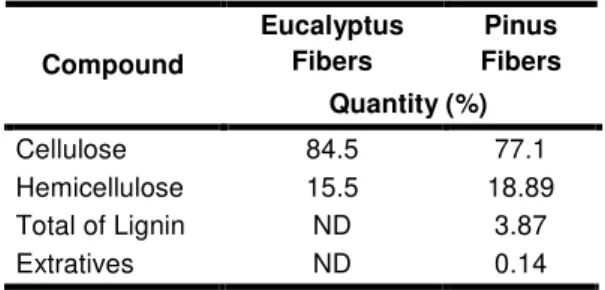
fibers were carried out and the results are shown in Tab. 2. It can be observed that the main components in both fiber types are cellulose and hemicellulose. However, the pinus fibers showed more hemicellulose, lignin and extratitives than the eucalyptus one. Conifers in general have a higher amount of lignin and hemicellulose than hardwood fibers [Beltran 2011]. For eucalyptus, no lignin was expected, since the fibers had passed a chemical pulping process, and were bleached too. On the other hand, the pinus fibers, being non-bleached, showed contents of lignin and extractives.
Tab. 2: Chemical composition of used cellulose fibers.
Compound Eucalyptus Fibers Pinus Fibers Quantity (%) Cellulose 84.5 77.1 Hemicellulose 15.5 18.89 Total of Lignin ND 3.87 Extratives ND 0.14 Fig 1 and 2 show the eucalyptus and pinus fibers
viewed through a SEM with a zoom of 60. They also show micro-images of cross sections and morphologies of both fibers (upper left corner). The images were obtained by a scanning electron microscope type JSM-6460 LV JEOL®. The mean value obtained for the equivalent diameter of the eucalyptus fibers was 9 ± 2 µm and for the pinus fibers
20 ± 3 µm. Both fibers show a hollow tubular shape with inner cavity, i.e. with lumen, a typical characteristic of vegetal fibers, oval cross-section and a thick wall.
Fig. 1: SEM images of eucalyptus fibers (in detail: cross section of a single fiber).
Fig. 26: SEM images of pinus fibers (in detail: cross section of a single fiber).
3 METHODS
3.1 Cement composites
The mix design used in this study was 1: 1: 0.55 (cementitious blend: silica sand: water/cementitious blend). The ratio of the cement blend was: 0.65 :0.35 (cement :silica fume). Volume fraction of the fibers used was 0.25, 0.50 and 1.0%; composites were named by its fiber content and type of fiber (EU for eucalyptus and PI for pinus). For all mixtures the content of superplasticizer (SP) was the same in order to avoid interferences in the hydration reactions. The value was determined by the saturation point and was taken 0.3% of the cementitious blended mass.
The kraft eucalyptus fibers were dispersed in an ultrasonic disperser before mixing. For similar reasons, the pinus fibers were dispersed too but this was done mechanically. The dispersion and mixing procedure are described in [Siqueira 2014].
For the compressive strength tests, cylindrical samples were cast (50 mm in diameter and 100 mm of height). Samples were cured at a temperature of 21±1 °C and a relative humidity of 100% until one day before testing. On this last day, the top and bottom of the samples were leveled using a lathe. This was done to avoid stress concentration.
3.2 Ultrassonic pulse velocity test (UPV)
Using a non-destructive ultrasonic pulse velocity method, it was possible to determine the percolation threshold and rate of hydration of the mixtures studied. Tests were performed at 23 °C and at atmospheric pressure up to 7 days of age. A Chandler Ultrasonic Cement Analiser (UCA) model 4262 was used for the tests and the procedures to perform the tests were
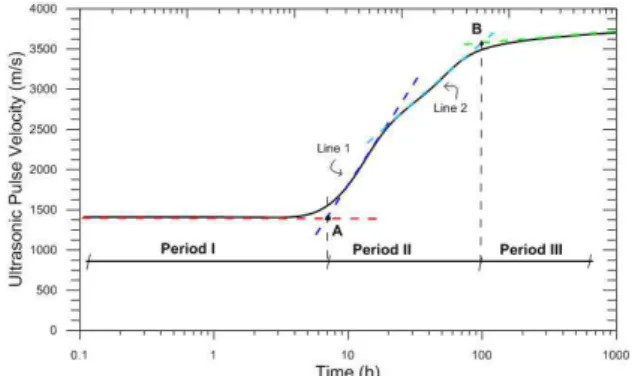
according to [Campos 2005]. Fig. 3 shows the three stages of hydration measured from the ultrasonic pulse velocity curves identified as: period I, period II and period III,. Determination of the percolation threshold and the stabilization plateau for the hydration reactions of mixtures were obtained according to [Rocha 2015].
Fig.3: Typical ultrasonic pulse velocity versus curing time curve (Modified from [Rocha 2015]).
3.3 Adiabatic test
Tests were performed using adiabatic calorimeters with an accuracy of 0.1°C. However, the limit temperature that the bath can reach is a little below 100 °C, since water will boil at this temperature. The starting temperature of all tests was 8.8 ± 0.7° C. This temperature was taken because of the high amount of heat released by the pastes during hydration. Sample reached a temperature rise of about 90° C, and in this way adiabatic curves could be obtained. The volume of the samples used was approximately 1.6 liters and tests were performed until the temperature in the specimens had stabilized. The characteristic parameters for heat increase under adiabatic conditions (Ead) are given by (1) and the
coefficient of adiabatic elevation (Ca) is given by (2).
i T f T ad E = − (1) c C ad E a C = (2) where:
Tf is the final temperature of the test;
Ti is the initial temperature of the sample;
Cc is the content of cementitious material.
3.4 Electrical conductivity test
Electrical conductivity tests were carried out by measuring the conductivity and temperature from a cylindrical sample with dimensions of 100 mm diameter and 200 mm in height over time with the ConSensor 2.0 equipment. During testing, the data box records the temperature and conductivity, through a sensor that was inducing the sample to an electrical conductivity field with a frequency of 20 MHz. The sensor was positioned in the center of the sample. The curing temperature was 23°C and the test period was 7 days.
Fig. 4 shows a typical electrical conductivity versus time curve. In the initial period, the value of conductivity increases slightly which corresponds to its first peak (1) after around one hour of testing. After this first peak (1), the conductivity starts to drop gradually. As the chemical reactions take place, hydration products begin to bind the free water which causes the conductivity to decrease accordingly [Beek 2000].
Fig.4: Typical curve of the electrical conductivity versus time (modified from [Abo el-enein 1995]).
Up to about 7-8 hours, the conductivity varies only a little. This period corresponds to the induction period. At the end of this period, a shoulder appears in the curve (see point 2 in Fig. 4) indicating the start of the acceleration period [Abo el-enein 1995].
3.5 Isothermal calorimetry test
Isothermal calorimetry tests were performed using a calorimeter TAM Air (TA Instruments). The starting temperature of the tests was 23 °C. Fig. 5 presents a typical curve obtained from isothermal calorimetry testing of cement slurry containing only Portland cement - Class G. According to [Odler 1998], the hydration process is characterized by four main stages which are intrinsically associated with the heat release in the mixture. They are: (I) pre-induction period; (II) induction period or numbness; (III) acceleration period; and (iv) period after the acceleration or deceleration.
Fig. 5: Evolution of hydration heat of a CPP class G.cement.
3.6 Compressive strength test
Hydration of the mixtures was also studied using data obtained from uniaxial compression tests. These tests were performed on Shimadzu equipment with a load cell capacity of 1000 kN and using cylindrical samples of 50 mm in diameter and 100 mm in height. The test velocity was 0.3 mm/min. The ages of testing were after 1, 2, 3, 4, 6, 7, 28, 90 and 180 days of hardening. 4 ANALYSIS OF RESULTS
4.1 Ultrasonic pulse velocity
Fig. 6 shows the ultrasonic pulse velocity curves versus time on a logarithmic scale for the mixtures under consideration. The mixtures were cured at a temperature of 23°C and at atmospheric pressure. Tab. 3 shows the values of in time corresponding to point A and inclinations of the lines 1 and 2 (shown in Fig. 6). Each displayed value refers only to the results of one test measured from one mixture.
(a)
(b)
Fig. 6: Curves ultrasonic pulse velocity versus cure time on a logarithmic scale: (a) mixtures containing eucalyptus fibers and (b) mixtures containing pinus
fibers.
Tab. 3: Point A and the slope of the obtained lines during the linear regression in the region II of the
hydration reactions. Mixtures Point A (min) Slope Line 1 Line 2 REF 205 1714.00 964.51 EU 0.25% 197 1641.00 979.94 EU 0.50% 224 1677.00 980.48 EU 1.0% 198 1717.00 939.94 PI 0.25% 230 1753.00 1030.00 PI 0.50% 227 1831.00 1060.00 PI 1.0% 190 1523.00 853.12 Considering these results, it can be seen that the presence of eucalyptus and pinus pulps did not alter
the time corresponding to point A, identified as the percolation threshold. For example, for the ref matrix this time was 205 min while for the mixtures containing pulp this value ranged 190-230 min. Note that the velocity of the ultrasonic pulse remained constant until this time. After point A, region II commenced (acceleration), which shows a dual slope. Up to about 15 hours, already in the region II, slope 1 is larger than slope 2 for all mixtures studied. The reference mixture slope was 1714.0, while for mixtures containing pulps the slope varied from 1641.0 to 1831.0 (except for PI 1.0% mixture that was 1523). After 15 hours, a reduction in slope was observed for the curve characterized by line 2. This dual slope observation can be related to the kinetics of the various hydration products formation, including pozzolanic CSH.
As the test period was taken seven days, region III (post-acceleration) could only be measured partly. However, observing the end of the curves at region II (after 80h testing) and the beginning of region III, it can be observed that the intensity of the ultrasonic pulse velocity decreases with increasing content of pulp. It could be noted that pulps tend to reduce somewhat the maximum velocity of the ultrasonic pulse.
4.2 Electrical conductivity
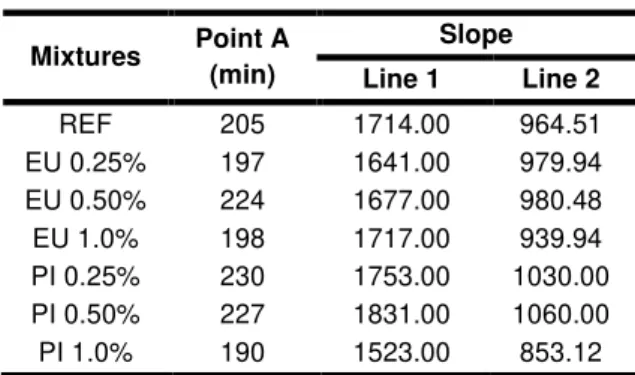
Fig. 7 shows the conductivity versus time curves for the mixtures: REF, EU 0.25%, EU 0.50% EU 1.0% and PI 1.0%. Measurements were initialized 15 minutes after contact of cement with water. The small increase observed in the conductivity curves until 0.1 days (Point 1) and the shoulder corresponding the start of the acceleration period (Point 2) were measured and are shown in Tab. 4.
(a)
(b)
Fig. 7: Conductivity versus time : (a) mixtures containing eucalyptus fibers and (b) mixtures
containing pinus fibers.
Tab. 4: Time for Point 1 and Point 2 for mixtures under study.
Mixtures Point 1 (h) Point 2 (h)
REF 0.7 6.6
EU 0.25% 0.7 7.1 EU 0.50% 0.7 7.1 EU 1.0% 0.7 7.8 PI 1.0% 0.8 7.3
Results indicate that the time until point 1 ranged from 0,7-0,8h and was not affected by the presence of pine and eucalyptus pulp in the volume fractions used. However, the pulps did affect the time corresponding to the start of the induction period. For example, for a pulp content of 1%, the time to point 2 was 7,3-7,8h
while for the reference matrix this time period was 6,6h. This indicated that the hydration reactions started more slowly for the fibrous mixtures, i.e. a delay occurs in the presence of pulps. Observing the slope of the curves corresponding to the acceleration period (after point 2), the dual slope characteristic already observed in the ultrasonic pulse velocity curves did also appear. The conductivity of the pulp mixtures is slightly bigger than the reference mixture in the corresponding period for both the accelerate and post-acceleration stage. This increase may be related to two factors. The first is that the conductivity increase indicates that there is less chemically bound water and thus less hydration products were formed. The second factor is that the conductivity is also depending on the interconnectivity of the pore network that is built up internally and, therefore, due to presence of porous fibers, the permeablility of this network increased the conductivity. Fig. 8 shows the relationship between the degree of hydration calculated from the results achieved from the conductivity tests and from the ultrasonic pulse velocity tests (ξcond and ξvel, respectively). The two tests were
performed under the same conditions (23 °C) and the degree of hydration was calculated for the longest possible duration of the data obtained from the tests, which was only up to seven days, and, therefore, does not represent the maximum degree of hydration (ξ(∞)).
From Fig. 8, it can be observed that there is a good correlation between the results obtained by the two different techniques. After the induction period, the hydration reactions take place and the ultrasonic pulse propagates preferably through the hydration products while during the same period, the conductivity represents the amount still available amount of water. The measurements that are "opposite" (one value increases, the other decreases), proved to be very consistent and showed good correlation when transformed into degree of hydration.
Fig. 8: Relationship between electrical conductivity and ultrasonic pulse velocity.
4.3 Adiabatic calorimetry
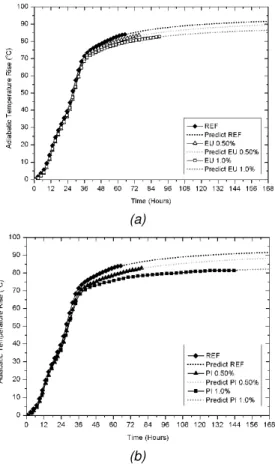
Fig. 9 shows the typical curves for the evolution of temperature of the mixtures, EU 0.50%, EU 1.0%, PI 0.50% and PI 1.0% under adiabatic conditions. The initial temperature of the mixtures was 8.8 ± 0.7 °C. Although it would be possible to conduct the test until the temperature limit of100 °C, it turned out that it was difficult to control temperatures above about 93 °C, and therefore, tests were finished when this temperature was reached. Thus, the maximum possible temperature rise of the equipment was about
83-85 °C. Because of this limitation the experimental curves were extrapolated mathematically to obtain the maximum temperature after 7 days. Fig. 9 shows the parts of the curves that were extrapolated as dotted lines. The R² coefficients for the extrapolated curves ranged from 0.997 to 0.999. The experimental data used for the extrapolation were the points until 30 hours of testing. Results and coefficients of the adiabatic rise are summarized in Tab. 5. Values of the adiabatic rise were the calculated from the limits calculated with the extrapolation functions.
(a)
(b)
Fig. 7:Adiabatic curves: (a) mixtures containing eucalyptus fibers and (b) mixtures containing pinus
fibers.
From the experimental data presented, it’s noticed that up to about 9 hour of testing the mixtures showed a period of low heat release (induction period), and from there, an increase intensity of heat release was observed (acceleration period). Also in these tests the double slope characteristic during the acceleration period appeared. In Fig. 9 the change in slope can be seen after 20 to 25 hours of testing. This behavior may be related to a change in the hydration kinetics, as has also been observed in Fig. 6 and 7. After 40 hours of testing, after the acceleration period, the reaction activity reduced.
From the adiabatic temperature curves, it was observed that the heat release of the fibrous mixtures was slower than the reference, and differences between the curves became more pronounced after 24 hours testing. For example, the temperature of the REF rose up to 58.2 °C in 30 hours, whereas the mixtures EU 0.50% and EU 1.0% needed 31.1 and 31.4 hours respectively, to achieve this temperature rise, i.e., a delay occurred with increasing fiber content. PI 0.50% and PI 1.0% reached the adiabatic rise of 58.2 °C only after 32.0 and 31.4 hours, respectively.
Tab. 5: Results of the adiabatic temperature rise tests.
Mixture Characteristics Adiabatic temperature rise (°C) Coefficient of adiabatic rise (°C.m³/kg) REF 95.96 0.12 EU 0.50% 94.70 0.12 EU 1.0% 90.86 0.12 PI 0.50% 93.59 0.12 PI 1.0% 85.27 0.11
After 40 hours of testing, a clear separation was observed in the direction of the curves and it turned out that the addition of pulps lead to a reduction in the maximum adiabatic temperature. Based on the extrapolated values in Tab. 5, the addition of pulp showed a reduction of the maximum adiabatic rise of 1.3 °C and 5.1 °C for the mixtures EU 0.50% and EU 1.0%, and 2.4 °C and 10.7 °C for the mixtures PI 0.50% and PI 1.0%. A reduction in adiabatic temperature rise of about 0.5 °C (for mixtures with 0.50% pulp) and 1 °C (for mixtures with 1.0% pulp) was expected, because of the reduction in paste/m³ volume when fibers are added to the mixture. But as the decrease was larger, it could be concluded that the fibrous mixtures form a slightly smaller volume of hydrated products. The coefficients of the adiabatic rise ranged from 0.011 to 0.012 °C.m³/kg of cementitious material (cement + silica fume).
Whenever comparing the results for mixtures with the same fiber content but different types of fiber, it is observed that the pinus fibers caused a larger
decrease in the total heat released compared to eucalyptus fibers. This is due to the fact that pine fibers contain more hemicellulose, lignin and extractives than eucalyptus fibers.
4.4 Isothermal calorimetry
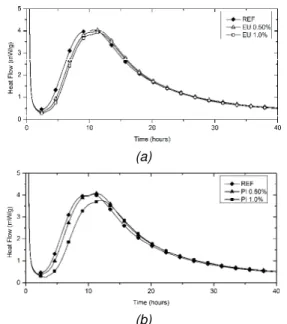
Fig. 10 shows heat flow curves obtained from isothermal calorimetry tests at 23 °C for mixtures reinforced with 0.50% and 1.0% of eucalyptus and
pinus fibers, and for the reference mixture containing
no fibers at all. From Fig. 10, it is observed that during the pre-induction period, both the eucalyptus and pinus
fibers didn’t change the behavior of the mixture. However, the addition of fibers caused a small increase of the dormant stage period resulting in an enhanced duration at which the main peak evolved (number 3 in Fig. 5). During the acceleration stage, the slopes of the curves are practically the same for all mixtures, indicating that the period of acceleration has shifted in time because of the use of fibers. Finally, during the period of deceleration, the curves of fibrous mixtures, containing both eucalyptus as pinus, are
approaching the reference mixture. This means that the fiber addition mainly caused a slight delay in the hydration reactions only in the first few hours.
Fig. 11 presents the accumulated heat curves versus time for the REF and the fibrous mixtures. Note that those mixtures containing 0.5% of fibers showed a marginal increase in the total heat evolution after 120 hours of testing when compared to the reference. However, mixtures containing 1.0% fibers showed a substantial reduction of the total heat evolution, viz. 4.5% for EU 1.0% and 7.0% for PI 1.0%. It’s worth mentioning that again a reduction was expected (as explained in section 4.3), but the magnitude of the expected reduction was much smaller. This indicates
that the investigated fibers decrease the formation of hydrated products significantly.
(a)
(b)
Fig.10: Heat flow curves for isothermal tests in the first 40 hours : (a) mixtures containing eucalyptus fibers
and (b) mixtures containing pinus fibers.
When comparing the results of the mixtures containing 1.0% of different types of fibers, it is observed that the
pinus fibers caused a more significant delay than the
eucalyptus fibers. This is due to fact that pinus fibers
contain more hemicellulose, lignin and extractives than eucalyptus fibers. These results agree with those obtained from adiabatic tests. Similar to those, the current results also show a delay in hydration reactions and this effect is more pronounced for pinus fibers.
Fig.11: Accumulated heat flow curves for REF, EU 0.50%, EU 1.0%, PI 0.50% and PI 1.0%.
The delayed hydration effect is also reported in literature [Carvalho 2008; Hojos 2013] for other species of natural fibers such as sisal, coconut [Aggarwal 1990] and jute [Chakraborty 2013]. In these studies, it is confirmed that this delayed hydration effect is caused by the fiber components sugars, lignin, etc., since it is known that the addition of such components in cementitious materials also causes similar retarding behavior [Juenger 2002; Bishop 2006]. However, the exact mechanism how these components affect the hydration, is still unknown. It is assumed that it is caused by the formation of a barrier layer around the partially hydrated cement grains. 4.5 Evolution of Compressive Strength
The evolution of compressive strength with time for the mixtures under consideration is shown in Fig. 12. The results show that, relative to the reference mixture, the presence of pulp reduces the compressive strength
and this effect was more significant for mixtures with 1% of pulp. The reduction of the ultimate strength (180 days) is in line with the lowest formation of hydrated products indicated by the isothermal and adiabatic tests.
However, it is important to highlight the fact that the reduction in strength (eucalyptus pulp mixtures showed a reduction of about 16%) is slightly higher than that observed in heat release. This may be related to issues such as a reduction in workability of the mixtures which could have caused a higher porosity in the samples (physical effect) as well as the actual increase of the intrinsic porosity due to the addition of (cellulose) fibers, which show a porous morphology.
(a)
(b)
Fig. 12: Development of compressive strength of: (a) mixtures containing eucalyptus fibers and (b) mixtures
containing pinus fibers.
5 CONCLUSIONS
From the results of the ultrasonic pulse velocity, it was observed that the presence of eucalyptus and pinus
pulp did not alter the time corresponding to the percolation threshold. The same was observed for the electrical conductivity tests. Thereafter, it was found that the presence of pulp reduces the rate of hydration. The conductivity of the fibrous mixtures were slightly larger than the conductivity of the reference mixture in the corresponding period of acceleration and post-acceleration. This increase may be related to two factors. First is that the conductivity increase indicates that there is less chemically bound water in the system and thus more conductive free water. The second factor is that the conductivity is also dependent on the connectivity of the pore structure. Due to the presence of porous fibers, the permeability of this network, leading to an increased conductivity.
Regarding the relationship between the conductivity and the pulse velocity, it turned out that after the
induction period, a good correlation was observed whenever transforming it into the degree of hydration. From the adiabatic temperature rise, it appeared that the hydration reactions are hampered by the presence of fibers. Among mixtures with the same fiber content but different kinds of fibers, it was found that mixtures containing pinus fibers had a lower elevation.
Results obtained from isothermal calorimetry and compressive strength correspond to those obtained from adiabatic calorimetry tests. However, the addition of fibers caused a small increase in the dormant stage period and an enhanced time for the main peak to occur. The total heat release was also reduced by the addition of fibers, and this effect was most pronounced for composites containing pinus fibers.
In all tests done, it was observed that pinus fibers
cause a more significant effect in delay than the
eucalyptus fibers. This is because of the fact that pine fibers contain more hemicellulose, lignin and extractives than eucalyptus fibers.
With respect to the hydration kinetics, it was observed that the dual slope characteristic evolved during the acceleration period of the adiabatic, conductivity and ultrasonic pulse velocity tests. This behavior may be related to the hydration reactions of the cement with the different compounds of the pozzolans, i.e. between silica fume and the calcium hydroxide in mixtures. 6 ACKNOWLEDGMENTS
The authors acknowledge CNPq, FAPERJ and CAPES 7 REFERENCES
[Abo el-enein 1995] Abo el-enein, S.A.; Kotkata, M.F.; Hanna, G.B.; Saad, M. et al.; Electrical conductivity of concrete containing silica fume. Cement and Concrete Research, dec 1995, 25, 8, (1615-1620).
[Aggarwal 1990] Aggarwal, L.K.; Singh, J. Effect of plant fibre extractives on properties of cement. Cement & Concrete Composites, 1990, 12, 2, (103-108). [Ardanuy 2011] Ardanuy, M.; Claramunt, J.; García-hortal, J.A.; Barra, M. Fiber-matrix interactions in cement mortar composites reinforced with cellulosic fibers. Cellulose, apr 2011, 18, 2, (281-289).
[ASTM C 642-97] American Society for Testing and Materials; Standard test method for density, absorption, and voids in hardened concrete. Pennsylvania, USA: 1997.
[Beek 2000] Beek, A, Dielectric properties of young concrete: Non-destructive dielectric sensor for monitoring the strength development of young concrete. Ph.D Thesis. Deft, Holland: Deft University of Technology, 2000.
[Beltrán 2011] Beltrán, M.G.S., Ductile cement-based composites with wood fibres: Material design and experimental approach. Ph.D Thesis. Deft, Holland: Deft University of Technology, 2011.
[Bilba 2003] Bilba, K.; Arsene, M-A.; Ouensanga, A.; Sugar cane bagasse fibre reinforced cement composites. Part I. Influence of the botanical components of bagasse on the setting of bagasse/cement composite. Cement & Concrete Composites, jan 2003, 25, 1, (91-96).
[Bishop 2006] Bishop, M.; Barron, A. R.; Cement hydration inhibition with sucrose, tartaric acid, and lignosulfonate: analytical and spectroscopic study. Ind. Eng. Chem. Res., sep 2006, 45, 21, (7042-7049). [Campos 2005] Campos, G.; PROCELAB – Procedimentos e Métodos de Laboratório destinados à Cimentação de Poços Petrolíferos. Rio de Janeiro: Petrobras/ Schlumberger/ Halliburton/ BJ Services. [Carvalho 2008] Carvalho, M. A.; Calil Jr., C.; Savastano Junior, H.; Tubinoc, R. et al.; Microstructure and mechanical properties of gypsum composites reinforced with recycled cellulose pulp. Materials Research, oct-dec 2008, 11, 4, (391-397).
[Chakraborty 2013] Chakraborty, S.; Kundu, S.P.; Roy, A.; Adhikari, B. et al.; Effect of jute as fiber reinforcement controlling the hydration characteristics of cement matrix, Industrial & Engineering Chemistry Research, 2013, 52, 3, (1252-1260).
[Hoyos 2013] Hoyos, C.G.; El uso de fibras naturales de fique em sus distintos tamaños jerárquicos em la construcción. Ph.D Thesis. Buenos Aires, Argentina: University of Buenos Aires, 2013.
[Juenger 2002] Juenger, M.C.G.; Jennings, H.M.; New insights into the effects of sugar on the hydration and microstructure of cement pastes. Cement and Concrete Research, mar 2002, 32, 3, (393-399). [Mohr 2007] Mohr, B.J.; Biernacki, J.J.; Kurtis, K.E.; Supplementary cementitious materials for mitigating degradation of kraft pulp fiber-cement composites. Cement and Concrete Research, n 2007, 37, 11, (1531–1543).
[Odler 1998] Odler, I.; Hydration, Setting and Hardening of Portland Cement. In: Hewlett, P. C. (ed), 4 ed. Lea’s Chemistry of Cement and Concrete, Oxford, Inglaterra: Elsevier Inc.
[Pereira 2003] Pereira, C.; Caldeira Jorge, F.; Irle, M.A.; Ferreira, J.M.; Extrative contentes of two woods and cork of Portuguese origin and the interaction of these subtrates with cement suspensions, Forest Products Journal, oct 2003, 53, 10, 39-43.
[Rocha 2015] Rocha, C.A.A.; Efeito da pressão e temperatura de cura no comportamento de pastas para cimentação de poços de petróleo. Doctoral Thesis. Rio de Janeiro, Brazil: Federal Univervity of Rio de Janeiro, 2015.
[Silva 2010] Silva, F.A.; Toledo Filho, R.D.; Melo Filho, J.A. et al.; Physical and mechanical properties of durable sisal fiber-cement composites. Construction and Building Materials, may 2010, 24, 5, (777-785). [Siqueira 2014] Siqueira, I. S.; Influência da adição de polpas celulósicas de pinho e eucalipto na hidratação e comportamento mecânico de pastas de cimento. Master Thesis. Rio de Janeiro, Brazil: Federal Univervity of Rio de Janeiro, 2014.
[Toledo Filho 2000] Toledo Filho, R.D.; Scrivener, K.; England, G.L.; Ghavami, K.; Durability of alkali-sensitive sisal and coconut fibres in cement mortar composites. Cement & Concrete Composites, apr 2000, 22, 2, (127-143).
[Toledo Filho 2003] Toledo Filho, R.D.; Ghavami, K.; England, G.L.; Scrivener, K.; Development of vegetable fibre-mortar composites of improved durability. Cement & Concrete Composites, feb. 2003, 25, 2, (185-196).