HAL Id: hal-01512718
https://hal.sorbonne-universite.fr/hal-01512718
Submitted on 24 Apr 2017
HAL is a multi-disciplinary open access
archive for the deposit and dissemination of sci-entific research documents, whether they are pub-lished or not. The documents may come from teaching and research institutions in France or abroad, or from public or private research centers.
L’archive ouverte pluridisciplinaire HAL, est destinée au dépôt et à la diffusion de documents scientifiques de niveau recherche, publiés ou non, émanant des établissements d’enseignement et de recherche français ou étrangers, des laboratoires publics ou privés.
Reham Khalaf-Nazzal, Melissa A. Stouffer, Robert Olaso, Leila Muresan,
Audrey Roumegous, Virginie Lavilla, Wassila Carpentier, Imane Moutkine,
Sylvie Dumont, Benoit Albaud, et al.
To cite this version:
Reham Khalaf-Nazzal, Melissa A. Stouffer, Robert Olaso, Leila Muresan, Audrey Roumegous, et al.. Early born neurons are abnormally positioned in the doublecortin knockout hippocampus. Human Molecular Genetics, Oxford University Press (OUP), 2016, 26 (1), pp.90-108. �10.1093/hmg/ddw370�. �hal-01512718�
For Peer Review
Early born neurons are abnormally positioned in the doublecortin knockout
hippocampus
#Reham Khalaf-Nazzal1-3$, #Melissa A. Stouffer1-3,Robert Olaso4, Leila Muresan5-7, Audrey
Roumegous1-3, Virginie Lavilla4, Wassila Carpentier8, Imane Moutkine1-3, Sylvie Dumont9, Benoit Albaud10, Nicolas Cagnard11, Hugues Roest Crollius5-7, *Fiona Francis1-3.
1 INSERM UMR-S 839, Paris 75005;
2 Sorbonne Universités, Université Pierre et Marie Curie, Paris 75005; 3 Institut du Fer à Moulin, Paris 75005, France
4 Plateforme de Transcriptomique, Laboratoire de Recherche Translationnelle,
CEA/DSV/IG-Centre National de Genotypage, 2 rue Gaston Crémieux, 91057 Evry, France
5 Ecole Normale Supérieure, Institut de Biologie de l’ENS, IBENS, Paris, F-75005 France. 6 Inserm, U1024, Paris, F-75005 France.
7CNRS, UMR 8197, Paris, F-75005 France.
8 Plateforme post-génomique de la Pitié-Salpêtrière, Faculty of medicine, 75013, Paris.
9 Sorbonne Universités, UPMC Paris 06, UMS30 LUMIC, plateforme d'histomorphologie, St
Antoine F-75012 PARIS
10 Plateforme Affymetrix, Institut Curie, Hospital St Louis, Paris
11 Plateforme Bio-informatique Paris Descartes, Faculté de Necker, 156 rue de Vaugirard,
75730 Paris Cedex 15.
$ Current address, Central research laboratory-A, Developmental Neurosciences and Neurogenetics Group, Faculty of Medicine and Health Sciences, An-Najah National University, Nablus, Palestine
# These authors contributed equally to this work.
*Correspondance to: Fiona Francis, Institut du Fer à Moulin, 17 rue du Fer à Moulin, 75005 Paris France. Email: fiona.francis@inserm.fr
3 4 5 6 7 8 9 10 11 12 13 14 15 16 17 18 19 20 21 22 23 24 25 26 27 28 29 30 31 32 33 34 35 36 37 38 39 40 41 42 43 44 45 46 47 48 49 50 51 52 53 54 55 56 57 58 59 60
For Peer Review
ABSTRACT
Human doublecortin (DCX) mutations are associated with severe brain malformations leading to aberrant neuron positioning (heterotopia), intellectual disability and epilepsy. The Dcx protein plays a key role in neuronal migration, and hippocampal pyramidal neurons in Dcx knockout (KO) mice are disorganized. The single CA3 pyramidal cell layer observed in wild type (WT) is present as two abnormal layers in the KO, and CA3 KO pyramidal neurons are more excitable than WT. Dcx KO mice also exhibit spontaneous epileptic activity originating in the hippocampus. It is unknown however, how hyperexcitability arises and why two CA3 layers are observed.
Transcriptome analyses were performed to search for perturbed postnatal gene expression, comparing Dcx KO CA3 pyramidal cell layers with WT. Gene expression changes common to both KO layers indicated mitochondria and Golgi apparatus anomalies, as well as increased cell stress. Intriguingly, gene expression analyses also suggested that the KO layers differ significantly from each other, particularly in terms of maturity. Layer-specific molecular markers and BrdU birthdating to mark the final positions of neurons born at distinct timepoints revealed inverted layering of the CA3 region in Dcx KO animals. Notably, many early-born ‘outer boundary’ neurons are located in an inner position in the Dcx KO CA3, superficial to other pyramidal neurons. This abnormal positioning likely affects cell morphology and connectivity, influencing network function. Dissecting this Dcx KO phenotype sheds light on coordinated developmental mechanisms of neuronal subpopulations, as well as gene expression patterns contributing to a bi-layered malformation associated with epilepsy.
3 4 5 6 7 8 9 10 11 12 13 14 15 16 17 18 19 20 21 22 23 24 25 26 27 28 29 30 31 32 33 34 35 36 37 38 39 40 41 42 43 44 45 46 47 48 49 50 51 52 53 54 55 56 57 58 59 60
For Peer Review
INTRODUCTION
The development of neuronal circuits necessitates an intricate sequence of events including cell proliferation, migration, differentiation and synaptogenesis. The hippocampus is a laminated structure that develops following these steps, similar to the neocortex (1). There is evidence for birthdate-dependent layering of principal neurons with deep to superficial molecular and connectivity gradients (2-4). In the rodent, this pattern is induced from mid-embryogenesis, and newly born neurons carry intrinsic properties to help establish their adult phenotypes (5). A population of the earliest born neurons have specifically been shown to function as highly connected hub neurons in juvenile CA3 (6), helping to organize circuit development. Clonal analyses have also shown that related hippocampal pyramidal neurons derived from the same progenitor share interneuron connectivity (7). Thus, the timing and manner that hippocampal neurons are generated are critical for adult function.
Pyramidal cells of the major CA1 and CA3 fields are molecularly distinguishable (3, 8-10). Gene expression boundaries along the radial and septo-temporal axes distinguish hippocampal cell subpopulations related to anatomical position, birthdate and connectivity patterns (3, 5, 11). Subpopulations of interconnected neurons in different hippocampal fields have been found to share similar patterns of gene expression, birthdate and time window of synaptogenesis, these microcircuits being associated with hippocampal function (5, 12).
Mutations in genes associated with neurodevelopmental syndromes often reveal abnormal hippocampi in mouse models. This is characteristic of doublecortin (Dcx), Lis1, and alpha 1
tubulin (Tuba1a) mutations, which in human are associated with cortical malformations
featuring neuronal disorganization, including lissencephaly and subcortical band heterotopia (SBH) that present clinically with varying degrees of intellectual disability (ID) and epilepsy (13-16). Mouse models show common but variable defects in hippocampal fields which are often disorganized (17-20). For unknown reasons, hippocampal defects appear to be a signature 3 4 5 6 7 8 9 10 11 12 13 14 15 16 17 18 19 20 21 22 23 24 25 26 27 28 29 30 31 32 33 34 35 36 37 38 39 40 41 42 43 44 45 46 47 48 49 50 51 52 53 54 55 56 57 58 59 60
For Peer Review
of type 1 lissencephaly mouse models, more so than neocortical abnormalities (21). Gene expression patterns that distinguish the features of abnormally positioned neurons have not yet been reported, which could shed light on their origins and functions.
Dcx is a developmentally regulated microtubule associated protein (MAP) important for the stabilization of microtubules in migrating and differentiating neurons (22-25). In Dcx KO mice, hippocampal pyramidal cells are abnormally positioned, mostly in the CA3 region, where the single pyramidal cell layer observed in wild type (WT) is divided into two layers (18, 19). Video EEG recordings showed that Dcx KO mice have spontaneous epilepsy with the abnormal electrical activity originating in the hippocampus and secondarily propagating to the cortex (26). Extracellular and whole cell recordings in the Dcx KO CA3 region found that disorganized cells are more excitable than WT pyramidal cells (26, 27). Field recordings from Dcx KO brain slices suggested that pyramidal cells make a primary contribution to the spontaneous epileptiform activity, whereas inhibition remained strong during interictal events (27). It is hence important to further characterize Dcx KO CA3 pyramidal cells to investigate the mechanistic link between mutation of this protein, heterotopic cell positioning and hyperexcitability.
In this study, we assessed global gene expression in the abnormal KO CA3 layers compared to the WT monolayer at postnatal day 0 (P0). At this stage of development, most CA3 neurons are expected to have arrived at their final destinations and to be growing axons and dendrites (2, 28). Gene expression changes at this stage may therefore contribute to abnormal morphology and circuitry seen in the mature brain (26, 27). We found that both KO layers have perturbed expression of genes indicating organelle abnormalities, increased cell stress and perturbed cell metabolism. Comparing KO layers also identified an unexpected inversion of a subpopulation of early-born KO neurons. Gene ontologies, layer-specific molecular markers and BrdU birthdating experiments confirmed transcriptome data suggesting that many of the most mature 3 4 5 6 7 8 9 10 11 12 13 14 15 16 17 18 19 20 21 22 23 24 25 26 27 28 29 30 31 32 33 34 35 36 37 38 39 40 41 42 43 44 45 46 47 48 49 50 51 52 53 54 55 56 57 58 59 60
For Peer Review
neurons are in an abnormal position and tissue environment at P0. Given the distinct molecular identities and connectivity patterns conferred by birthdate, this perturbation likely influences neuron morphology and circuit formation, potentially contributing to the development of hyperexcitability in this mouse model.
RESULTS
Laser capture microdissection (LCM) of CA3 cells in Dcx KO and WT
In the Dcx KO hippocampus, the two abnormal bands of pyramidal cells in the CA3 region, termed here stratum pyramidale internal (SPI, closest to the stratum radiatum) and stratum
pyramidale external (SPE, closest to the stratum oriens), are visible by late embryonic stages
(Fig. 1). LCM at P0 allowed us to specifically separate SPI from SPE, and a similar region was excised from WT CA3 (Fig. 1). Reverse transcriptase (RT) PCR from LCM material confirmed that the microdissected samples expressed the CA3 marker KA1 (Grik4) (9), but did not express the CA1 marker Scip nor the dentate gyrus marker Prox1 (Supp. Fig. 1) .
Picochip analyses for RNA quality of CA3 LCM samples (n = 5 per condition) were compared to analyses of RNAs from whole brain sections that had not been subjected to LCM. The latter had high RNA integrity number (RIN) values of 9 on average, indicating that the sectioned and stained brain material was of good quality (Supp. Table 1). The LCM samples displayed a lower RNA quality, which is expected from this procedure, with RIN values between 5.2 and 7.2 (Supp. Fig. 2, Supp. Table 1). Overall, RNA integrity showed sufficient quality and reproducibility to proceed with microarray analyses.
Differential gene expression between the WT CA3 region and Dcx KO SPI and SPE
Reverse transcription, linear amplification and hybridization to microarrays were performed according to Illumina protocols. Of the 25,600 well-annotated transcript probes on the Illumina
MouseRef-8 v2.0 Expression BeadChip array, 11,800 (45%) on average demonstrated a
3 4 5 6 7 8 9 10 11 12 13 14 15 16 17 18 19 20 21 22 23 24 25 26 27 28 29 30 31 32 33 34 35 36 37 38 39 40 41 42 43 44 45 46 47 48 49 50 51 52 53 54 55 56 57 58 59 60
For Peer Review
detectable level of expression amongst the 15 samples (GEO accession GSE87019). After data normalization (Supp. Fig. 3), 2361 and 1940 transcripts were found to be differentially expressed in SPI and SPE cells respectively compared to WT when the P value cut-off was set to < 0.01, and 1758 and 1202 transcripts when P < 0.005 (Fig. 2A, Supp. Table 2). Considering all SPI versus WT changes with a P value < 0.005, an approximately equal number of transcripts were up- (52 %) and down-regulated (48 %) (Fig. 2A, Supp. Table 3A). For SPE versus WT, a greater proportion of transcripts were up-regulated (67 %), and only 33 % were down-regulated (Fig. 2A, Supp. Table 3A). Considering genes showing a greater than 1.5 X change compared to WT (P < 0.005), there were 49 up-regulated in SPI and 4 in SPE, and 11 down-regulated in SPI and 3 in SPE (Supp. Table 3B). As expected, Dcx appeared amongst the most significantly down-regulated in both SPI and SPE gene lists.
Microarray analyses confirmed that WT and both KO cell populations expressed the CA3 field-specific markers KA1 (Grik4) (9) and Bok (29). Focusing on genes that were commonly deregulated in both SPI and SPE KO cells compared to WT, 372 and 224 genes with
P values of < 0.01 and < 0.005, respectively, were identified (Supp. Table 4). Some of these
common gene expression changes may be directly and specifically related to the inactivation of
Dcx (see below for genes coding protein partners), or due to deregulated cell processes. We
performed DAVID (Database for Annotation, Visualization and Integrated Discovery) functional annotation clustering analyses for the 372 commonly differentially expressed genes (P < 0.01; Fig. 2B, Supp. Table 5A). Significant categories include nucleotide binding and translation, as well as Golgi apparatus and mitochondrion, the latter likely to indicate organelle abnormalities, which indeed coincides with our previous observations by electron microscopy (30). DNA repair and chaperone gene clusters also appeared as significantly different in both KO layers compared to WT, suggesting abnormalities in cell stress responses.
3 4 5 6 7 8 9 10 11 12 13 14 15 16 17 18 19 20 21 22 23 24 25 26 27 28 29 30 31 32 33 34 35 36 37 38 39 40 41 42 43 44 45 46 47 48 49 50 51 52 53 54 55 56 57 58 59 60
For Peer Review
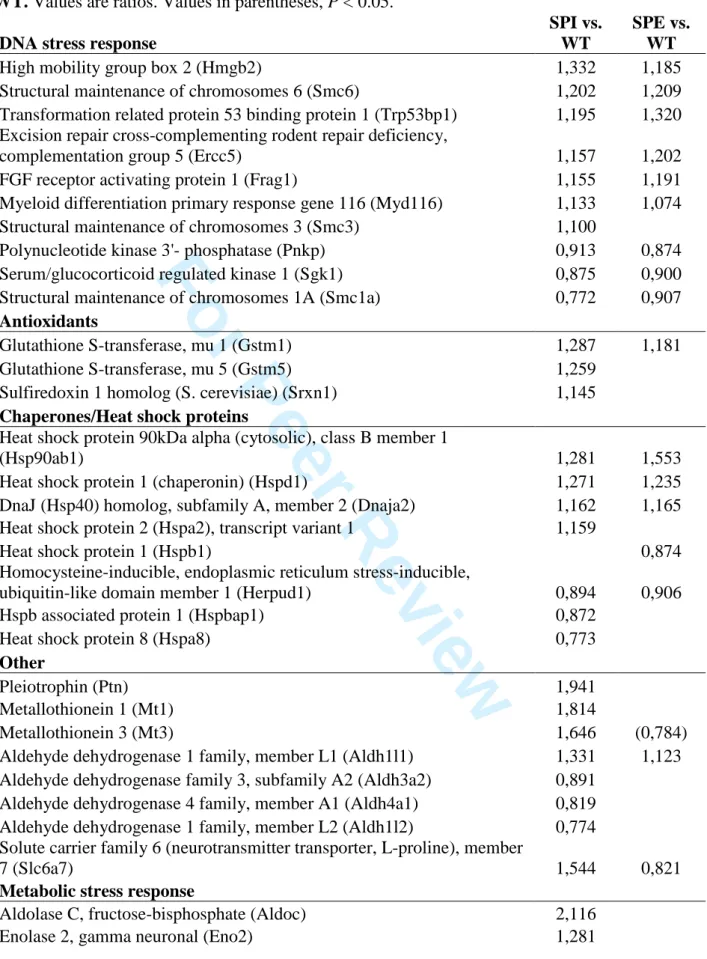
Indications for increased cell stress in Dcx KO layers at P0
Perturbed expression of genes related to organelles can be fundamentally linked with increased cell stress (31, 32). Expression of DNA repair proteins and upregulation of chaperones are known responses to oxidative stress that occur, for example, when the production of reactive oxygen species (ROS) is increased (33, 34). A significant number of genes involved in repairing DNA were found upregulated in SPI and SPE, including genes implicated in excision repair (Ercc5) and double-strand break repair (Hmgb2) (Table 1). Genes involved in protection against oxidative stress, including subunits of glutathione S-transferase (Gstm1, Gstm5) and sulfiredoxin (Srxn1), were also upregulated in SPI and/or SPE (Table 1). Deregulated expression of heat shock protein (HSP) genes was also observed in both KO layers (Table 1). HSPs are highly conserved proteins that are often upregulated in response to several types of cell stress, functioning as molecular chaperones to help nascent protein folding or to refold damaged proteins. Two important HSPs upregulated in both SPE and SPI are Hsp90ab1 and Hspd1. Hsp90ab1 is located in the cytosol and interacts with protein kinases and transcription factors that have crucial roles in developmental processes involved in cell survival upon exposure to various stressful stimuli (34, 35). Hspd1 (Hsp60) is a mitochondrial matrix chaperone, and deficits in this protein are associated with hypomyelination and neurodegenerative disorders (36). Also related to mitochondrial function, Dnaja2, upregulated in both SPE and SPI, functions as a co-chaperone of Hsp70s in protein folding and mitochondrial protein import (37). Other HSPs were conversely downregulated. For example,
Hspa8, downregulated in SPI, is a constitutively expressed chaperone important for protein
import into the endoplasmic reticulum and mitochondria, ubiquitin-proteasome degradation, autophagy, and disassembly of clathrin-coated vesicles (38). Also downregulated in SPI and SPE is Herpud1, a component of the endoplasmic reticulum quality control system involved in 3 4 5 6 7 8 9 10 11 12 13 14 15 16 17 18 19 20 21 22 23 24 25 26 27 28 29 30 31 32 33 34 35 36 37 38 39 40 41 42 43 44 45 46 47 48 49 50 51 52 53 54 55 56 57 58 59 60
For Peer Review
ubiquitin-dependent degradation of misfolded proteins (39). These proteins, related to organelle function, would be expected to contribute to cell stress when downregulated.
Some changes in cell stress genes were specific to SPI. For example, pleiotrophin (Ptn) was up-regulated in SPI cells. It is a heparin-binding cytokine (40) that acts as a neuroprotective factor to prevent stress-induced cell death (41). The metallothioneins Mt1 (astrocytes > neurons) and Mt3 (brain specific isoform, neurons > astrocytes) were also upregulated only in SPI (Table 1). Mts are intracellular proteins that bind metals including zinc, and function in redox homeostasis (42). Mt overexpression may protect against apoptosis; zinc is a major inducer of its expression, as is oxidative stress and inflammation (42).
Other indications of oxidative stress are related to proline metabolism. The mitochondrial matrix gene Aldh4a1 (P5cd) (Table 1), critical for proline catabolism, is downregulated, and mutations in this gene in humans lead to hyperprolinemia, a disease associated with ID and epilepsy. Additionally, the proline transporter Slc6a7 is upregulated in SPI (Table 1), further suggesting that intracellular proline could be increased. This Na+
dependent transporter is localized to synaptic vesicles and excitatory nerve terminals, corresponding to the proposed role of proline in ion channel and neurotransmitter receptor regulation (43). Proline metabolism is connected to the pentose phosphate pathway and redox homeostasis, and can also serve as a source of glutamate, ATP and ROS (44). On the other hand, proline might function as an antioxidant by decreasing ROS production (45). Thus several genes, some clearly linked to organelle function, are indicative of cell stress in P0 Dcx KO cells.
Metabolism genes are perturbed in KO layers
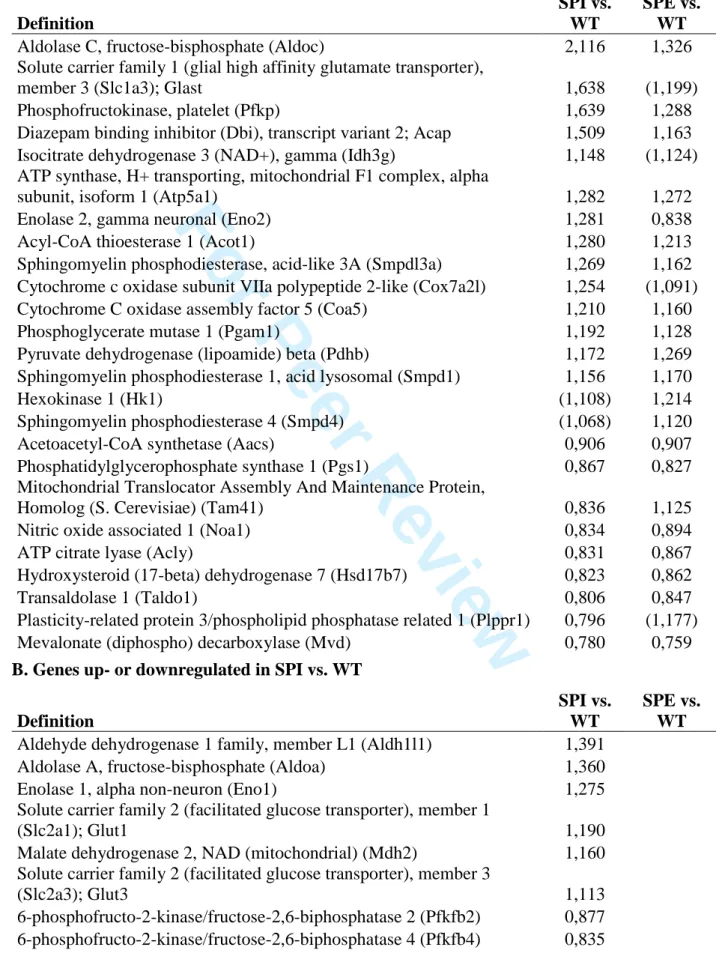
Potentially also linked to cell stress and/or organelle abnormalities, we observed several metabolic genes that are commonly deregulated in SPI and SPE compared to WT (Table 2A). For example, phosphofructokinase, platelet type (Pfkp), which catalyses the rate-limiting step 3 4 5 6 7 8 9 10 11 12 13 14 15 16 17 18 19 20 21 22 23 24 25 26 27 28 29 30 31 32 33 34 35 36 37 38 39 40 41 42 43 44 45 46 47 48 49 50 51 52 53 54 55 56 57 58 59 60
For Peer Review
in glycolysis, phosphoglycerate mutase 1 (Pgam1), another glycolytic enzyme, and hexokinase 1 (Hk1), an enzyme localized to the outer mitochondrial membrane that catalyzes the first step of glycolysis, are increased in both SPI and SPE. Genes involved in the Krebs cycle are upregulated in both layers including an ATP synthase subunit (Atp5a1), pyruvate dehydrogenase (Pdhb) and isocitrate dehydrogenase 3 (Idh3g). The latter enzyme has a role in redox homeostasis by generation of NADH/NADPH. On the other hand, there is a decrease in transaldolase 1 (Taldo1) in both SPI and SPE, an enzyme of the non-oxidative branch of the pentose phosphate pathway.
Other notable changes in metabolism are related to lipids (Table 2A). Downregulation of genes related to lipid synthesis in SPI and SPE include ATP citrate lyase (Acly), acetoacetyl-CoA synthetase (Aacs) and phosphatidylglycerophosphate synthase 1 (Pgs1). Two enzymes involved in biosynthesis of cholesterol, mevalonate decarboxylase (Mvd) and hydroxysteroid 17-beta dehydrogenase 7 (Hsd17b7), are also downregulated in both KO layers. Furthermore there is upregulation of three sphingomyelin phosphodiesterase genes coding for enzymes that break down sphingolipids (Smpdl3a, Smpd4, Smpd1), and upregulation of acyl-CoA thioesterase 1 (Acot1) that hydrolyses lipids (acyl-CoAs). Diazepam binding inhibitor (Dbi), also known as acyl-CoA binding protein, has been shown to regulate long-chain fatty acid metabolism, and is upregulated to a greater extent in SPI than SPE (46). Plasticity related protein 3 (Plppr1), downregulated in SPI, generates lipids important for cell signaling events including promotion of neurite growth (47). Overall, perturbed lipid metabolism may have numerous effects on cell signaling, function of membrane-bound organelles and particularly the plasma membrane of which cholesterol and sphingolipids are important components.
SPI layer cells are distinguishable from SPE layer cells
3 4 5 6 7 8 9 10 11 12 13 14 15 16 17 18 19 20 21 22 23 24 25 26 27 28 29 30 31 32 33 34 35 36 37 38 39 40 41 42 43 44 45 46 47 48 49 50 51 52 53 54 55 56 57 58 59 60
For Peer Review
We next queried layer-specific gene expression. Many differentially expressed genes were specific to either SPE versus WT, or SPI versus WT (Supp. Fig. 4). DAVID analyses to compare these up- and down-regulated genes (P < 0.005) revealed that functional categories were indeed different between SPE and SPI (Supp. Table 5B-E). The major categories with the highest enrichment scores are summarized in Fig. 3. For SPI up-regulated genes, enriched categories included several related to synaptic function, cell adhesion and metabolism. Some of the latter genes were identified in previous analyses (Table 2B). Concerning SPE up-regulated genes, enriched categories included organelle lumen, RNA processing and mitochondrion. SPE down-regulated genes included membrane, GTP binding and actin binding, whereas SPI down-regulated gene categories corresponded to those upregulated in SPE (e.g., RNA processing, organelle lumen). These analyses hence suggest that the SPI layer of cells differs substantially from SPE at P0.
These findings are also supported by Ingenuity Pathway Analyses (IPA), focusing on processes involved in central nervous system (CNS) development. For genes enriched in SPE compared to WT, the broad categories predicted to be the most significantly activated (z-score > 2) included proliferation of cells, movement of brain cells and development of CNS. For genes enriched in SPI compared to WT, more than 15 categories were identified as being significantly activated. The most significant cellular processes included formation of vesicles, formation of neurites, tubulation of cells, cell movement, long-term potentiation of synapse and formation of axons (Supp. Table 6).
We next compared SPI and SPE to each other, and identified 2646 transcripts that were significantly differentially expressed between these two Dcx KO cell populations (Fig. 2A;
Supp. Table 4A). Of these, 97 transcripts showed more than 1.5 X fold change difference (P <
0.005). The DAVID functional annotation clustering to compare enriched genes in SPI versus SPE confirmed previous findings of comparing either to WT. Notably, genes preferentially 3 4 5 6 7 8 9 10 11 12 13 14 15 16 17 18 19 20 21 22 23 24 25 26 27 28 29 30 31 32 33 34 35 36 37 38 39 40 41 42 43 44 45 46 47 48 49 50 51 52 53 54 55 56 57 58 59 60
For Peer Review
enriched in SPI compared to SPE clustered in processes related to synapses, vesicular transport, cell adhesion, glycoproteins and cytoskeletal organization (extended list shown in Supp. Table
5F, Supp. Fig. 5A). SPE gene expression compared to SPI on the other hand, showed clustering
enrichment related to organelle lumen, RNA processing, transcription and chromatin modification (Supp. Table 5G, Supp. Fig. 5B). These clustering analyses are mostly exclusive, and point to a difference in the maturity status between the two Dcx KO CA3 layers. Indeed, a previous transcriptome study of several mouse lines showed that genes related to transcription and translation are highly expressed during prenatal development, being turned down progressively at P0 and P14, whereas expression of genes related to synaptogenesis showed the opposite regulatory pattern (48). Therefore, based on functional annotation clustering of differentially regulated genes, SPI cells appear to be more mature than SPE at P0.
Neuronal development genes are differentially expressed between SPI and SPE cells
Dcx and many other migration genes continue to be expressed postnatally; therefore, we
compared genes coding for Dcx partners and other genes known to be involved in migration and/or differentiation. Genes potentially related to Dcx’s function that showed expression differences were regulatory subunits of protein phosphatases 1 and 2 (either up or down, a larger number deregulated in SPE) and the close homolog of Dcx, Dclk1 (down in SPE) (Table
3) (23, 49). Dclk2, on the other hand showed no changes. Also down-regulated in SPI compared
to WT, were Cdk5 and Mark2, both kinases that phosphorylate Dcx (50, 51), and AP1 (Ap1m1) and AP2 (Ap2m1) mu subunit 1 genes of adaptor complexes, which interact with Dcx for vesicle trafficking (52). Kif1a, a kinesin shown to be involved with Dcx in trafficking cargoes (53) and
Nfasc, coding for a cell adhesion molecule of the L1-CAM family interacting with Dcx, were
upregulated in SPI (54). If SPI cells are more mature, these gene differences may potentially distinguish migration from differentiation roles of these partners.
3 4 5 6 7 8 9 10 11 12 13 14 15 16 17 18 19 20 21 22 23 24 25 26 27 28 29 30 31 32 33 34 35 36 37 38 39 40 41 42 43 44 45 46 47 48 49 50 51 52 53 54 55 56 57 58 59 60
For Peer Review
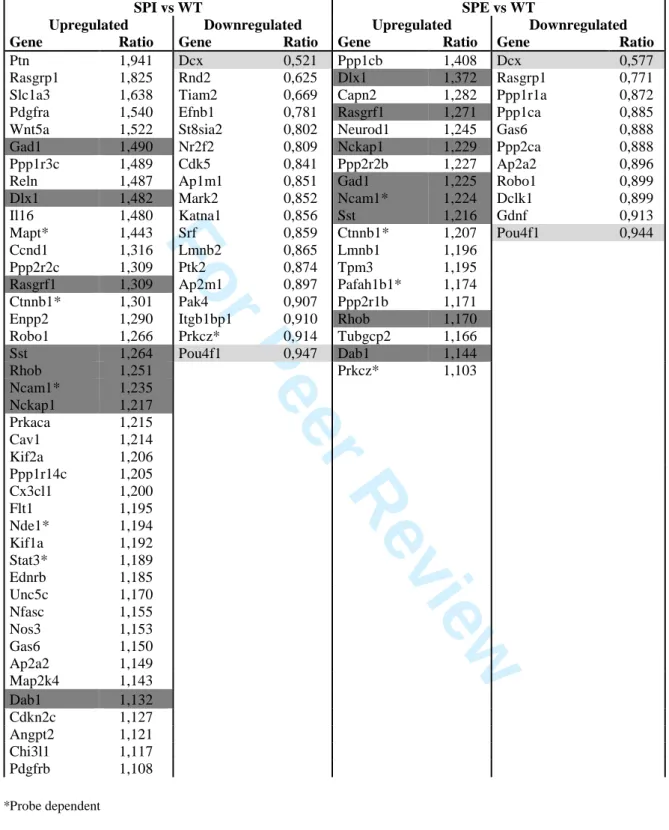
Several genes known to be involved in development of the cortex and hippocampus, including Nde1, Dab1 and Kif2a (55-57) were up-regulated in either SPI (Nde1, Kif2a), or both SPI and SPE when compared to WT (Table 3). Three markers for interneurons (Gad1, Sst,
Dlx1) were shown also to be upregulated in both SPI and SPE, which may reflect some
interneuron disorganization in the KO (30).
Through IPA functional clustering (e.g., Supp. Table 6 ‘Cellular movement’ categories), as well as literature searches, we assessed other genes known to be particularly important for migration (Table 3). Notably, SPI showed a significant down-regulation of Srf, a transcription factor regulated by changes in the ratio of polymerized to unpolymerized actin that is important for neuronal migration (58), and alpha-N-acetyl-neuraminide alpha-2,8-sialyltransferase 2 (St8sia2), a gene which is highly expressed in migrating neurons, but down-regulated during neuronal differentiation (59). Furthermore, the Rho-GTPase Rnd2, a modulator of radial migration in the developing cortex with a very specific spatiotemporal expression pattern, being strongly expressed in radial glial progenitors and radially migrating neurons but sharply down-regulated once neurons finish migration and start differentiation (60), was similarly down-regulated in SPI.
Thus, although the two Dcx KO populations share a common deficit in Dcx, and both differ from WT, they show variable differences in expression of neuronal migration and differentiation genes. These data may be consistent with the fact that SPI cells are potentially already in the process of down-regulating a certain number of migration genes, and represent a subpopulation more advanced in maturity than SPE cells.
Further supporting this, changes in genes related to synaptogenesis, ion channels and neurotransmission are upregulated in SPI (Table 4). Some mutant forms of these genes are known genetic causes of epilepsy (e.g., Sv2a, Lgi1 (61)). In addition, three genes encoding subunits of the Na+/K+-ATPase cation transporter (Atp1a2, b1, b2) are upregulated in SPI. 3 4 5 6 7 8 9 10 11 12 13 14 15 16 17 18 19 20 21 22 23 24 25 26 27 28 29 30 31 32 33 34 35 36 37 38 39 40 41 42 43 44 45 46 47 48 49 50 51 52 53 54 55 56 57 58 59 60
For Peer Review
These plasma membrane channels regulate excitability by maintaining the resting potential, and are also a major consumer of the cell’s total energy (62). The up-regulation of all of these genes may point to the advanced maturity of SPI cells. Finally, three categories related to blood vessel development appeared in the functional annotation clustering for upregulated genes in SPI (Supp. Table 6), perhaps also suggesting advanced maturity because neurons and blood vessels develop together (63).
A partial inversion of the Dcx KO hippocampal CA3 field along its radial axis
The hippocampus is made up of morphologically and functionally distinct pyramidal cells along its radial (deep to superficial), and septal to temporal axes. Molecular differences along these axes may contribute to the acquisition of specific phenotypes (3). We next analysed previously identified layer-specific markers along the radial axis in the Dcx KO, since neurons in radial layers are likely to have different maturities at P0, depending on their birthdates. Thompson et al (2008) described 45 molecular markers that specifically label CA3 outer boundary (deep, closest to the stratum oriens) neurons in the adult brain. We searched for these molecular markers in our P0 dataset and notably, found 13 genes to be significantly up-regulated in the SPI gene list (Table 5A). This suggests that some cells, which would have normally been closest to the stratum oriens, are positioned in much more superficial regions closest to the
stratum radiatum of the Dcx KO hippocampus. Significantly, 7 of the 14 genes (Sema5a, Fxyd5,
Epha7, Kcnf1, Slc30a3, Fxyd7 and Cdh13) code for membrane proteins, which may be related
to a role forming a boundary at the edge of the pyramidal cell layer. Two further genes down-regulated in outer-boundary cells (Efnb3, Cadps2) were also lower in expression in SPI than SPE.
Early-born subpopulation markers were likewise identified by Deguchi et al (2011), analysing adult hippocampal cell populations from Lsi1 and Lsi2 reporter mice. Despite the age 3 4 5 6 7 8 9 10 11 12 13 14 15 16 17 18 19 20 21 22 23 24 25 26 27 28 29 30 31 32 33 34 35 36 37 38 39 40 41 42 43 44 45 46 47 48 49 50 51 52 53 54 55 56 57 58 59 60
For Peer Review
and preparation differences of the starting samples, once again, we identified some genes in common in our SPI gene lists (Table 5B, 6 genes similarly upregulated in SPI vs. WT, of 53; 6 genes similarly down-regulated of 77). Linking the datasets, Suppression of tumorigenicity
18 (St18) and stAR-Related Lipid Transfer (START) Domain Containing 13 (Stard13) are
commonly enriched in SPI, outer boundary (3) and early-born (5) datasets. These comparisons together indicate that many SPI cells may be misplaced, early-born, outer-boundary cells.
The SPI-enriched expression of three of these genes, St18, Cadherin 13 (Cdh13) and
N-terminal EF-hand calcium binding protein 2 (Necab2), was confirmed by qPCR and/or in situ
hybridization experiments at P0 (Fig. 4A,B, Supp. Table 7). Furthermore, in the adult, St18,
Necab2 and collagen type VI alpha 1 (Col6a1), the latter being an adult CA2/CA3 outer
boundary marker in WT (3, 64), were each found enriched in SPI cells, especially in rostro-dorsal hippocampal regions (Fig. 4C). Outer boundary SPE cells were also labelled in more temporal regions.
To better identify cells, we further checked by qPCR other genes that were differentially regulated in SPI and/or SPE versus WT transcriptome data (Supp. Table 3). Notably, whereas some genes are specifically upregulated in association with SPI (Dbi, Slc6a7, Camk2a, Necab2,
Npy, Atp1b1), Adreno-receptor alpha 2A (Adra2a) and Gastrin-releasing peptide (Grp), were
enriched specifically in SPE (Fig. 4A). In situ hybridisations of Grp, a CA3 gene involved in cell migration, showed homogenous labelling in the WT CA3 region at P0, as well as the intermediate migration zone (Fig. 4B) (65, 66). In the Dcx KO, SPE cells are strongly labelled, with little expression seen in the SPI layer. We also confirmed that Cholecystokinin B receptor
(Cckbr) and Cadherin 13 (Cdh13) were similarly upregulated in SPI and downregulated in SPE
(Fig. 4A), which may point to Cckbr having an outer-boundary profile.
The SPI findings in particular strongly suggest that some cells destined for the outer boundary layer of the CA3 pyramidal cell layer in the stratum oriens region, potentially born 3 4 5 6 7 8 9 10 11 12 13 14 15 16 17 18 19 20 21 22 23 24 25 26 27 28 29 30 31 32 33 34 35 36 37 38 39 40 41 42 43 44 45 46 47 48 49 50 51 52 53 54 55 56 57 58 59 60
For Peer Review
at early stages of CA3 neurogenesis (2), are abnormally, superficially positioned in the Dcx KO SPI with respect to SPE. SPE on the other hand, may resemble more generally the WT pyramidal cell layer organisation, containing CA3 cells born at later time-points.
The similar neurodevelopmental outcomes of other hippocampal heterotopia mouse models (Lis1, Tuba1a) suggest that the molecular mechanisms mediating these phenotypes may overlap, at least in the CA3 field. To further investigate this possibility, we performed in situ hybridizations in the Tuba1a (+/S140G) mutant mouse at P0. St18 and Necab2, which were found predominantly in the Dcx KO SPI layer (Fig 4), also primarily label inner-layer cells in the CA3 region in the Tuba1a mutant compared to a control littermate (Supp Fig. 6). Furthermore, Grp expression is similar between Tuba1a and Dcx mutants, with relatively homogenous labeling across the major CA3 layer and the migrating cell layer, however with decreased labeling in the inner-most cells in the mutant. This is intriguing because similar positioning of early-born CA3 cells across several mouse mutant lines might indicate that these neurons migrate normally and are less susceptible to cytoskeletal-related gene mutations, perhaps indicating that migration modes/mechanisms are different between early- and late-born neurons in this region.
BrdU birthdating experiments to label early- and late-born cells
Perturbation of layer-specific marker data discussed above suggested that the inside-out layering of the CA3 region of the hippocampus is abnormal in Dcx KO mice. To study cell birthdates in more detail, bromodeoxyuridine (BrdU) was injected in Dcx (+/-) pregnant dams at either E12.5 or E16.5 to label early-born and late-born neurons, respectively, and brains from the exposed embryos were analysed at P21-24 to determine the final destinations of CA3 cells. In WTs, injection of BrdU at E12.5 labelled many neurons (NeuN+) along the border of the pyramidal cell layer and stratum oriens, as expected (2, 5), with 67 +/- 1.3 % of total BrdU-3 4 5 6 7 8 9 10 11 12 13 14 15 16 17 18 19 20 21 22 23 24 25 26 27 28 29 30 31 32 33 34 35 36 37 38 39 40 41 42 43 44 45 46 47 48 49 50 51 52 53 54 55 56 57 58 59 60
For Peer Review
labelled neurons found in the outer half of the CA3 stratum pyramidale and the other 33 +/- 1.3 % in the inner half (P < 0.001, paired t-tests, n = 4 mice; Fig. 5). When looking at each of the CA3 subfields separately, CA3a and b showed a greater adherence to inside-out labelling compared to CA3c, in which there was no significant difference between the percentages of BrdU+ neurons located in the inner or outer halves. By contrast, 56 +/- 1.7% of BrdU-labelled neurons were found in the SPI of Dcx KO mice, with the remaining 46% in SPE (P < 0.05, paired t-test, n = 4 mice; Fig. 5). Comparing the CA3 subfields in KO and WT, the majority of the lamination defect appears to be in CA3a and b. Overall, the proportion of BrdU+ neurons labelled at E12.5 in the inner portion of CA3 is greater in KO vs. WT mice (P < 0.001, Chi-squared test).
Injection of BrdU at E16.5 is expected to label late-born neurons that settle superficially in the CA3 close to the stratum radiatum (2, 5). In the WT CA3, 72 +/- 1.6% of BrdU+ cells were detected in the inner portion of the pyramidal cell layer (P < 0.001, paired t-test, n = 4 mice; Fig. 5). Once again, the CA3a and CA3b subfields showed greater adherence to inside-out labelling, with CA3c actually having more BrdU+ neurons in the inner portion of the pyramidal layer (P < 0.05, paired t-test, n = 4 mice; Fig. 5). In the Dcx KO CA3 region, BrdU+ neurons were mainly located in the outer (SPE) layer (82 +/- 1.4%, P < 0.001, paired t-test, n = 5 mice; Fig. 5). There were significantly more BrdU+ neurons in SPE in each CA3 subregion, even in CA3c. Relative to SPE itself, many of these late-born BrdU+ neurons appeared to be correctly placed in the internal portion of CA3a and b. These data hence confirm a partial inversion of birthdate-dependent, inside-out layering, predicted from the transcriptome data, affecting early-born, outer boundary cells, found in an abnormal superficial position in the Dcx KO hippocampus. DISCUSSION 3 4 5 6 7 8 9 10 11 12 13 14 15 16 17 18 19 20 21 22 23 24 25 26 27 28 29 30 31 32 33 34 35 36 37 38 39 40 41 42 43 44 45 46 47 48 49 50 51 52 53 54 55 56 57 58 59 60
For Peer Review
In the present study, we queried the genetic content and origin of abnormally positioned hippocampal neurons in a mouse model of type 1 lissencephaly associated with epilepsy. To our knowledge, no other studies have attempted to assess global gene expression in heterotopic neurons. We questioned how the dual CA3 pyramidal cell layers in the Dcx KO differ from each other and from WT, using LCM to separate Dcx KO layers at P0. Comparing WT to KO layers revealed evidence of organelle, cell stress and metabolic gene differences. SPI and SPE layer-specific gene changes were also identified, suggesting a difference in maturity between the two layers at P0. Further comparisons with previously published datasets, as well as qPCR,
in situ hybridisation and BrdU labelling experiments, confirmed that many
superficially-positioned SPI cells have the identity of normally deeply-superficially-positioned, early-born neurons. Later-born SPE cells had a more similar gene content and arrangement as WT cells. Thus, perturbed birthdate-dependent organization in addition to separated localisations of SPI and SPE likely lead to morphological and connectivity abnormalities (27).
Common transcriptome changes in SPI and SPE indicate abnormal organelles, increased cell
stress and metabolic abnormalities
The transcriptome experiment performed with laser microdissected material revealed on average 45 % of the transcripts on the microarray showing a detectable level of expression, falling into an appropriate range of the number of expressed genes expected per tissue, as shown by previous RNAseq studies (67). Both KO layers showed appreciable numbers of differentially expressed genes compared to WT, and these were for the majority layer-specific. This study of isolated pyramidal cell populations in the hippocampus at P0 may reveal both cell-autonomous and non-cell autonomous gene expression changes. A lack of Dcx has been shown previously to result in abnormal microtubule bundling (68), as well as abnormal intracellular transport (53), both intrinsic changes. However, exchanges with the environment (potentially also 3 4 5 6 7 8 9 10 11 12 13 14 15 16 17 18 19 20 21 22 23 24 25 26 27 28 29 30 31 32 33 34 35 36 37 38 39 40 41 42 43 44 45 46 47 48 49 50 51 52 53 54 55 56 57 58 59 60
For Peer Review
aberrant due to abnormal cell position) may be different from WT, resulting in either abnormal cellular responses, and / or abnormal effects on surrounding cells.
Of the commonly deregulated genes in SPI and SPE compared to WT, many were related to cellular response to stress, DNA damage repair pathways and organelles. DNA damage repair pathways, expressed highly during embryogenesis, were previously shown to be downregulated postnatally in several mouse lines (48). Two of the most significantly enriched functional categories in both KO layers were mitochondrion and Golgi apparatus (Fig. 2, Supp.
Table 5A), corroborating our previous electron microscopy findings that showed ultrastructural
abnormalities in these organelles in both SPI and SPE (30). Perhaps as a result of organelle dysfunction and/or increased cell stress, apoptotic cell death was also found to be increased in the hippocampus of Dcx KO mice at P2 (30).
A direct link between Dcx, certain deregulated genes and organelle abnormalities seems plausible given the role of Dcx in microtubular functions (68) endocytosis (69), vesicular transport (49, 52, 53) and its interaction with molecular motors (49, 53). The misplacement or impaired transport of particular organelles, and/or intracellular transport in general, due to abnormal microtubules (e.g. (68)) may affect metabolism, leading to cell stress and abnormal organelle morphologies. Furthermore, the function and subcellular localisation of mitochondria (70) and other organelles (71) play important roles in the formation of dendrites, which are abnormal in the Dcx KO (27). Converging data in the literature and the deregulated genes we identify hence point towards this being a potential mechanism leading to abnormal cell function.
Linking metabolism and neuronal migration, oxidative phosphorylation was recently shown to be necessary for tangential migration of interneurons (72). Although CA3 neurons migrate radially, they travel further and over a longer period of time relative to CA1 (73), which could also make them more vulnerable to mitochondrial or metabolic abnormalities.
3 4 5 6 7 8 9 10 11 12 13 14 15 16 17 18 19 20 21 22 23 24 25 26 27 28 29 30 31 32 33 34 35 36 37 38 39 40 41 42 43 44 45 46 47 48 49 50 51 52 53 54 55 56 57 58 59 60
For Peer Review
Several metabolic genes are similarly deregulated in both KO layers compared to WT, which could also increase cell stress (Table 2). Increasing glycolysis in neurons (via genetic mechanisms) has been shown to increase cell stress (74). However, we cannot be certain that metabolic changes, particularly those related to glycolysis, are restricted to pyramidal neurons in our samples. We also found upregulation of genetic markers of interneurons (Gad1, Sst,
Dlx1), oligodendrocyte precursor cells (OPCs) (e.g., Olig1) and astrocytes (e.g., Glast) in both
SPI and SPE compared to WT. This may reflect disorganization of other cell types, and potentially non-cell-autonomous effects of Dcx mutation. For example, OPCs that do not express Dcx may migrate between the two pyramidal cell layers, being attracted to white matter that does not typically form there (75). Interneuron disorganization also seems apparent in the
Dcx KO hippocampus, but this may be due to mislocalization of the pyramidal cells, invading
spaces normally occupied by interneurons (stratum radiatum and stratum oriens). Alternatively, interneuron disorganization could also be a cell-autonomous effect as they normally express Dcx, and KO or knockdown causes slowed tangential migration (22, 23).
There are also several indicators of perturbed lipid metabolism in both SPI and SPE, which be linked to affect plasma membrane and organelle integrity, regardless of the cell types affected. This is interesting in light of previous links between lipid metabolism and epilepsy, and the efficacy of ketogenic diets in treating epilepsy in both mouse models and humans (76). There is however, no major evidence that Dcx KO mice experience epilepsy at P0 or in utero. Identified defects most likely contribute to the development of the heterotopia and epilepsy in adulthood. Thus, we can link various genetic and cellular defects potentially with epilepsy, and these associations to our knowledge have never previously been made for a heterotopia condition.
SPI contains more early-born, mature cells than SPE
3 4 5 6 7 8 9 10 11 12 13 14 15 16 17 18 19 20 21 22 23 24 25 26 27 28 29 30 31 32 33 34 35 36 37 38 39 40 41 42 43 44 45 46 47 48 49 50 51 52 53 54 55 56 57 58 59 60
For Peer Review
Differentially regulated genes related to migration, neuronal function and radial position within the CA3 pyramidal cell layer suggest that SPI and SPE cells have different birthdates and corresponding maturity statuses. Overall, the formation of two layers from E17.5 is most probably related to a cell-autonomous lack of Dcx. Certain ‘migration gene’ changes, although not all, are exclusive to either SPI or SPE. It is possible that the majority of early-born neurons, which colonise CA3 and eventually become SPI, migrate normally and potentially in a Dcx-independent fashion, whereas later-born neurons that primarily constitute SPE, do not migrate far enough. It is however, difficult to assess whether SPE is correctly positioned compared to WT, or if it indicates arrested migration in the intermediate zone. In utero genetic interventions may address this point in the future.
It seems unlikely that early-born neurons over-migrate given that Dcx mutations have only been shown to decrease migration speed (77). SPI cell position close to the stratum
radiatum likely exposes them to an abnormal environment as they continue to mature, which
may further perturb patterns of gene expression. This could be one reason that the overlap in previously published, early-born, outer-boundary gene lists was not more complete, although the differences in age also likely contribute to this. Whether the abnormally positioned early-born cells represent a specific subset of all early-early-born cells (e.g. (3, 5, 6) is currently unknown.
Later-born neurons may be vulnerable to the loss of Dcx; they have farther to travel as development proceeds, particularly in CA3 due to the curved shape. Furthermore, ‘sojourning’ during migration occurs in this hippocampal field (2), and later-born mutant neurons may not be able to reach earlier-born neurons after this pause. Radial glial cells may also have some particularity in the CA3 region (7, 78). A decrease in migration speed may hence be revealed more prominently in this region. As seen in migrating neuroblasts from the cortex (79) or in the postnatal rostral migratory stream (RMS), Dcx knockdown slowed migration speed, and the RMS neurons started to mature before reaching their normal location (80). The same situation, 3 4 5 6 7 8 9 10 11 12 13 14 15 16 17 18 19 20 21 22 23 24 25 26 27 28 29 30 31 32 33 34 35 36 37 38 39 40 41 42 43 44 45 46 47 48 49 50 51 52 53 54 55 56 57 58 59 60
For Peer Review
presumably for cell-autonomous reasons, could produce SPE in the lengthy trajectory of CA3, and these particular features of CA3 may also help explain why the entire hippocampus is not affected in the Dcx KO as it is in other mutants (Lis1, Tuba1a). Following this logic however, a complete inversion of all layers might be expected, which is not the case as revealed by the BrdU and in situ hybridisation data. Further studies are required to understand which subpopulations of early- and later-born neurons correctly or under-migrate and why. In the future it will be interesting to compare embryonic expression patterns of e.g. up- or down-regulated SPE genes, which may reveal promising candidates for in utero genetic intervention.
Similar disruption of hippocampal birthdate-dependent organization was also observed in the reeler mutant, even though the extent of disorganization was more severe (81). Also, our
in situ hybridization experiments in the Tuba1a mutant were comparable to the Dcx KO,
demonstrating perturbed inside-out lamination in CA3. This suggests overlapping mechanisms or increased vulnerability of particular neuronal populations depending on birthdate. It will be interesting in the future to also compare to Lis1 mutants that have similar hippocampal phenotypes and to further focus on the differences between these models.
To speculate further on this issue, we refer to the study by Pramparo et al. (48), who analyzed gene transcription changes in whole brains from four lissencephaly mouse models (Dcx, Lis1, Ndel1 and 14-3-3epsilon) at three developmental time points. They observed that each mouse model had unique enrichment of particular gene clusters in addition to those that were commonly perturbed. We might expect similar findings if analogous hippocampal LCM transcriptome studies were performed in Lis1 and Tuba1a mutant mice. However, these models have more severe lamination defects that are present throughout the hippocampus, including two or more layers and fragmentation. Lis1 mutants also exhibit variable neocortical defects depending on the gene dosage (17, 82). Unlike Lis1, where gene dosage appears critical for all migrating neurons, the decreased severity of the Dcx KO phenotype demonstrates that Dcx is 3 4 5 6 7 8 9 10 11 12 13 14 15 16 17 18 19 20 21 22 23 24 25 26 27 28 29 30 31 32 33 34 35 36 37 38 39 40 41 42 43 44 45 46 47 48 49 50 51 52 53 54 55 56 57 58 59 60
For Peer Review
not essential for most of the mouse hippocampus and the neocortex to develop normally, and that the CA3 later-born (SPE) cells are perhaps the most vulnerable to Dcx mutation. Our gene expression data in different cell populations for various cellular processes (e.g. upregulation of cell adhesion in SPI versus WT, and deregulated morphology and cytoskeleton gene clusters in SPI or SPE versus WT) show concordance with the Pramparo et al. study, however, with the caveat that differences are also expected when comparing whole brain to microdissected hippocampus. It remains to be seen which other cellular processes may be uniquely deregulated in Dcx KO mice compared to the other models.
Dcx KO network formation
The disorganization of pyramidal cells and/or interneurons in the Dcx KO may impair network formation and lead to epileptogenesis. A subset of early-born GABAergic neurons function as hubs, generating giant depolarizing potentials (GDPs) that synchronize neural firing across the postnatal hippocampus in vitro (83, 84). Potential interneuron disorganization associated with both SPI and SPE (as suggested by the transcriptome data) might change their function, or have an effect on developing networks.
Pyramidal cells with the same birthdate show selective interconnectivity in the trisynaptic circuit (5), with some early-born CA3a/b pyramidal neurons functioning as highly interconnected hub neurons in juvenile mice in vitro (6). With a large number of early-born neurons being misplaced into a distinct layer (SPI), it is likely that these normal developmental patterns are perturbed. Another important aspect of circuit formation depends on the clonal relationship of sister pyramidal cells, which share interneuron connectivity (7). We do not know if neurons derived from the same progenitor cell distribute across SPI and SPE, or whether they tend to group together into one of these layers, but either formation could be pathological in terms of network formation. The time of onset of abnormal electrical activity (or seizures) is 3 4 5 6 7 8 9 10 11 12 13 14 15 16 17 18 19 20 21 22 23 24 25 26 27 28 29 30 31 32 33 34 35 36 37 38 39 40 41 42 43 44 45 46 47 48 49 50 51 52 53 54 55 56 57 58 59 60
For Peer Review
currently unknown in this model, but given the finding that early-born neurons are abnormally positioned and considering the important role of birthdate-dependent network synchronization outlined in the studies above, it seems likely that postnatal neuronal activity will be subsequently perturbed.
Conclusion
We show here an advanced molecular analysis of the heterotopic CA3 layers in Dcx KO mice which reveals organelle, cell stress and metabolism abnormalities as well as abnormal positioning of SPI and SPE. It remains to be seen what repercussions the relative displacement of early-born, outer boundary cells might have on neuronal differentiation, cell-to-cell communication, connectivity and function. It remains possible that SPI cells, exhibiting a unique molecular identity, still become connected appropriately, even though they are separated from the environment of SPE cells. The mechanisms leading to misplaced early-born versus late-born neurons still remain unknown, but may be related to different migration mechanisms, especially in the complex CA3 region (85). The abnormal neuronal position for rostro-dorsal SPE cells, lacking an outer-boundary with the stratum oriens, could also have consequences on connectivity. Further studies are required, including investigating synaptogenesis during postnatal stages, and performing gene expression analyses of more mature Dcx KO cells, to help answer these questions concerning the consequences of abnormal neuronal position on neuronal and network function.
3 4 5 6 7 8 9 10 11 12 13 14 15 16 17 18 19 20 21 22 23 24 25 26 27 28 29 30 31 32 33 34 35 36 37 38 39 40 41 42 43 44 45 46 47 48 49 50 51 52 53 54 55 56 57 58 59 60
For Peer Review
MATERIALS AND METHODS
Animals
Dcx KO and WT mice were maintained on the Sv129Pas background with more than ten generations of backcrosses (19, 22). Genotyping was performed by PCR to verify the inactivation of the Dcx gene in KO animals (22). All experiments were performed in accordance with institutional, national and international guidelines (EC directive 86/609) and were approved by the local ethical committees (French MESR N°: 00984_02). The day of confirmation of vaginal plug was defined as embryonic day zero (E0.5), and the day of birth was defined as postnatal day zero (P0). We considered this latter timepoint to be suitably late to reduce the study of mixed populations of migrating and differentiating neurons, in favour of studying just differentiating neurons, and suitably early to be before epileptic seizures begin. P0 animals were anesthetized by placing on ice for 5 minutes before decapitation. For laser capture microdissection (LCM), the whole head was immediately frozen in isopentane at -35°C for 1 minute before storing at -80°C for future cryostat cutting. For in situ hybridization and immunohistochemistry experiments, animals were perfused, and brains were fixed using 4% paraformaldehyde (PFA) in phosphate buffered saline (PBS). Brains were post-fixed in the same solution overnight. Embryonic and early postnatal brains were cryoprotected in 30% sucrose, embedded and frozen in OCT tissue freezing medium, and cut using a cryostat (Leica) at 20 µm thickness, and spread on SuperFrost II slides.
Laser capture microdissection (LCM)
Coronal brain sections (12 µm) containing the rostro-caudal hippocampus were prepared using a cryostat (Leica) maintained at -20°C and mounted on PENmembrane slides (1440–1000, PALM, Bernried, Germany) which were pre-treated by RNase ZAP (Ambion) and UV irradiated in a cell culture hood for 30 min at 254 nm. After sectioning, the slides were stored 3 4 5 6 7 8 9 10 11 12 13 14 15 16 17 18 19 20 21 22 23 24 25 26 27 28 29 30 31 32 33 34 35 36 37 38 39 40 41 42 43 44 45 46 47 48 49 50 51 52 53 54 55 56 57 58 59 60
For Peer Review
in a -80°C freezer for use within 1 week. On the day of LCM, the slides were removed from the freezer, and fixed in 70% ethanol, prepared in RNase free water for 2 min and then in 50% ethanol for 5 seconds, and stained with 1% cresyl violet (Sigma) for 1 min. Subsequently, slides were rinsed and dehydrated using serial dilutions of ethanol (50% for 5 sec, 75% for 5 sec, 100% for 30 sec). Sections were air-dried and subjected to LCM within the next 30 minutes. Samples were cut using a Zeiss LCM system (PALM Microbeam). In WT animals, the hippocampal CA3 region was microdissected in one piece. In DcxKO animals, internal stratum
pyramidale (SPI) and external stratum pyramidale (SPE) CA3 cells in the two layers were
separated. Per brain, the entire CA3 structure (bilateral) from the dorsal hippocampus was excised; for each condition 60 sections per animal (n=5) were pooled.
RNA isolation, quantity and quality assessment
Total RNA was isolated from pooled microdissected material using an RNA isolation kit (Arcturus picopure) according to manufacturer instructions. RNA for each brain was eluted in 13 µl of the elution buffer provided in the kit. RNA quantity was measured using a nanodrop spectrophotometer. RNA quality was checked using an Agilent 2100 Bioanalyzer with the RNA 6000 Pico LabChip Kit (5065-4473, Agilent Technologies, Palo Alto) according to the manufacturer’s instructions (Supp Fig 2). No statistical differences in RNA qualities (‘RIN’ values) were seen between the samples.
Linear RNA amplification and GeneChip hybridization
15 samples, corresponding to n=5 samples for each condition were processed using the Illumina TotalPrep RNA Amplification Kit (Ambion, Life Technologies) and the Whole-genome Gene Expression Direct Hybridization Assay (Illumina) according to manufacturers’ instructions. Briefly, 150-200 ng total RNA was used to prepare double-stranded cDNA using a T7 oligo (dT) primer (Illumina protocol). Reverse transcription was followed by in vitro transcription in 3 4 5 6 7 8 9 10 11 12 13 14 15 16 17 18 19 20 21 22 23 24 25 26 27 28 29 30 31 32 33 34 35 36 37 38 39 40 41 42 43 44 45 46 47 48 49 50 51 52 53 54 55 56 57 58 59 60
For Peer Review
the presence of biotinylated nucleotides. cRNA samples were hybridized to the Illumina Mouse-Ref-8 expression beadchip arrays in the appropriate buffer overnight at 58 °C. After hybridization and washes, fluorescent tagging was achieved by incubation with streptavidin-Cy3. Each array contains approximately 25,600 well-annotated RefSeq transcripts, represented as oligonucleotides attached to beads (average of 30 beads/per transcript), corresponding to over 19,100 unique genes.
Data analysis
Intra-sample normalisation
In order to compare gene expression intensities between samples, expression values within samples were first normalised to account e.g. for differences in mRNA library preparation. To this end, each log-transformed expression value was corrected by subtracting the median of the distribution of log-transformed expression values and dividing by the standard deviation of this distribution (Supp Figure 3A).
Inter-sample normalisation
Samples were distributed on two different slides, requiring a correction for potential experimental or technical differences between slides. A principal component analysis of the expression values of the 15 samples (Supp Figure 3B, C) showed that the principal eigenvector (Z[1]) can separate the samples according to their slide of origin. To normalize, we averaged the expression values of each gene across the four SPI and the four SPE samples of slide 1 respectively. We subtracted this average value from the value of the single SPI and SPE samples on slide 2 (respectively ∆Iand ∆E in Supp Figure 3D). When data points are close to zero on
both axes, this indicates that slides 1 and 2 show the same expression values. While this appears to be true for many genes, we also observed a distribution of points along a slope. For genes lying on this diagonal, this indicates a bias of the same magnitude for both SPI and SPE samples. 3 4 5 6 7 8 9 10 11 12 13 14 15 16 17 18 19 20 21 22 23 24 25 26 27 28 29 30 31 32 33 34 35 36 37 38 39 40 41 42 43 44 45 46 47 48 49 50 51 52 53 54 55 56 57 58 59 60
For Peer Review
We first performed a gene-wise correction of the SPI samples on slide 1 to be compatible with corresponding samples on slide 2. The corrected value for each gene j is obtained as the sum of the original value and an estimate of the bias error. The estimate of the bias is based on the bias of SPE (since we assume this to be independent of the sample, i.e. affecting intensities in the same way on the two slides) weighted with a constant wI.
The correction for SPI samples is:
with:
where I and E represent the intensity of gene j on the slide indicated by the superscript (the subscript of the sample on the slide is omitted for better readability). The constant wI was
determined by minimizing the error between the intensities of the genes on two different slides according to a least square criteria (as in the equations below).
For SPI:
For SPE:
Similarly, the SPE samples were corrected on slide 1 with the bias estimated from SPI and thus all samples were aligned to the samples as found on slide 2.
After corrections, principal component analysis showed that SPI and SPE samples from slide 2 respectively cluster with the SPI and SPE samples from slide 1.
Finally the linear model fit of the LIMMA package (86) was applied on these bias-corrected expression values in order to detect the differentially expressed genes pertaining to the three conditions, using a t-test. The Benjamini-Hochberg false discovery rate control (with
P = 0.05) was applied to correct for multiple testing. Results are presented as ratios between
the conditions. j E E I slide j slide corr j
I
wI
, , , 1= 1+ ⋅∆(
1)
2 , slide j slide j j E =averageE −E ∆(
)
(
)
−∑
j slide corr j slide j wEE
averageE
2 , 1 2 min 3 4 5 6 7 8 9 10 11 12 13 14 15 16 17 18 19 20 21 22 23 24 25 26 27 28 29 30 31 32 33 34 35 36 37 38 39 40 41 42 43 44 45 46 47 48 49 50 51 52 53 54 55 56 57 58 59 60For Peer Review
Pathway analysis and functional category clustering
A global overview of the biological processes and enriched functional clusters in SPI and SPE lists was obtained using a Database for Visualization and Integrative Discovery (DAVID) (Dennis et al., 2003). The following sources were used: COG-Ontology, SP-PIR-Keywords, UP-SEQ-Feature, GOterm-BP-FAT, GOterm-CC-FAT GOterm-MF-FAT, KEGG pathways, and INTERPRO protein information resources. Analysis was performed using the default settings (medium stringency); enrichment scores > 1.5 were considered significant.
For further specific questions, Ingenuity Systems Pathway Analysis (IPA) (Ingenuity Systems, Mountain View, CA; www.ingenuity.com) was used to define enriched functional categories and pathways specific to the developing central nervous system.
Quantitative PCR (qPCR) validation
Linear amplified LCM RNAs (Ambion Life Technologies or Nugen Ovation kit) were used to prepare cDNA. Real time qPCR assays using the SYBRgreen method followed MIQE guidelines (87). Gene-specific primers were designed using Primer Express Software (PE Applied Biosystems, Supp Table 8), except for Atp1b1, which were purchased from Sigma (KSPQ12012, primer set 1). Standard curves were generated from assays made with serial dilutions of cDNA to calculate PCR efficiencies (90 % < efficiency < 105%, with r2≥ 0.998). Threshold cycles (Ct) were transformed into quantity values using the formula (1+Efficiency) -Ct. Only means of triplicates with a coefficient of variation of less than 10 % were analysed.
Inter-plate variation was below 10 %. Values were normalized to the geometric mean of 3 Normalization Factors (NF) found to be the most stable through all samples using the geNorm approach. These were ATP synthase, H+ transporting mitochondrial F1 complex, beta subunit (Atp5b), eukaryotic translation initiation factor 4A2 (Eif4a2) and prosaposin (Psap). Average 3 4 5 6 7 8 9 10 11 12 13 14 15 16 17 18 19 20 21 22 23 24 25 26 27 28 29 30 31 32 33 34 35 36 37 38 39 40 41 42 43 44 45 46 47 48 49 50 51 52 53 54 55 56 57 58 59 60
For Peer Review
values ± standard deviations were compared for 3-5 animals of each genotype. Ratios were calculated and P values using the Student t-test.
mRNA in situ hybridization
Specific antisense RNA probes (see Supp Table 8) for Col6a1, Necab2, St18 and Grp genes were used for in situ hybridization analyses. Equivalent sense probes were also generated for comparison. Digoxygenin (DIG) probes were synthesized with a labeling kit according to the manufacturer's instructions (Roche Diagnostics). Following a protocol adapted from Bally-Cuif and Wassef (1994) (88), frozen cryostat sections were rinsed 3 × 5 min in PBS, postfixed in 4% PFA, rinsed in PBS 2 × 5 min, and treated with proteinase K (10 μg/ml) for 10 min. Sections were incubated in PBS + glycine (2 mg/ml), rinsed in PBS, and postfixed in a mixture of 4% PFA, followed by a rinse in PBS. Tissue sections were hybridized at 70°C overnight with the DIG-labeled probes diluted 1/100 in hybridization buffer (50% deionised formamide, 10% dextran sulphate, 1 mg/ml Yeast RNA, 1x Denhardt’s solution). The next day, sections were sequentially washed in 2X saline sodium citrate (SSC) Tween 0.1% at 70°C then in maleate buffer (Maleic acid 100 mM, NaCl 150 mM, 0.1% Tween20, pH 7.5) at room temperature. For immunological detection of DIG-labeled hybrids, sections were first blocked (2% blocking reagent-Roche Applied Science, cat. 1096176, 20% sheep serum in maleate buffer) and then incubated overnight at 4°C in the same solution containing sheep anti-DIG-alkaline phosphatase-conjugated Fab fragments (Roche Diagnostics) diluted 1/2000. The following day, sections were washed 4 × 15 min in maleate buffer and 30 min in NTMT buffer (100 mm NaCl, 100 mm Tris-HCl, pH 9.5, 50 mm MgCl2, 0.1% Tween 20). The alkaline phosphatase
chromogen reaction was performed in NTMT buffer containing 100 mg/ml nitroblue tetrazolium (Roche Diagnostics) and 50 mg/ml 5-bromo-4-chloro-3-indolyl phosphate (Roche) at room temperature for 1-7 days and stopped with PBS. Sections were mounted on glass slides, 3 4 5 6 7 8 9 10 11 12 13 14 15 16 17 18 19 20 21 22 23 24 25 26 27 28 29 30 31 32 33 34 35 36 37 38 39 40 41 42 43 44 45 46 47 48 49 50 51 52 53 54 55 56 57 58 59 60
For Peer Review
dried, counter-colored using nuclear fast red and dehydrated in graded ethanol solutions, and coverslipped with Vectamount (Vector Laboratories).
Birthdate studies
Pregnant mice were injected intraperitoneally (i.p) four times with 2 hour intervals at E12.5 with 100 mg/kg bromo deoxy uridine (BrdU), or once with 200 mg/kg BrdU at E16.5. Animals were sacrificed at P21-24. To determine the number of BrdU-positive cells, every tenth section of 20 μm (200 μm intervals) of the dorsal hippocampus from both cerebral hemispheres was processed for immunohistochemistry (n = 3-5 animals per genotype per BrdU injection date).
Immunohistochemistry
Cryostat sections at 20 µm thickness were washed in PBS 1X, and incubated in 2 N HCl at 37°C for 40 min to denature DNA. Sections were thoroughly washed in PBS 1X to neutralize the acid, and incubated in blocking solution (0.1 M PBS, 0.3% Triton X-100, 2% normal goat serum) for two hours at room temperature. This was followed by incubation with the primary antibodies; anti-BrdU (Rat, clone ICR1, ABD serotec 1:100), anti-NeuN (Mouse, clone A60 Millipore, 1:200); diluted in blocking solution, overnight at 4°C. Brain sections were then washed three times in PBS 1X and incubated with fluorochrome-conjugated secondary antibodies (1:400, Invitrogen) diluted in blocking solution containing Hoechst fluorescent nuclear counterstain (1:5000). Sections were mounted using fluoromount G (Electron Microscopy Devices) and cover-slipped.
Image acquisition and quantification
3 4 5 6 7 8 9 10 11 12 13 14 15 16 17 18 19 20 21 22 23 24 25 26 27 28 29 30 31 32 33 34 35 36 37 38 39 40 41 42 43 44 45 46 47 48 49 50 51 52 53 54 55 56 57 58 59 60
For Peer Review
Bright-field in situ hybridization images were acquired with a Coolsnap CCD camera fitted to a Provis Olympus Microscope using 4X, 10X and 20X objectives (magnification/numerical aperture).
Fluorescent BrdU and NeuN immunostained sections were acquired using SP5II Leica confocal microscope using a 40X objective. BrdU-labelled cell quantification was performed using Icy software (Version 1.5.4.2) and the Spot Detector module (89). BrdU-labelled cells were counted using the following criteria: 1. Threshold parameters were optimised for inclusion of only strongly labelled BrdU cells, and identical settings were applied for counting of all images. 2. Co-immunostaining for both BrdU and NeuN was required to exclude astrocytes. Division of the hippocampal CA3 subfields in coronal brain sections into CA3a, CA3b and CA3c was performed as described previously (90). The WT pyramidal cell layer was divided in half on the radial axis, described as “inner” and “outer”, for comparison to the KO bilayers.
Acknowledgements
We thank Nicolas Narboux-Neme, Sylvie Thomasseau, Katia Boutourlinsky, Richard Belvindrah and Gael Grannec for technical help and advice, Evelyne Souil for initial advice concerning LCM, David Gentien for advice and use of the Institut Curie platform for Picochip analyses and Dominique Wendum for the use of the Saint Antoine LCM platform. We thank the Inserm Avenir program, the French Agence National de la Recherche (ANR- 08-MNP-013), the European Union's Seventh Framework Programme for research, technological development and demonstration under grant agreement no: Health-F2-602531-2013, the CNRS, the Fondation Bettencourt Schueller and the Fondation Jérôme Lejeune for grant support to FF. We thank University Paris 6 and An-Najah University, Palestine for support to RKN. We thank the IFM imaging and animal house facilities. We thank the Ile de France region for support of imaging and animal house facilities and the CNRS TAAM for mouse housing. MS was funded 3 4 5 6 7 8 9 10 11 12 13 14 15 16 17 18 19 20 21 22 23 24 25 26 27 28 29 30 31 32 33 34 35 36 37 38 39 40 41 42 43 44 45 46 47 48 49 50 51 52 53 54 55 56 57 58 59 60
For Peer Review
by the European project DESIRE. FF and MS are associated with the BioPsy Labex project and the Ecole des Neurosciences de Paris Ile-de-France network.
Conflict of Interest Statement. None declared.
3 4 5 6 7 8 9 10 11 12 13 14 15 16 17 18 19 20 21 22 23 24 25 26 27 28 29 30 31 32 33 34 35 36 37 38 39 40 41 42 43 44 45 46 47 48 49 50 51 52 53 54 55 56 57 58 59 60