HAL Id: hal-03217679
https://hal.archives-ouvertes.fr/hal-03217679
Submitted on 6 May 2021HAL is a multi-disciplinary open access
archive for the deposit and dissemination of sci-entific research documents, whether they are pub-lished or not. The documents may come from teaching and research institutions in France or abroad, or from public or private research centers.
L’archive ouverte pluridisciplinaire HAL, est destinée au dépôt et à la diffusion de documents scientifiques de niveau recherche, publiés ou non, émanant des établissements d’enseignement et de recherche français ou étrangers, des laboratoires publics ou privés.
Drought-induced weakening of growth–temperature
associations in high-elevation Iberian pines
J. Diego Galván, Ulf Büntgen, Christian Ginzler, Håkan Grudd, Emilia
Gutiérrez, Inga Labuhn, J. Julio Camarero
To cite this version:
J. Diego Galván, Ulf Büntgen, Christian Ginzler, Håkan Grudd, Emilia Gutiérrez, et al.. Drought-induced weakening of growth–temperature associations in high-elevation Iberian pines. Global and Planetary Change, Elsevier, 2015, 124, pp.95-106. �10.1016/j.gloplacha.2014.11.011�. �hal-03217679�
1
Drought-induced weakening of growth-temperature associations
1in a high-elevation pine network across the Pyrenees
23
J. Diego Galván1,2*, Ulf Büntgen2, Christian Ginzler2, Håkan Grudd3, Emilia Gutiérrez4,
4
Inga Labuhn3,5 and J. Julio Camarero4,6
5 6
1
Instituto Pirenaico de Ecología (IPE-CSIC), Avda. Montañana 1005, Apdo. 202, E-50192 Zaragoza,
7
Spain
8
2Swiss Federal Research Institute WSL, Zuercherstrasse 111, 8903 Birmensdorf, Switzerland
9
3Bolin Centre for Climate Research, Department of Physical Geography and Quaternary Geology,
10
Stockholm University, 10691 Stockholm, Sweden.
11
4Departament d’Ecologia, Universitat de Barcelona, Avda. Diagonal 643, 08028 Barcelona, Spain
12
5
Laboratoire des Sciences du Climat et de l'Environnement (LSCE), Gif-sur-Yvette, France.
13
6ARAID, Instituto Pirenaico de Ecología (IPE-CSIC), Avda. Montañana 1005, Apdo. 202, E-50192
14
Zaragoza, Spain
15 16
*Corresponding author at: Instituto Pirenaico de Ecología (IPE-CSIC), Avda.
17
Montañana 1005, Apdo. 202, E-50192 Zaragoza (Spain). Tel. (+34) 695053174 / (+34)
18
976 369 393, fax 974 363 222, e-mail: [email protected] (J. Diego Galván)
19
20
2 ABSTRACT
22
The growth/climate relationship of theoretically temperature-controlled high-elevation
23
forests has been demonstrated to weaken over recent decades. This is likely due to new
24
tree growth limiting factors, such as an increasing drought risk for ecosystem
25
functioning and productivity across the Mediterranean Basin. In addition, declining tree
26
growth sensitivity to spring temperature may emerge in response to increasing drought
27
stress. Here, we evaluate these ideas by assessing the growth/climate sensitivity of 1500
28
tree-ring width (TRW) and 102 maximum density (MXD) measurement series from 711
29
and 74 Pinus uncinata trees, respectively, sampled at 28 high-elevation forest sites
30
across the Pyrenees and two relictic populations of the Iberian System. Different
31
dendroclimatological standardization and split period approaches were used to assess
32
the high- to low-frequency behaviour of 20th century tree growth in response to
33
temperature means, precipitation totals and drought indices. Long-term variations in
34
TRW track summer temperatures until about 1970 but diverge afterwards, whereas
35
MXD captures the recent temperature increase in the low-frequency domain fairly well.
36
On the other hand summer drought has increasingly driven TRW along the 20th century.
37
Our results suggest fading temperature sensitivity of Iberian high-elevation P. uncinata
38
forest growth, and reveal the importance of summer drought that is becoming the
39
emergent limiting factor of tree ring width formation in many parts of the
40
Mediterranean Basin.
41 42
Key-words: climate change; drought; growth response; high-elevation forest; Pyrenees;
43
summer temperature
44 45
3
Highlights:
46
• 1500 TRW and 102 MXD series were collected at 30 sites across the Pyrenees
47
• Growth/climate relationships were assessed on high- to low-frequency domains
48
• Summer temperatures and MXD increased after the 1970s, whereas TRW decreased
49
• Warming-induced drought constrains on TRW formation increased along the 20th
50
century
51 52
4 1. Introduction
53
Trees growing in cold-limited environments such as high-latitude forests and the arctic
54
and alpine ecotones can record temperature variations in their annual ring width (TRW)
55
and maximum latewood density (MXD) (Fritts, 2001). In fact, temperature might be the
56
main climatic driver of tree growth and thus it constrains wood formation during overall
57
short growing seasons (Körner, 2012). Old growing treeline species, are therefore
58
regarded as reliable proxy archives that enable annually resolved temperature
59
reconstructions to be continuously developed for several centuries to millennia (Briffa
60
et al., 1990; Esper et al., 2002). At the European-scale, several examples from the
high-61
northern latitudes in Fennoscandia (Briffa et al., 1990; Grudd, 2008), and higher
62
elevations along the Carpathian arc (Büntgen et al., 2007, 2013; Popa and Kern, 2008)
63
and the Alps (Rolland et al., 1998; Büntgen et al., 2005, 2006; Corona et al., 2010) have
64
demonstrated the palaeoclimatic potential of tree rings.
65
Mid-latitude areas are, however, affected by different climatic influences
66
derived from tropical air-masses moving towards the poles and polar air-masses moving
67
towards the equator; this causes most of the mid-latitude areas being alternately
68
influenced by arid and humid conditions, with periodic droughts. Complex
69
growth/climate relationships are therefore known for areas like the Mediterranean Basin
70
or the Sierra Nevada in California (Tardif et al., 2003; Bunn et al., 2005; Carrer et al.,
71
2010; Büntgen et al., 2012). In these ecosystems, daily to seasonal precipitation changes
72
can mediate intra and inter-annual patterns of forest growth, and summer drought can be
73
strong enough to even interrupt cell formation (Nicault et al., 2001; De Luis et al.,
74
2007). It remains unknown if such drought-induced growth responses also occur in
75
high-elevation forests of the Mediterranean mid-latitudes and may even affect
5
saturated upper treeline sites. If true, such hydroclimatic stressors would question the
77
consistency of temperature reconstructions based on tree rings from high-elevation areas
78
at mid-latitudes.
79
Spatiotemporal instability in growth/climate relationships, the so-called
80
divergence phenomena (D’Arrigo et al., 2008), may indeed be magnified by predicted
81
future drought across the Mediterranean Basin (Lebourgeois et al., 2012), which would
82
dampen the temperature control of tree growth. Testing the hypothesis of recently more
83
complex growth/climate relationships in Mediterranean mountain forest ecosystems is,
84
however, complicated by the scarcity of high-elevation sites that were
temperature-85
controlled in this area (Körner, 2012). The Pyrenees constitutes the only mountain
86
system where undisturbed temperature-driven upper treelines can be found south of the
87
Alpine arc.
88
Here we seek to assess if the growth/climate relationship in a high-elevation
89
network of Pinus uncinata forest sites across the Pyrenees changed over the last century
90
and, if so, to pinpoint the relevant drivers. We compile TRW chronologies from 30 sites
91
and MXD measurements from six of these sites between 1750 and 2451 m asl. Various
92
tree-ring detrending and chronology development techniques, together with split-period
93
approaches and multiple intra-annual intervals are evaluated to assure that the observed
94
associations between tree growth and climate are not artificially induced or
95
spatiotemporally biased.
96 97
2. Materials and methods 98
2.1. Study species and sites 99
6
Pinus uncinata Ram. is a long-lived, slow-growing and shade-intolerant conifer with a
100
large ecological amplitude concerning topography and soil type (Ceballos and Ruiz de
101
la Torre, 1979). In this species ca. 80% of the annual width is formed during June and
102
July and latewood formation lasts from July up to October (Camarero et al., 1998).
103
Warm autumn and spring temperatures before and during ring formation enhance P.
104
uncinata radial growth in Pyrenean forests (Tardif et al., 2003). We sampled 30 P.
105
uncinata sites of which 27 sites are located in the Pyrenees, one site is in the
Pre-106
Pyrenean Sierra de Guara and two southern relict populations are located in the Iberian
107
System (Fig. 1). Data cover the whole geographical range of the species in the Iberian
108
Peninsula and thus capture most of the ecological variability experienced by this species
109
(Table 1). Most of the Pyrenean sites (18 sites) were located within or near protected
110
areas, ensuring that these populations are not likely to have been logged for much of the
111
20th century. Specifically six sites were sampled within or near the Ordesa y Monte
112
Perdido National Park (PNOMP; 42º40’N, 00º03’E; established in 1918), and twelve
113
sites were sampled in the Aigüestortes i Estany de Sant Maurici National Park area
114
(PNAESM; 42º35’N, 00º57’E; established in 1955). Pyrenean P. uncinata forests are
115
usually low-density open-canopy stands located in steep and elevated sites forming
116
isolated patches near the alpine treeline. The macroclimate of the Pyrenees is strongly
117
influenced by east–west and north–south gradients with increasing Mediterranean
118
conditions (e.g. warm and dry summers) eastwards and southwards, whereas continental
119
conditions (e.g. cold winters) prevail in the Central Pyrenees. These diverse climatic
120
influences explain the high climatic heterogeneity of this area (López-Moreno et al.,
121
2008). Mediterranean summer drought is more prevalent at PNOMP than at PNAESM
122
sites (Balcells and Gil-Pelegrín, 1992). Mean annual temperature and total precipitation
7
in the studied sites ranged from 2.0 to 4.9 ºC and from 1200 to 2000 mm, respectively,
124
with January and July as the coldest (mean -2.0 ºC) and warmest (mean 12.5 ºC) months
125
respectively (Camarero, 1999). The relict populations of Teruel and Soria and the
126
Prepyrenean site Guara are subjected to typically Mediterranean conditions such as
127
warm and dry summers.
128 129
2.2. Field sampling and dendrochronological methods 130
We sampled 711 living trees between 1994 and 2011. At each site, five to 65 dominant
131
(i.e. with crowns above the general level of the canopy) trees (mean ± SD = 24 ± 14
132
sampled trees per site) were randomly selected. The number of sampled trees per site
133
depended on the availability of suitable trees within each site. All trees were cored with
134
a Pressler increment borer taking two or three cores per tree (n = 1500 cores, mean ±
135
SD = 47 ± 27 sampled cores per site). Each core was mounted and sanded with
136
progressively finer grain until tree rings were clearly visible (Stokes and Smiley, 1968).
137
Samples were then visually cross-dated and measured to a precision of 0.01 mm using a
138
LINTAB measuring device (Rinntech, Germany). Cross-dating was evaluated using the
139
program COFECHA (Holmes 1983), which calculates cross correlations between
140
individual series of each core and a master chronology. For the MXD measurements, we
141
cored a subsample (n = 74 trees) by taking cores perpendicular to the stem from 6 sites
142
(4 sites located in PNAESM plus 2 sites from PNOMP) with a thicker Pressler
143
increment borer (10 mm diameter); MXD cores were glued onto wooden supports and
144
thin wooden laths (1.2 mm) were cut with a twin-bladed saw. Density was measured
145
with an Itrax MultiScanner from Cox Analytical Systems (http://www.coxsys.se), where
146
laths are scanned using a focused high-energy x-ray beam. The radiographic image is
8
analyzed with the software WinDendro (Regent Instruments, Canada), which performs a
148
light calibration of the grey values using a calibration wedge (Grudd, 2008).
149 150
2.3. Tree-ring data and detrending 151
Since we only collected MXD data from the Pyrenees (Tables 1 and 2), we combined all
152
the MXD series in one single chronology set called Pyrenees. For its part, TRW was
153
assigned three different chronology subsets depending on the geographical location of
154
the sampled sites: (i) the whole network of 30 sampled sites, (ii) the 27 Pyrenean sites,
155
and (iii) the 15 PNAESM sites; hereafter called AllSites, Pyrenees and Aigüestortes
156
subsets respectively. As explained before, PNOMP is more influenced by
157
Mediterranean and drier conditions than PNAESM; therefore, and in order to assess
158
possible Mediterranean drought influences, we used an additional TRW subset called
159
Ordesa, derived from a compilation of the series coming from the six PNOMP sites.
160
Apart from the geographical reason, the Aigüestortes subset was taken considering also
161
the relative robust convergence of the principal components scores of the PNAESM
162
sites in the two dimensional space of a principal component analysis, based on the
163
covariance matrix of the chronologies of all sampled sites, and considering their
164
common period 1901-1994 (see yellow symbols in Figure A1). The first and second
165
principal components explained 47.2% and 8.1% of the whole site growth variability,
166
respectively. Sites near the distribution limits of the species (e.g. GU, TE, CN, PA) are
167
arranged at relatively lower altitudes (i.e. PC1 scores). Although the chronologies
168
showed different loadings with the PC1, all of them had positive correlations within it,
169
showing that they shared a common variance.
170
9
To remove tree-age related, non-climatic growth trends from the raw TRW and
172
MXD measurement series (Cook and Kairiukstis, 1990), and to assess the effects of
173
different standardization techniques on the final chronology shape, we applied several
174
detrending methods using the ARSTAN program (Cook and Holmes, 1986).
175
Specifically, we preserved variability at inter-annual to multi-decadal scales detrending
176
each TRW and MXD individual series by means of cubic smoothing splines with 50%
177
frequency-response cutoffs equal to 150 and 300 years (Cook and Peters, 1981). A
178
negative exponential function detrending was also applied together with an alternative
179
linear regression of slope of any sign (detrending called hereafter ‘negative exponential
180
1’) or with an alternative linear regression of negative slope (‘negative exponential 2’).
181
We also applied the age-aligned regional curve standardization (RCS; Esper et al.,
182
2003) for preserving inter-annual to centennial-scale variability.
183
For these different detrendings, dimensionless indices were calculated as
184
residuals from the estimated growth curves after power transformation (pt) of the raw
185
measurements (Cook and Peters, 1997), and as ratios after using the raw measurements
186
without any transformation (nt). Summarizing, we applied ten different detrending
187
methods (see table A1). We performed a variance stabilization technique to every
188
chronology for minimizing the putative effects of changing sample size throughout time
189
(Frank et al., 2007). Mean chronologies were then calculated using a bi-weight robust
190
mean (Cook, 1985). We applied the Expressed Population Signal (EPS) calculated over
191
30-year windows lagged by 15 years to estimate signal strength of these records
192
(Wigley et al., 1984). Throughout the paper, unless otherwise stated, we refer to TRW
193
chronologies derived from the whole sampled network (i.e. AllSites TRW subset).
194 195
10
2.4. Instrumental target data and growth-climate response analyses 196
Monthly temperature (mean, maximum and minimum) and precipitation data
197
(CRUTS3.10; Harris et al., 2013) were used for growth/climate response analysis. We
198
considered 0.5° resolution grid-box data covering the different sampled sites. We also
199
used the standardized precipitation evapotranspiration drought index (SPEI;
Vicente-200
Serrano et al., 2010), calculated from the CRUTS3.20 dataset. Drought conditions are
201
influenced by factors like temperature, relative humidity, evapotranspiration, wind
202
speed, etc. The Standardized Precipitation Index (SPI) only takes on account the
203
precipitation, thus neglecting the importance of other influential variables. The use of
204
drought indices that include temperature data in their formulation, such as the Palmer
205
Drought Severity Index (PDSI) seems to be preferable to identify warming-related
206
drought impacts on ecological systems (Vicente-Serrano et al. 2010), specially taking
207
on account the global temperature increase of recent decades. However, drought is a
208
multi-scalar phenomenon since the time period from the arrival of water inputs until the
209
water is available differs considerably (McKee et al. 1993). Thus, the time scale over
210
which water deficits accumulate becomes important. The PDSI lacks the multi-scalar
211
character of the SPI; the SPEI, first proposed by Vicente-Serrano et al. (2010)
212
overcomes this limitation, combining in its formulation the sensitivity of PDSI to
213
changes in evaporation demand caused by temperature with the multi-temporal nature
214
of the SPI. Negative (positive) SPEI values correspond to dry (wet) conditions.
215
All the TRW and MXD chronologies (derived from the different detrendings
216
and subsets) were correlated against monthly and seasonal means of maximum, mean,
217
and minimum temperatures and totals of precipitation. We restricted the analyses to the
218
period 1901-2009, which covers the available CRU data period. We used monthly data
11
from October of the previous year to September of the current year and seasonal means
220
performed from March to September, including therefore the growing season. We also
221
correlated the chronologies to the SPEI index for the 12 months of the year at different
222
time scales from 1 to 24 accumulated months, covering the same period. In order to
223
assess the temporal stability in the growth/climate relationships along the second half of
224
the 20th century, we performed the correlations with climate in two independent 40-year
225
subperiods: 1930-1969 and 1970-2009. We quantified spatial correlation fields between
226
the tree-ring series and monthly and seasonal climatic variables for different periods
227
using the web Climate Explorer (http://climexp.knmi.nl). We further evaluated
228
instability in the growth/climate relationship by calculating 31-year moving correlations
229
between growth (TRW, MXD) and climate variables (temperature, SPEI).
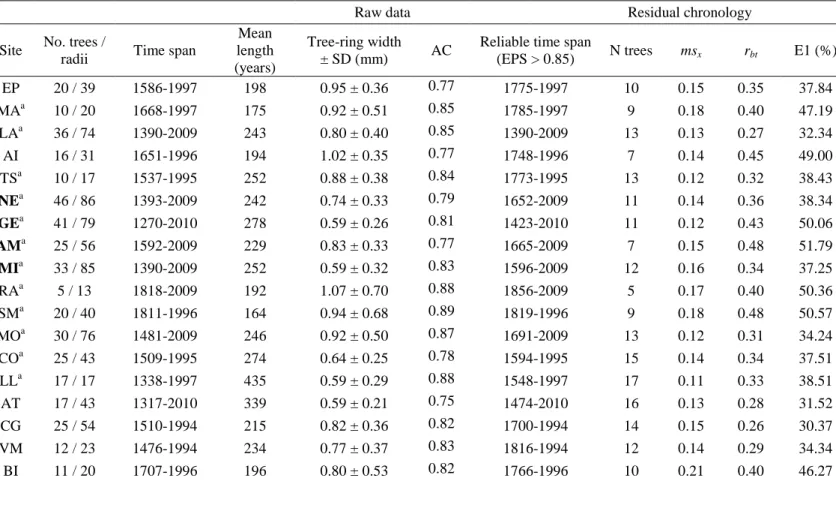
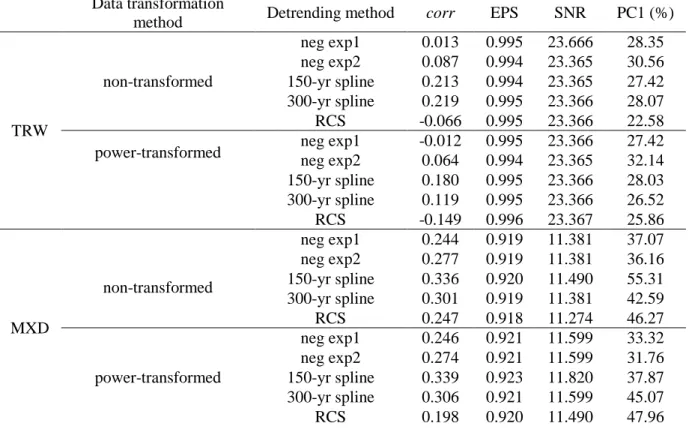
230 231 3. Results 232 3.1. Chronology characteristics 233
TRW (MXD) chronologies span from 1270 to 2010 AD (1407 to 2009 AD), with a
234
mean length of 240 (192) years. TRW (MXD) series have a mean ± SD annual value of
235
0.66 ± 0.11 mm (0.77 ± 0.39 g cm-3) and a series inter-correlation of 0.44 (0.40). In both
236
TRW and MXD, the eight different spline and exponential detrendings showed a very
237
similar shape (Fig. A2); hence we averaged them in a single chronology, hereafter
238
abbreviated as TRWmean and MXDmean. Raw and RCS TRW chronologies show the
239
typical negative exponential trend until ~1450; from then on, RCS chronologies grow
240
with a long and steady positive trend (Fig. 2a). From the 1950s onwards, all the TRW
241
chronologies decline until the present. Raw and RCS MXD chronologies show a
242
negative trend until ~1700, and then they rise up to the 1950s before decreasing again.
12
Since the 1970s all the MXD chronologies start trending upwards up to the present.
244
(Fig. 2b). These results are essentially the same as the ones observed in the Pyrenees
245
and Aigüestortes subsets (not shown). This MXD pattern is related to the temperature
246
trends found over the 20th century in Europe: increasing temperatures until the 1950s
247
followed by a decrease until the 1970s and a second increase from the 1970s until
248
nowadays (IPCC 2013). These patterns are consequently observed in series of tree ring
249
proxies (e.g. MXD) of temperature sensitive sites like the Alps, Scandinavia or the
250
Pyrenees, and also in the temperature series of their subsequent climatic reconstructions
251
(Corona et al. 2010; Büntgen et al. 2008a, 2011; Dorado-Liñán et al. 2012). The RCS
252
chronologies highlight the decrease in TRW in the transition between the warm
253
Medieval Climatic Anomaly and the cold Little Ice Age (LIA) starting in 1300 AD and
254
lasting until 1850 AD, where temperatures started to increase again (Moreno et al.,
255
2012). Both TRW and MXD chronologies display a valley shape in 1816 following the
256
eruption of Mount Tambora in 1815, which caused the “year without summer” (Trigo et
257
al., 2009). There is another sharp decrease in TRW and MXD around 1700 AD. The
258
decrease in growth in the last 50 years is not unprecedented and lower growth rates
259
occurred in some periods over the LIA, for instance during the fifteenth century (Fig.
260
2a). Expressed population signal (EPS) and signal-to-noise ratio (SNR) are very
261
consistent among the 10 different detrendings (Table 3). TRW (MXD) chronology stays
262
above the 0.85 EPS threshold since 1500 (1777) AD (Figs. A3 and A4). Mean segment
263
lengths of the TRW site chronologies show how aging trees display a decreasing growth
264
rate (Fig. A5), and proves the existence of a single biological-growth population
265
portrayed by the sampled sites (Esper et al., 2003).
266 267
13 3.2. Growth-climate responses patterns 268
TRW and MXD are mainly influenced by previous-year November, May and
269
September temperatures (Fig. 3). Similar results were found for the Pyrenees,
270
Aigüestortes and Ordesa subsets (not shown). Among the different detrendings applied,
271
RCS shows a smaller or even negative correlation between TRW chronologies and
272
temperature . This indicates that a divergent behaviour in the recent decades between
273
TRW and temperature is more evident when using RCS chronologies than with the
274
other detrendings.
275
MXD displays higher correlations with temperature than those for the TRW.
276
Monthly correlation analysis highlights the main influences of previous-year November
277
and current-year May, June and September temperatures on MXD, with May being the
278
most prominent month (Fig.3b). Contrary to the TRW, the different MXD detrendings
279
display the same sign and behaviour in their climate correlation functions (Table 3),
280
although RCS detrending brings the highest correlations with temperature for MXD in
281
the second subperiod. This, and the fact that TRW RCS chronologies record a divergent
282
behaviour with temperature more clearly than other detrendings, caused us to focus our
283
analyses mainly on the RCS chronologies.
284
Growth/precipitation correlations are found to be minor compared with those
285
found for temperature, in both TRW and MXD data sets (not shown). Contrastingly,
286
SPEI gives higher correlations than precipitation (Fig. 4). The main drought driver of
287
TRW of Iberian P. uncinata forests is the SPEI for June and July accumulated at scales
288
from one to two months, specially for the period 1901-2009 and the sub-period
1930-289
1969 (Fig. 4). As we pointed out before, PNOMP area has stronger Mediterranean
290
influences than PNAESM area. Correspondingly, TRW from the Ordesa subset shows
14
this Mediterranean background in the TRW-SPEI relationship (using SPEI data
292
covering the PNOMP area), where the influence of drought on growth extends until
293
August and, in general, correlation coefficients with summer SPEI are stronger than in
294
the case of Aigüestortes and Pyrenees subsets, consecutively (Fig. A6). These
295
observations are consistent among the different detrending methods (Fig. A6 and Fig.
296
A7).
297
In the case of MXD for the first subperiod, the highest negative (~ -0.4) and
298
positive (~ 0.2-0.3) correlations occur with the May SPEI for 4 to 5 months, and with
299
July SPEI at 2-month scale, respectively. This greatly changes for the second subperiod,
300
when the highest positive MXD/SPEI correlations (~0.4) are found in the period from
301
previous September to current January (Fig. 4). Both TRW and MXD showed higher
302
correlations with SPEI in the second than in the first subperiod, which indicates an
303
increase in drought influence on growth in recent decades.
304
Finally, spatial correlations displayed between MXD values and temperature
305
were stronger and more spatially coherent across SW Europe than those observed with
306 TRW (Fig. A8). 307 308 3.3. Proxy-temperature divergence 309
Our results show a temporal instability of the growth/climate relationships of P.
310
uncinata forests along the 20th century. In the low-frequency domain, divergent trends
311
for TRW and maximum temperature are found since the 1970s (Fig. 5b), while TRW
312
displays a convergent trend with SPEI (Fig. 5e). Similar results are observed for the
313
Pyrenees and Aigüestortes subsets (not shown). For its part, MXD low-frequency trend
15
parallels with the low-frequency temperature warming, which started in the 1970s (Fig.
315
6b), but it diverges from SPEI (Fig. 6e).
316
A steady negative (positive) trend in the moving correlation record is displayed
317
with temperature (SPEI) in the low-frequency range (Figs. 5b,e). In the high-frequency
318
domain, stronger correlations with temperature are obtained after the 1950’s (Fig. 5c),
319
and a negative trend in the moving correlations with SPEI is found (Fig. 5f). MXD
320
moving correlations display an increase with temperature and a decrease with SPEI in
321
low-frequency domains (Fig. 6b,e). Low-frequency moving correlations in TRW seem
322
more stable than in MXD, where we can observe cyclic increases and decreases in the
323
moving correlations along the 20th century (Fig. 6b,e).
324
Focusing on the growing season, May temperature shows a direct correlation
325
with TRW and MXD while summer months usually show a smaller or negative one
326
(Fig. 3). To find out if the divergence phenomenon is due to a loss of temperature
327
sensitivity or to an increase in this negative summer drought effect, we repeated the
328
moving correlation analyses with summer (June-July) and May temperatures. Results
329
are very similar to the ones obtained with the maximum temperature of May-September
330
period (Fig. A9 and A10), again highlighting a TRW-temperature divergence and also a
331
recent increase in the correlation between MXD and temperature.
332
To gain insight into potential differences in the divergence occurrence along the
333
altitude we compared high- (>2150 m, 15 sites, 940 series) and low-elevation (< 2150
334
m, 15 sites, 572 series) TRW chronologies with June-July SPEI and MJJAS maximum
335
temperature series. In both high- and low-elevation chronologies the divergence
336
phenomenon with temperature in the low-frequency range is clear and the convergent
337
trend with MXD in the low-frequency range too (Figures A11 and A12). In the
16
elevation chronology the low-frequency divergence with temperature seems to appear
339
shortly delayed compared with the low-elevation chronology.
340 341
4. Discussion 342
Our results show low frequency trend offsets between the TRW series and temperature
343
records since the second half of the 20th century (Fig. 5b). This suggests a weakening of
344
the theoretically temperature-sensitive proxies (TRW) to capture recent warming trends
345
such as those observed since the 1970s. Such ‘divergence’ phenomena between climatic
346
and dendrochronological variables have also been displayed in other
temperature-347
constrained high-elevation and boreal forests (Büntgen et al., 2006; Wilmking et al.,
348
2004, 2005; D’Arrigo et al., 2004; Briffa et al., 1998). Nevertheless, this low-frequency
349
offset between growth and temperature is not found in the high-frequency (i.e.
year-to-350
year) climate sensitivity of our TRW series, which increasingly parallels temperature
351
anomalies along the 20th century (Fig. 5c). Hence, the trend offset between the TRW
352
series and temperature records is mainly restricted to the long-term trend, whereas
353
coherency between productivity and temperature persists in the high-frequency
(year-to-354
year) domain.
355
Spring cambial resumption in P. uncinata starts in May, and typically the tree
356
growth is faster or slower depending mainly on the temperatures prevailing during this
357
month. The moving correlations between May temperatures and TRW highlight that
358
this spring temperature sensitivity is fading during recent decades (Fig. A9b). Contrary
359
to TRW, MXD low-frequency positive trends follow the warming trend started in the
360
1970s. This is in agreement with data from the European Alps that suggest that the
361
divergent behaviour is expected to occur in TRW more often than in MXD (Büntgen et
17
al., 2006). Furthermore, MXD shows higher correlations with temperature over the
363
growing season compared to TRW, which is in agreement with former observations
364
from the same area and species (Büntgen et al., 2010). This can be explained because
365
TRW is more strongly autocorrelated, incorporating previous-year climatic and
366
ecological conditions, together with ecological carryover effects and temperature
367
forcing over a wider (seasonal or annual) time window (Fritts, 2001). In fact, our results
368
show a significant correlation between TRW and previous November temperatures,
369
which indicates that warmer conditions in late autumn might enhance carbohydrates
370
storage and synthesis used for the formation of earlywood (i.e. increase of TRW) the
371
following growing season.
372
The divergence phenomenon has been attributed to various causes including
373
nonlinear growth-climate thresholds (Loehle, 2009), methodological issues techniques
374
including “end effects” of chronology development (Esper and Frank, 2009; Briffa and
375
Melvin, 2011; Briffa et al. 2013; Melvin et al. 2013), biases in instrumental data or
376
additional anthropogenic influences (see D’Arrigo et al., 2007, and references therein),
377
or temperature-induced drought stress (D’Arrigo et al., 2004) Our sampled sites are
378
located within the drought-prone Mediterranean region, so we hypothesize a possible
379
temperature-induced drought explanation of the TRW-temperature divergence observed.
380
The aforementioned TRW-temperature divergence of the second half of the 20th
381
century is opposite to the relationship between TRW and SPEI trends, with
low-382
frequency moving correlations steadily rising and reaching a maximum level after the
383
1970s (Fig. 5e). Mean temperatures during the growing season have increased during
384
the last century and especially over the last decades, meantime precipitation regimes
385
have not significantly changed (Figure A14). These results suggest that
18
induced summer drought is increasingly influencing TRW in the 20th century in
387
Pyrenean high-elevation forests, which agrees with observations from other Iberian
388
mountain forests (Andreu et al., 2007; Macias et al., 2006).This can be due to a
389
potential loss in the positive thermal response of trees when some temperature
390
functional threshold is exceeded, leading to an increase in the influence of other
391
potential factors like soil moisture or drought (D’Arrigo et al., 2004). This
TRW-392
drought parallelism present in our high-elevation study disagrees with results from
low-393
elevation drought sensitive tree-ring central European sites, where growth/drought or
394
growth/precipitation relationships weaken after the 1970s (Wilson and Elling, 2004).
395
Consequently, emerging elevation-specific factors influencing tree growth can be acting
396
differently between high and low elevation sites or between central and southern
397
European forests, producing these contrasting responses in recent decades.
398
Contrastingly, our comparison between high- and low-elevation chronologies does not
399
show important differences (Figs. A11 and A12).
400
Summer drought is becoming less influential on MXD instead, specifically since
401
the 1970s, when low-frequency moving correlations between SPEI and MXD begin to
402
fall and both trends diverge (Fig. 6e). In any case, the moving correlations of
MXD-403
drought and MXD-temperature relationships show in general more instability than in
404
the case of TRW along time (Fig. 6b,e). When it is too hot or dry for tracheid
405
enlargement to occur, the rate of tracheid production decreases and a denser wood
406
(higher MXD) is formed because of the formation of tracheids with thicker cell walls
407
and narrower lumens (Jyske et al., 2009). This thickening and lignification of the cell
408
walls, illustrated by latewood tracheids, improves the mechanical strength of stems but
409
also allows tracheids to withstand higher xylem tension due to lower water potential
19
(Hacke et al., 2001). Specifically, MXD development is directly linked to climate
411
conditions during spring and mainly during late summer to early autumn, when the
412
latewood is formed (Briffa et al., 1998). During the first part of the growing season,
413
when the earlywood is formed, climatic variations affect radial tracheid enlargement,
414
whereas during the later part of the growing season climate mainly affects the cell wall
415
thickening process of latewood (Camarero et al., 1998) (Fig. A13). For the subperiod
416
1930-1969, the strongest negative correlation (~ -0.4) of MXD with SPEI were found
417
for May SPEI (Fig. 4). This means that wet and cool spring conditions could enhance
418
earlywood formation potentially leading to more and wider tracheids with thinner cell
419
walls and a subsequent delayed summer lignification producing a less dense latewood,
420
i.e. lower MXD values. The strongest positive correlation (~ 0.2-0.3) for the same
421
period corresponds to July SPEI which suggests that wet late summers will entail denser
422
latewood production through enhanced lignification and carbohydrates synthesis at the
423
end of the growing season.
424
In the sub-period 1970-2009 the highest positive MXD-SPEI correlations (~0.4)
425
are found in January considering the cumulative drought since the previous September
426
(5-month SPEI scale), which means that wet conditions in the previous autumn and
427
winter of a specific year would imply the production of a dense latewood during the late
428
summer of the next year. This is an unexpected observation since we unveil not only
429
influences of late summer/early autumn conditions of the current year on MXD but also
430
of lagged climatic conditions of the previous year as is usually the case in TRW (Tardif
431
et al., 2003; Fritts, 2001). The interpretation may be the same as in TRW since previous
432
wet conditions might enhance carbohydrates synthesis and storage later used for
433
lignifying and thickening latewood cells the following growing season. Note that these
20
indirect influences of previous winter conditions on latewood production were also
435
observed in xeric Pinus halepensis stands, which constitute typical lowland
436
Mediterranean forests (Pasho et al., 2011). Overall, the SPEI drought index provided a
437
superior signal of tree growth than precipitation data in the study forests. Differences in
438
responses between sub-periods could be due to different drought stress intensities from
439
one sub-period to the other, different temperature conditions or climatic variability (e.g.
440
the first half of the 20th century was climatically less variable than the second half) or
441
indirect effects of other global or local drivers like increasing atmospheric
442
concentrations of CO2 and rising N deposition.
443
Current data support the occurrence of climate warming and its effects on various
444
forest ecosystem services in the Pyrenees during recent decades. From 1880 to 1980 AD
445
at least 94 glaciers disappeared in the whole Pyrenees, 17 of them on the Spanish side
446
since 1980 (Morellón et al., 2012). Camarero and Gutiérrez (2004) observed an increase
447
in tree establishment and density within the treeline ecotone over the 20th century. In a
448
European context there is a positive trend in temperatures (+0.90ºC) from the beginning
449
of the 20th century and, although lower than in central and northern Europe, the
450
warming trend in the Mediterranean region has intensified since the 1970s (IPCC 2013).
451
The Pyrenees are more likely to be vulnerable against climate warming and drying
452
trends than other Mediterranean and European ranges (Schröter et al., 2005) due to two
453
main ecological drawbacks. First, the Pyrenees are east-west arranged, i.e.
454
perpendicularly to the expected northern (or upward) migratory routes. Second, they are
455
influenced by Mediterranean climatic conditions characterized by a summer drought.
456
The negative effects on forest growth under the forecasted scenarios of climate change
21
could be even worse than expected if drought stress plays a complementary role
458
together with the rising temperatures.
459
Several dendrochronological studies have focused on growth-climate
460
relationships at Pyrenean high-elevation forests (e.g. Gutiérrez 1991, Rathgeber and
461
Roche 2003, Tardif et al. 2003, Andreu et al. 2007, Büntgen et al. 2008a, Esper et al.
462
2010). Our study constitutes a step forward in the sense that (i) we use a larger dataset
463
covering a broad biogeographical gradient including the southern and western
464
distribution limits of this species and that (ii) we find a weakening in the
TRW-465
temperature relationships possibly connected to an increasingly important role of
466
drought as a growth driver during recent decades. The divergence phenomenon here
467
exposed should be considered in the assessment and performance of Pyrenean climate
468
reconstructions from tree rings, which are based on short calibration periods. Trees are
469
showing increasing drought and decreasing temperature sensitivities in recent decades
470
even in these high-elevation ecosystems where we would expect a strong temperature
471
response. This would imply that a Pyrenean climate reconstruction based on present-day
472
growth-climate relationships should take on account the role of additional climatic
473
factors that could be potentially limiting tree growth in an increasing degree. According
474
to our results, temperature reconstructions performed in the Pyrenean range using MXD
475
(Büntgen et al. 2008a, Dorado-Liñán et al. 2012) are reliable since they are based on
476
MXD/temperature relationships where no divergence was found.
477
This divergence phenomenon has been mainly explained here in terms of
478
temperature-induced drought stress, but we should not ignore additional factors
479
potentially influencing the degree and intensity of the growth/climate offset. For
480
instance, nitrogen fertilization or increasing atmospheric CO2 concentrations may
22
enhance radial growth thus leading to the formation of a less dense earlywood
482
(Lundgren, 2004). Our next research step would be a site-level study of the low- and
483
high-frequency signals in the growth/climate correlations, which would allow us to
484
draw conclusions for larger scales in a more accurate way (Büntgen et al., 2008b). A
485
more exhaustive MXD sampling of several tree species should be also necessary to
486
make a more accurate comparison between TRW and MXD responses.
487 488
5. Conclusions 489
This study comprises 1500 tree-ring width (TRW) and 102 maximum density
490
(MXD) measurement series from 711 and 74 trees, respectively, which were sampled at
491
30 high-elevation Pinus uncinata forest sites across the Iberian range of the species.
492
Rising temperatures led to an increase in drought stress of Pyrenean high-elevation
493
forests as has been observed in other Mediterranean mountain forests (Jump et al., 2006;
494
Piovesan et al., 2008). Therefore, these high-elevation forests, growing in typically
495
temperature-limited conditions, are becoming more limited by water availability. This
496
growth limitation driven by the amount of available water could be particularly strong
497
in steep sites with rocky substrates where soil shows a poor water holding capacity. We
498
may be witnessing how tree physiological thresholds in terms of optimal temperature
499
for growth are surpassed, reinforcing the role of drought as a growth-limiting factor of
500
high-elevation forests during recent decades.
501 502
23 Acknowledgements
503
We thank the personnel of the PNOMP and PNAESM National Parks, A.Q. Alla and G.
504
Sangüesa-Barreda for their help during the sampling and in dendrochronological
505
analyses and also in making the Figure 1. We thank Loïc Schneider (WSL) for his
506
collaboration in making the Figure A12. This study was supported by projects 012⁄2008
507
and 387⁄2011 (Organismo Autónomo Parques Nacionales, MMAMRM, Spain) and by a
508
JAE-CSIC grant to J.D.G. J.J.C. acknowledges the support of ARAID. We also
509
acknowledge funding by projects, which further contributed to build this data set
510
(FoRmat EU ENV4-CT97-0641, CiCyTAMB95-0160). We thank the editor and two
511
anonymous reviewers for their constructive comments, which helped us to improve the
512
manuscript.
513 514 515
24 References
516
Andreu, L., Gutiérrez, E., Macias, M., Ribas, M., Bosch, O., Camarero, J.J., 2007.
517
Climate increases regional tree-growth variability in Iberian pine forests. Global
518
Change Biology 13, 804–815.
519
Balcells, E., Gil-Pelegrín, E., 1992. Consideraciones fenológicas de las biocenosis de
520
altitud en el Parque Nacional de Ordesa y Monte Perdido, acompañadas y
521
apoyadas mediante estudio preliminar de los datos meteorológicos obtenidos
522
desde 1981 a 1989 en el observatorio de Góriz. Lucas Mallada 4, 71–162.
523
Briffa, K.R., Bartholin, T.S., Eckstein, D., Jones, P.D., Karlén, W., Schweingruber,
524
F.H., Zetterberg, P. 1990. A 1400-year treering record of summer temperatures
525
in Fennoscandia. Nature 346, 434–439.
526
Briffa, K.F., Schweingruber, F.H., Jones, P.D., Osborn, T. 1998. Reduced sensitivity
527
of recent tree growth to temperature at high northern latitudes. Nature 391, 678–
528
682.
529
Briffa, K.R., Melvin, T.M., 2011. A closer look at Regional Curve Standardisation of
530
tree-ring records: Justification of the need, a warning of some pitfalls, and
531
suggested improvements in its application. In: Hughes, M.K., Diaz, H.F.,
532
Swetnam, T.W. (Eds.), Dendroclimatology: Progress and Prospects. Springer
533
Verlag, pp. 113–145.
534
Briffa, K.R., Melvin, T.M., Osborn, T.J., Hantemirov, R.M., Kirdyanov, A.V.,
535
Mazepa, V., Shiyatov, S.G., Esper, J., 2013. Reassessing the evidence for
tree-536
growth and inferred temperature change during the Common Era in Yamalia,
537
northwest Siberia. Quaternary Science Reviews, 72, 83–107.
25
Bunn, A.G., Waggoner, L.A., Graumlich, L.J., 2005. Topographic mediation of
539
growth in high elevation foxtail pine (Pinus balfouriana Grev. et Balf.) forests in
540
the Sierra Nevada, USA. Global Ecology and Biogeography 14, 103–114.
541
Büntgen, U., Esper, J., Frank, D.C., Nicolussi, K., Schmidhalter, M., 2005. A
1052-542
year tree-ring proxy for Alpine summer temperatures. Climate Dynamics 25,
543
141–153.
544
Büntgen, U., Frank, D.C., Nievergelt, D., Esper, J., 2006. Summer temperature
545
variations in the European Alps, AD 755-2004. Journal of Climate 19, 5606–
546
5623.
547
Büntgen, U., Frank, D.C., Kaczka, R.J., Verstege, A., Zwijacz-Kozica, T., Esper, J.,
548
2007. Growth/climate response of a multi-species treering network in the
549
western Carpathian Tatra Mountains, Poland and Slovakia. Tree Physiology 27,
550
687–702.
551
Büntgen, U., Frank, D.C., Grudd, H., Esper, J., 2008a. Long-term summer temperature
552
variations in the Pyrenees. Climate Dynamics 31, 615‒631.
553
Büntgen, U., Frank, D.C., Wilson, R., Carrer, M., Urbinati, C., Esper, J., 2008b.
554
Testing for tree-ring divergence in the European Alps. Global Change Biology
555
14, 2443–2453.
556
Büntgen, U., Frank, D.C., Trouet, V., Esper, J., 2010. Diverse climate sensitivity of
557
Mediterranean tree-ring width and density. Trees, Structure and Function 24,
558
261–273.
559
Büntgen, U., Raible, C.C., Frank, D., Helama, S., Cunningham, L., et al., 2011. Causes
560
and Consequences of Past and Projected Scandinavian Summer Temperatures,
561
500–2100 AD. PLoS ONE 6(9): e25133. doi:10.1371/journal.pone.0025133
26 563
Büntgen, U., Frank, D.C., Neuenschwander, T., Esper, J., 2012. Fading temperature
564
sensitivity of Alpine tree growth at its Mediterranean margin and associated
565
effects on large-scale climate reconstructions. Climatic Change 114, 651‒666.
566
Büntgen, U., Kyncl, T., Ginzler, C., Jacks, D.S., Esper, J., Tegel, W., Heussner, K.U.,
567
Kyncl, J., 2013. Filling the Eastern European gap in millennium-long
568
temperature reconstructions. Proceedings of the National Academy of Science,
569
USA doi: 10.1073/pnas.1211485110.
570
Camarero, J.J., 1999. Dinámica del límite altitudinal del bosque en los Pirineos y su
571
relación con el cambio climático. PhD Thesis, Universitat de Barcelona,
572
Barcelona.
573
Camarero, J.J., Guerrero-Campo, J., Gutiérrez, E., 1998. Tree-ring growth and
574
structure of Pinus uncinata and Pinus sylvestris in the Central Spanish Pyrenees.
575
Arctic and Alpine Research 30, 1–10.
576
Camarero, J.J, Gutiérrez, E., 2004. Pace and pattern of recent treeline dynamics:
577
response of ecotones to climatic variability in the Spanish Pyrenees. Climatic
578
Change 63, 181–200.
579
Carrer, M.P., Nola, P., Motta, R., Urbinati, C., 2010. Contrasting tree-ring growth to
580
climate responses of Abies alba toward the southern limit of its distribution area.
581
Oikos 119, 1515–1525.
582
Ceballos, L., Ruiz de la Torre, J., 1979. Árboles y arbustos de la España Peninsular.
583
Escuela Técnica Superior de Ingenieros de Montes, Madrid, Spain.
584
Cook, E.R., 1985. A Time Series Analysis Approach to Tree-Ring Standardization.
585
PhD Thesis, Lamont-Doherty Geological Observatory, New York.
27
Cook, E.R., Peters, K., 1981. The smoothing spline: a new approach to standardizing
587
forest interior tree-ring width series for dendroclimatic studies. Tree-Ring
588
Bulletin 41, 45–53.
589
Cook, E.R., Holmes, R.L., 1986. Program ARSTAN, Version 1. Laboratory of
Tree-590
Ring Research, The University of Arizona, Tucson, USA, 72 pp.
591
Cook, E.R., Kairiukstis, L.A., 1990. Methods of dendrochronology: applications in the
592
environmental sciences. International Institute for Applied Systems Analysis,
593
Boston, MA, USA: Kluwer Academic Publishers.
594
Cook, E.R., Peters, K., 1997. Calculating unbiased tree-ring indices for the study of
595
climatic and environmental change. Holocene 7, 359–368.
596
Corona, C., Guiot, J., Edouard, J.L., Chalié, F., Büntgen, U., Nola, P., Urbinati, C.,
597
2010. Millennium-long summer temperature variations in the European Alps as
598
reconstructed from tree rings. Climate of the Past 6, 379–400.
599
D’Arrigo, R., Kaufmann, R., Davi, N., Jacoby, G., Laskowski, C., Myneni, R.,
600
Cherubini, P., 2004. Thresholds for warming-induced growth decline at
601
elevational treeline in the Yukon Territory. Global Biogeochemical Cycles 18,
602
GB3021, doi: 10.1029/2004GB002249.
603
D’Arrigo, R., Wilson, R., Liepert, B., Cherubini, P., 2008. On the ‘divergence
604
problem’ in northern forests: a review of the tree-ring evidence and possible
605
causes. Global and Planetary Change 60, 289–305.
606
De Luis, M., Gričar, J., Čufar, K., Raventós, J., 2007. Seasonal dynamics of wood
607
formation in Pinus halepensis from dry and semi-arid ecosystems in Spain.
608
IAWA Journal 28, 389–404.
28
Dorado-Liñán, I., Büntgen, U., González-Rouco, F., et al., 2012. Estimating 750 years
610
of temperature variations and uncertainties in the Pyrenees by tree-ring
611
reconstructions and climate simulations. Climate of the Past 8, 919–933.
612
Esper, J., Cook, E.R., Schweingruber, F.H., 2002. Low-frequency signals in long
tree-613
ring chronologies and the reconstruction of past temperature variability. Science
614
295, 2250–2253.
615
Esper, J., Cook, E.R., Krusic, P.J., Peters, K., Schweingruber, F.H., 2003. Tests of the
616
RCS method for preserving low-frequency variability in long tree-ring
617
chronologies. Tree-Ring Research 59, 81–98.
618
Esper, J., Frank, D.C., 2009. Divergence pitfalls in tree-ring research. Climatic Change
619
94, 261–266.
620
Esper, J., Frank, D.C., Battipaglia, G., Büntgen, U., Holert, C., Treydte, K., Siegwolf,
621
R., Saurer, M., 2010. Low-frequency noise in ð13C and ð18O tree ring data: A
622
case study of Pinus uncinata in the Spanish Pyrenees. Global Biogeochemical
623
Cycles 24, doi:10.1029/2010GB0037772.
624
Frank, D., Esper, J., Cook, E.R., 2007. Adjustment for proxy number and coherence in
625
a large-scale temperature reconstruction. Geophysical Research Letters 34, doi:
626
10.1029/2007GL030571.
627
Fritts, H.C., 2001. Tree Rings and Climate. Blackburn Press, Caldwell.
628
Grudd, H., 2008. Torneträsk tree-ring width and density AD 500-2004: a test of
629
climatic sensitivity and a new 1500-year reconstruction of northern
630
Fennoscandian summers. Climate Dynamics 31, 843–857.
631
Gutiérrez, E., 1991. Climate tree-growth relationships for Pinus uncinata Ram. in the
632
Spanish pre-Pyrenees. Acta Oecologica 12, 213‒225.
29
Hacke, U.G., Sperry, J.S., Pockman, W.T., Davis, S.D., McCulloh, K.A., 2001. Trends
634
in wood density and structure are linked to prevention of xylem implosion by
635
negative pressure. Oecologia 126, 457–461.
636
Harris, I., Jones, P.D., Osborn, T.J., Lister, D.H., 2013. Updated high-resolution grids
637
of monthly climatic observations – the CRU TS3.10 Dataset. In press,
638
International Journal of Climatology, doi: 10.1002/joc.3711.
639
Holmes, R.L., 1983. Computer-assisted quality control in tree-ring dating and
640
measurement. Tree-Ring Bulletin 43, 68–78.
641
IPCC 2013. Climate Change 2013: The Physical Science Basis. Contribution of
642
Working Group I to the Fifth Assessment Report of the Intergovernmental Panel
643
on Climate Change [Stocker, T.F., D. Qin, G.-K. Plattner, M. Tignor, S.K.
644
Allen, J. Boschung, A. Nauels, Y. Xia, V. Bex and P.M. Midgley (eds.)].
645
Cambridge University Press, Cambridge, United Kingdom and New York, NY,
646
USA, 1535 pp
647
Jump, A.S., Hunt, J.M., Peñuelas, J., 2006. Rapid climate change-related growth
648
decline at the southern range edge of Fagus sylvatica. Global Change Biology
649
12, 2163–2174. doi: 10.1111/j.1365-2486.2006.01250.x
650
Jyske, T., Hölttä, T., Mäkinen, H., Nöjd, P., Lumme, I., Spiecker, H., 2010. The effect
651
of artificially induced drought on radial increment and wood properties of
652
Norway spruce. Tree Physiology 30, 103–115.
653
Körner, Ch., 2012. Alpine Treelines. Springer, Basel.
654
Lebourgeois, F., Mérian, P., Courdier, F., Ladier, J., Dreyfus, P., 2012. Instability of
655
climate signal in tree-ring width in Mediterranean mountains: a multispecies
656
analysis. Trees 26, 715–729.
30
Loehle, C., 2009. A mathematical analysis of the divergence problem in
658
dendroclimatology. Climatic Change 94, 233–245.
659
López-Moreno, J.I., Goyette, S., Beniston, M., 2008. Climate change prediction over
660
complex areas: spatial variability of uncertainties and predictions over the
661
Pyrenees from a set of regional climate models. International Journal of
662
Climatology 28, 1535–1550.
663
Lundgren, C., 2004. Microfibril angle and density patterns of fertilized and irrigated
664
Norway spruce. Silva Fennica 38, 107–117.
665
Macias, M., Andreu, L., Bosch, O., Camarero, J.J., Gutiérrez, E., 2006. Increasing
666
aridity is enhancing silver fir (Abies alba Mill.) water stress in its south-western
667
distribution limit. Climatic Change 79, 289–313.
668
McKee, T.B.N., Doesken, J., Kleist, J., 1993. The relationship of drought frecuency
669
and duration to time scales. In Proceedings of the 8th Conference of Applied
670
Climatology, 17-22 January, Anaheim, CA. American Meterological Society,
671
Boston, MA. 179-184.
672
Melvin, T.M.,, Grudd, H., Briffa, K.R., 2013. Potential bias in “updating” tree-ring
673
chronologies using Regional Curve Standardisation: re-processing the
674
Torneträsk Maximum-Latewood-Density data. The Holocene, 23, 364–373.
675
Morellón, M., Pérez-Sanz, A., Corella, J.P., et al., 2012. A multi-proxy perspective on
676
millennium-long climate variability in the Southern Pyrenees. Climate of the
677
Past 8, 683–700.
678
Moreno, A., Pérez, A., Frigola, J., et al., 2012. The Medieval Climate Anomaly in the
679
Iberian Peninsula reconstructed from marine and lake records. Quaternary
680
Science Reviews 43, 16–32.
31
Nicault, A., Rathgeber, C.B.K., Tessier, L., Thomas, A., 2001. Intra-annual variations
682
of radial growth and ring structure. Annals of Forest Science 58, 769–784.
683
Pasho, E., Camarero, J.J., De Luis, M., Vicente-Serrano, S.M., 2011. Spatial
684
variability in large-scale and regional atmospheric drivers of Pinus halepensis
685
growth in eastern Spain. Agricultural and Forest Meteorology 151, 1106–1119.
686
Piovesan, G., Biondi, F., Di Filippo, A., Alessandrini, A., Maugeri, M., 2008.
687
Drought-driven growth reduction in old beech (Fagus sylvatica L.) forests of the
688
central Apennines, Italy. Global Change Biology 14, 1265–1281. doi:
689
10.1111/j.1365-2486.2008.01570.x
690
Popa, I., Kern, Z., 2008. Long-term summer temperature reconstruction inferred from
691
tree-ring records from the Eastern Carpathians. Climate Dynamics 32, 1107–
692
1117 doi:10.1007/s00382-008-0439-x
693
Rathgeber, C., Roche, P., 2003. Spatio-temporal growth dynamics of a subalpine
694
Pinus uncinata stand in the French Alps. Comptes Rendus Biologies 326, 305–
695
315.
696
Rolland, C., Petitcolas, V., Michalet, R., 1998. Changes in radial tree growth for Picea
697
abies, Larix decidua, Pinus cembra and Pinus uncinata near the alpine
698
timberline since 1750. Trees 13, 40–53.
699
Schröter, D., Cramer, W., Leemans, R., et al., 2005. Ecosystem service supply and
700
vulnerability to global change in Europe. Science 310, 1333–1337.
701
Stokes, M.A., Smiley, T.L., 1968. An Introduction to Tree-ring Dating. The University
702
of Chicago Press, Chicago, IL.
32
Tardif, J., Camarero, J.J., Ribas, M., Gutiérrez, E., 2003. Spatiotemporal variability in
704
tree growth in the Central Pyrenees: climatic and site influences. Ecological
705
Monographs 73, 241–257.
706
Trigo, R.M., Vaquero, J.M., Alcoforado, M-J., Barriendos, M., Taborda, J.,
García-707
Herrera, R., Luterbacher, J., 2009. Iberia in 1816, the year without a summer.
708
International Journal of Climatology 29, 99–115.
709
Vicente-Serrano, S.M., Beguería, S., López-Moreno, J.I., 2010. A Multiscalar Drought
710
Index Sensitive to Global Warming: The Standardized Precipitation
711
Evapotranspiration Index. Journal of Climate 23, 1696–1718.
712
Wigley, T.M.L., Briffa, K.R., Jones, P.D., 1984. On the average of correlated time
713
series, with applications in dendroclimatology and hydrometeorology. Journal of
714
Climate and Applied Meteorology 23, 201–213.
715
Wilmking, M., Juday, G., Barber, V., Zald, H., 2004. Recent climate warming forces
716
contrasting growth responses of white spruce at treeline in Alaska through
717
temperature thresholds. Global Change Biology 10, 1724–1736.
718
Wilmking, M., D'Arrigo, R., Jacoby, G., Juday, G., 2005. Divergent growth responses
719
in circumpolar boreal forests. Geophysical Research Letters 32, L15715.
720
Wilson, R.J.S., Elling, W., 2004. Temporal instability in tree-growth/climate response
721
in the Lower Bavarian Forest region: implications for dendroclimatic
722
reconstruction. Trees, Structure and Function 18, 19–28.
723 724
33 SUPPORTING INFORMATION LEGENDS 725
Figure A1. (a) Principal Components Analysis based on 30 TRW chronologies showing 726
the scores of the first two principal components PC1 and PC2 (sites codes are as in
727
Table 1; analysed period is 1901-1994, covered by chronologies from all sites). PC1 and
728
PC2 scores change as a function of altitude (a) and longitude (b), respectively. Stands
729
with special characteristics or located near the distribution limit of the species are
730
indicated. Different symbols correspond to sites from different geographical areas
731
(PNOMP, black circles; PNASM, yellow circles; western and central Pyrenees,
732
downward blue triangle; Iberian System, red square; eastern Pyrenees, white circle;
Pre-733
Pyrenees, upward white triangle). The continuous line in (c) indicates the regression
734
line without considering the red outlier on the left.
735
Figure A2. Upper and lower graphs show the different TRW (blue) and MXD (green) 736
chronologies, respectively, coming from the 10 different detrendings applied. Dark blue
737
and dark green indicate the TRW and MXD RCS chronologies, in that order. Light blue
738
and light green indicate the eight different chronologies coming from exponential and
739
spline detrendings. Continued and dotted lines refer to chronologies derived from
non-740
transformed and power-transformed data, correspondingly.
741 742
Figure A3. Temporal distribution of (a) 101 MXD and (b) 1500 TRW core samples of 743
Pinus uncinata, ordered by calendar age of their innermost ring, and EPS statistic
744
(calculated over 30 years lagged by 15 years) of the whole set (i.e. 6 MXD sites and 30
745
TRW sites) of raw chronologies. The vertical black lines show the temporal limit of the
746
signal strength acceptance (EPS > 0.85): 1777 AD for MXD and 1500 AD for TRW.