HAL Id: hal-00296479
https://hal.archives-ouvertes.fr/hal-00296479
Submitted on 7 Mar 2008
HAL is a multi-disciplinary open access
archive for the deposit and dissemination of
sci-entific research documents, whether they are
pub-lished or not. The documents may come from
teaching and research institutions in France or
abroad, or from public or private research centers.
L’archive ouverte pluridisciplinaire HAL, est
destinée au dépôt et à la diffusion de documents
scientifiques de niveau recherche, publiés ou non,
émanant des établissements d’enseignement et de
recherche français ou étrangers, des laboratoires
publics ou privés.
To cite this version:
R. E. Hibbins, M. J. Jarvis. A long-term comparison of wind and tide measurements in the
up-per mesosphere recorded with an imaging Doppler interferometer and Suup-perDARN radar at Halley,
Antarctica. Atmospheric Chemistry and Physics, European Geosciences Union, 2008, 8 (5),
pp.1367-1376. �hal-00296479�
Atmos. Chem. Phys., 8, 1367–1376, 2008 www.atmos-chem-phys.net/8/1367/2008/ © Author(s) 2008. This work is licensed under a Creative Commons License.
Atmospheric
Chemistry
and Physics
A long-term comparison of wind and tide measurements in the
upper mesosphere recorded with an imaging Doppler
interferometer and SuperDARN radar at Halley, Antarctica
R. E. Hibbins and M. J. Jarvis
Physical Sciences Division, British Antarctic Survey, High Cross, Madingley Road, Cambridge, CB3 0ET, UK Received: 5 April 2007 – Published in Atmos. Chem. Phys. Discuss.: 16 May 2007
Revised: 13 November 2007 – Accepted: 11 February 2008 – Published: 7 March 2008
Abstract. Data from a near co-located imaging Doppler
interferometer (IDI) and SuperDARN radar recorded since 1996 have been analysed in a consistent manner to compare the derived mean winds and tides in the upper mesosphere. By comparing only days when both techniques were record-ing good quality meridional wind data it is shown that the SuperDARN radar winds and tides correlate best with the IDI height bin 90–95 km. On timescales of one hour the winds derived from the IDI have a much greater associated variance and correlate poorly with the SuperDARN winds. Regression analysis reveals that the observed SuperDARN daily mean meridional wind strength is approximately 65% that recorded by the IDI, in good quantitative agreement with previous studies which have shown contamination to Super-DARN derived winds due to the significant back lobe of the radar radiation pattern. Climatologically the two tech-niques observe similar monthly mean winds with the Super-DARN meridional winds suppressed compared to the IDI which tends to record winds more poleward than those de-rived by the SuperDARN radar during the summer months, and to be slightly more equatorward during the winter. The 12-h tidal amplitude and phase derived from both techniques are in good agreement, whereas the 24-h tides are seen much more strongly in the SuperDARN radar, especially in win-tertime, with poor phase agreement. Long term comparison of the two techniques reveals a tendency for the IDI merid-ional winds to be more poleward during solar maximum es-pecially during summer time; an effect which is not repro-duced in the meridional winds derived from the SuperDARN radar. These results are discussed in the context of previous studies to independently determine the veracity of each tech-nique, and to highlight the circumstances where data derived
Correspondence to: R. E. Hibbins
(rehi@bas.ac.uk)
from these two techniques can be used to draw reliable con-clusions from comparative studies based on geographically distributed pairs of instruments.
1 Introduction
The dynamics of the mesosphere and lower thermosphere (MLT) are dominated by gravity waves, tides and planetary waves. These periodic motions with timescales ranging from a few minutes to several months interact to drive the atmo-sphere to seasonal states far from radiative equilibrium espe-cially in polar regions. Ground-based multi instrument stud-ies are increasingly important in characterising the dynamics of the atmosphere through their inclusion in empirical mod-els (e.g. Hedin et al., 1996; Portnyagin et al., 2004) and in de-riving the spatial characteristics of tides and planetary waves (e.g. Murphy et al., 2006; Baumgaertner et al., 2006; Espy et al., 2005) to determine the geographical extent of ent components. In Antarctica there are a mixture of differ-ent ground based radar techniques for studying winds in the mesosphere and lower thermosphere that can be used to sep-arate and characterise wave components and the mean flow for climatological and phenomenological studies including imaging Doppler interferometer (e.g. Jones et al., 1997), MF spaced antenna (e.g. Jarvis et al., 1999), VHF all sky meteor drift (e.g. Forbes et al., 1995) and SuperDARN (e.g. Jenkins et al., 1998) radars. Cross calibrating different techniques is a vital part of this work and requires long-term high quality data sets from near or co-located systems.
At Halley (76◦S, 27◦W) an imaging Doppler interferom-eter (IDI) has been running since December 1996 recording winds between ∼75 and 105 km, and a climatology of winds and tides has recently been published (Hibbins et al., 2006).
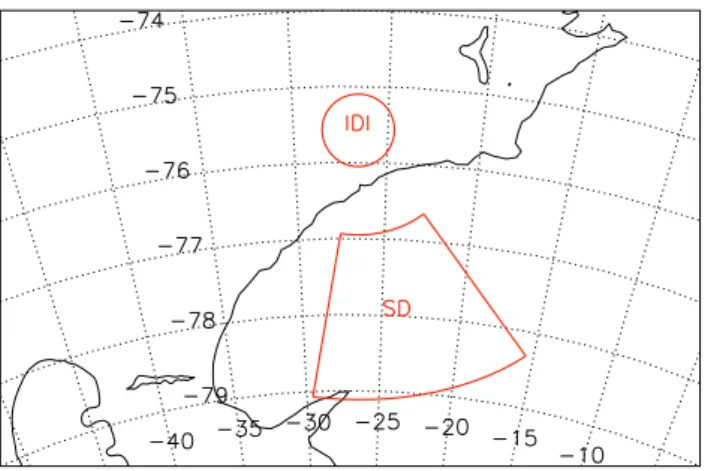
Fig. 1. Map of the approximate sampling volume of the Halley IDI (90–95 km height bin) and the SuperDARN radar (range gates 0–4).
At the same site a SuperDARN radar has been running since 1988 and has been used to derive winds in the lower thermo-sphere by tracing the ionisation trail left by meteors as they ablate in the MLT (Jenkins et al., 1998; Jenkins and Jarvis, 1999).
In this paper meridional mean winds and tides are derived in a consistent manner from both techniques. Where the two techniques simultaneously generate data of consistent high quality comparisons are made between them. Section 2 cov-ers the two data sets and the analysis techniques used to de-rive the mean winds and tides and Sect. 3 examines their correlations on various time scales. The next section com-pares the mean winds and tides derived from the two tech-niques climatologically and quantifies the observed differ-ences. Section 5 compares the derived meridional winds to look for systematic biases in one technique compared to the other and Sect. 6 presents evidence for long-term changes in the wind field recorded by each technique. Finally the dif-ferences are summarised in the light of previous attempts to calibrate these two techniques against other instruments.
2 Instruments and data
The IDI at Halley (Jones et al., 1997), based upon the tech-nique of Adams et al. (1985, 1986), is a modification of the Halley Dynasonde, a NOAA HF radar (Grubb, 1979; Wright and Pitteway, 1979), and its operation has been described in detail elsewhere (Jones et al., 1997; Charles and Jones, 1999; Hibbins et al., 2006). Three component winds are recorded every 5 or 15 min for each 5 km altitude bin be-tween 75 and 105 km, and for this study hourly mean merid-ional winds were calculated provided at least two different data points were present in the height bin during that hour. The Halley SuperDARN radar (Greenwald et al., 1985, 1995) has been operating since 1988 primarily recording F region convection from coherent scatter off plasma irregularities in
Fig. 2. Data coverage recorded by the SuperDARN radar (black line) and the IDI (grey line) between 1996 and 2006.
the ionosphere. Previous authors have demonstrated that the grainy near range echoes recorded by these radars are due to the ionisation trail left by meteors as they ablate in the up-per mesosphere and lower thermosphere (Hall et al., 1997; Jenkins and Jarvis, 1999; Hussey et al., 2000; Yukimatu and Tsutsumi, 2002), and tracing the evolution of these trails pro-vides an estimate of the neutral wind at these altitudes. Two-component horizontal hourly-mean winds were derived by singular value decomposition (Press et al., 1992) of the spa-tial distribution of the radial velocities of all echoes with a signal to noise greater than 3 dB returned from the five range gates between 180 and 405 km from the radar assuming a scattering height of 95 km. Line of sight velocities greater than 100 ms−1, or with an error greater than 50 ms−1, or a spectral width greater than 25 ms−1, were excluded from the fitting, and an hourly fit was only attempted if echoes were reported in at least five different radar beams. Between 1996 and 2006 the SuperDARN radar at Halley was sound-ing above 12 MHz for 85% of the time and between 10 and 12 MHz for 15% of the time. No soundings were made below 10 MHz. The zonal component of the resolved SuperDARN winds is seen to be noisier than the meridional component as expected from the observing geometry of the Halley radar: the boresite of the Halley radar is approximately 15◦east of the geographic south pole and hence the Doppler velocities seen in the individual beams influence the resolved wind in this direction most strongly. Conversely, the perpendicular winds are derived from differences in the radial velocities across the 16 radar beams spread out over only 52◦. Figure 1 shows a map of the approximate sampling volumes of the two radars, the centres of which are separated by approximately 275 km.
Figure 2 shows the data coverage recorded by the two radars between 1996 and 2006. Over this period the Su-perDARN radar has generated hourly mean winds for 84% of the time with minor periods of down time for system
R. E. Hibbins and M. J. Jarvis: IDI/SuperDARN comparison 1369
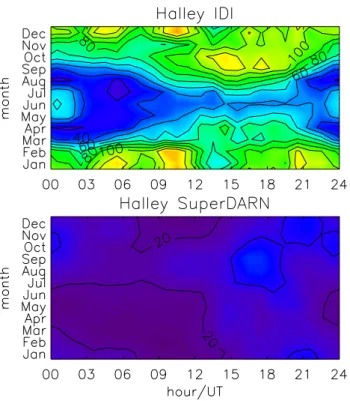
Fig. 3. Annual and diurnal variation in the mean number of echoes per hour recorded by the IDI 90–95 km height bin (top) and the SuperDARN radar (bottom).
maintenance primarily during the austral summer. For the IDI 67% of hours since December 1996 have generated wind data, but between 22 January 2002 and 18 February 2003 the IDI soundings were made on a delta antenna while the log-periodic antenna used for routine IDI soundings at 2.75 MHz was repaired following damage; this resulted in a 60% de-crease in the number of returned echoes and consequently much poorer quality winds (Hibbins et al., 2006). These data have therefore been excluded from this study resulting in 54% of the time when both radars are simultaneously record-ing good quality data.
Figure 3 shows the diurnal and annual variation in the mean number of echoes recorded per hour with the Super-DARN radar in range gates 0–4 and with the IDI in the al-titude bin 90–95 km. Both techniques show similar strong diurnal and annual variations with minima in the number of recorded echoes around equinox especially in southern spring time. The SuperDARN radar, in common with other meteor radars, shows the greatest number of echoes in sum-mer time around 07:00 LT (∼09:00 UT) whereas the IDI at this altitude records the greatest number of echoes in mid winter between 03:00 and 08:00 UT. The SuperDARN radar also tends to show a stronger diurnal variation in number of echoes than the IDI typically varying by around a factor of 3 between the maximum at 07:00 LT and the minimum around 19:00 LT. Figure 4 shows the diurnal and annual variation
Fig. 4. Annual and diurnal variation in the standard deviation of the hourly mean winds recorded by the IDI 90–95 km height bin (top) and the SuperDARN radar (bottom).
in the standard deviation of the hourly mean winds deter-mined from the SuperDARN radar and the IDI 90–95 km height bin. Both techniques are seen to produce hourly mean winds with a higher associated variance when the number of recorded echoes is lowest. However the IDI also sees highly variable hourly mean winds in summer time when the stan-dard deviation of the winds is around four times greater than that seen in the SuperDARN radar. In addition the IDI has a stronger diurnal variation in the standard deviation in the hourly mean winds, which is especially evident outside the summer months when the hourly mean winds measured be-tween 15:00 and 18:00 UT have an associated standard devi-ation approximately three times greater than those recorded between 03:00 and 06:00 UT.
In order to separate the influence of the tides from the mean wind field, the hourly-mean winds from each radar were combined into four-day segments and a mean bias and 12- and 24-h sine waves representing the two strongest tidal components (Hibbins et al., 2006) were fitted to each data segment provided at least half of the hourly-means were present spanning at least 16 different hours. Each individ-ual hourly-mean was weighted in the fitting routine by the number of echoes recorded in that hour. In the case of the IDI each individual 5 km height bin between 75 and 105 km was treated independently in the fitting. The four-day seg-ments of data were stepped by one-day intervals to build up a time series of background winds and 12- and 24-h tidal
Fig. 5. Correlation coefficients between the daily mean meridional winds and tides recorded by the SuperDARN radar and the IDI for each 5 km altitude bin between 70 and 105 km. Thick solid line: mean wind, thick dashed line: diurnal tidal amplitude, thick dotted line: semidiurnal tidal amplitude, thin dashed line: diurnal tidal phase, thin dotted line: semidiurnal tidal phase.
amplitudes and phases (as measured by the local time of maximum northwards wind) recorded by the two radars since 1996.
3 Correlations
Figure 5 shows the reduced Pearson correlation coefficient for the meridional mean wind and the 12- and 24-h tidal am-plitudes and phases between the SuperDARN radar and each of the 5 km height bins of the IDI. It can be seen that the mean wind recorded with the SuperDARN radar correlates best with the IDI mean wind recorded in the 90–95 km height bin consistent with the mean height of 94(±3) km quoted by Hall et al. (1997). However, each 5 km IDI height bin is oversam-pled by a factor of three (Jones et al., 1997) so the 90–95 km bin actually covers a region between 85 and 100 km with a Gaussian envelope. The 12- and 24-h tidal amplitudes also agree with this correlation with coefficients peaking at the 90–95 km altitude bin. The 24-h tidal amplitudes correlate much more poorly than either the mean meridional winds or the 12-h tidal amplitudes across all altitude ranges observed by the IDI, and the phases show no significant change in cor-relation with altitude. This is expected as the diurnal tide at Halley has been shown previously to be largely evanescent (Hibbins et al., 2006). There is no seasonal variation in the height of the maximum of the correlation coefficients when the data are separated into calendar months, suggesting that the height of the meteor layer does not vary significantly (i.e. by more than 5 km) between polar winter and summer. For the rest of this paper it is assumed that the SuperDARN radar winds are observed from a region that agrees best with the IDI 90–95 km height bin.
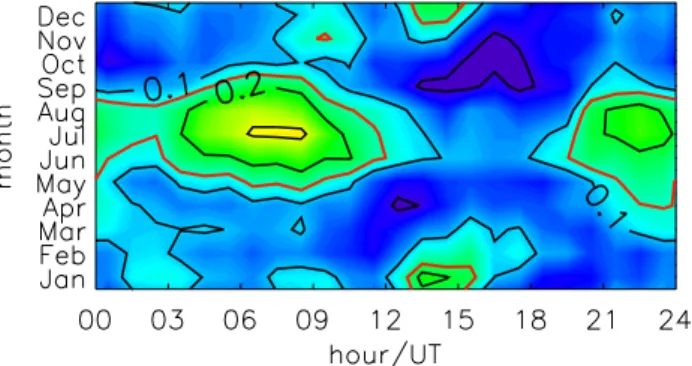
Figure 6 shows the correlation coefficients between the hourly-mean meridional winds derived from both radars as a function of time of the day and month of the year. The
cor-Fig. 6. Correlation coefficients between the hourly mean meridional winds recorded by the SuperDARN radar and the IDI 90–95 km height bin. The red contour represents the 95% significance level.
relation coefficients are seen to roughly follow the seasonal and diurnal variations in the number of echoes recorded by the two radars with a better correlation in winter than the equinoxes, and a minimum between 12:00 and 21:00 UT. However, the magnitudes of the correlation coefficients are small, and mostly insignificant at the 95% confidence level (red contour), with a maximum of ∼0.3 between 06:00 and 09:00 UT in July, but virtually zero correlation in the after-noon and around the equinoxes. It is unlikely that the small geographical difference between the fields of view of the two radars will have a significant effect on the observed magni-tude of the tides (see Sect. 4) therefore the poor correlation in the mean winds observed between the two techniques on timescales of 1 h suggests the two techniques are observing different gravity wave fields. Whether this is due to the ge-ographical difference between the two radars’ field of view or to the sensitivity of the two radars to a different spectrum of waves is undetermined. Arnold et al. (2003) note a poor statistical variance between hourly wind data derived from different quadrants of a single meteor radar, and Fraser et al. (2006) even see large MLT wind inhomogeneities with scales of the order of 10 km and 1 h from common volume meteor wind measurements. Therefore it is reasonable to as-sume that there is considerable variation in the gravity wave fields over distances smaller than the separation of the two radars’ sampling volumes and this is likely to be a significant contributing factor to the poor observed hourly wind correla-tions.
Figure 7 shows the correlation coefficients between the meridional daily mean winds and tidal amplitudes observed in the SuperDARN and IDI (90–95 km height bin) radars separated into calendar months. The tidal-subtracted daily-mean winds correlate better than the hourly-daily-mean winds and are significant at the 95% confidence level all year. There is a similar peak in the degree of correlation around late winter coincident with the wintertime maximum in the num-ber of echoes recorded by both radars. The semidiurnal tide shows the opposite behaviour peaking in summer time. This
R. E. Hibbins and M. J. Jarvis: IDI/SuperDARN comparison 1371
Fig. 7. Correlation coefficients between the daily mean meridional winds and tides recorded by the SuperDARN radar and the IDI 90– 95 km height bin separated into calendar months. Solid black line: mean wind, dashed black line: diurnal tidal amplitude, dotted black line: semidiurnal tidal amplitude. The solid red line represents the 95% significance level.
coincides with the period of largest tidal amplitudes (Hib-bins et al., 2006). The fitted diurnal tidal amplitudes mea-sured in the two instruments correlate much more poorly than the semidiurnal tides with virtually zero correlation around the equinoxes when the tides are weak and the overall wind quality is poorest. It would appear that on timescales of a few days the correlation in tidal amplitudes maximises when both the amplitudes are large and the background winds are derived from the largest number of echoes.
4 Climatologies
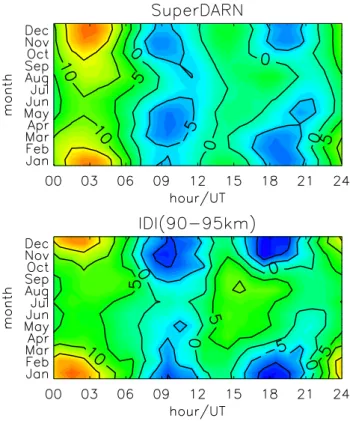
Figure 8 shows the meridional wind climatology generated from the hourly mean winds from both the SuperDARN radar and the IDI radar using the 90–95 km height bin separated into calendar month and hour of day. Despite the poor cor-relation between the hourly mean winds derived by the two techniques, when averaged over time each radar generates a qualitatively similar climatology, though with a tendency for the IDI to show stronger meridional winds than those de-rived from the SuperDARN radar. To further investigate the source of the differences in the fitted background mean winds and tides, climatologies of the monthly mean wind and 12-and 24-h tidal amplitude 12-and phases for the meridional com-ponent of the SuperDARN meteor winds and the IDI winds measured in the 90–95 km height bin were generated and are presented in Fig. 9. To aid comparison, only days where winds and tides were successfully fitted to the data generated by both radars are used in generating the monthly means, and the tidal amplitude and phases are vector averaged. Typically around 200 days of data are included in generating each data point. Included in the figures are the mean winds and the am-plitudes and phases of the 12- and 24-h tides derived from the HWM-93 horizontal wind model (Hedin et al., 1996) assum-ing an altitude of 92.5 km and geographic locations of 76◦S,
Fig. 8. Climatologies of hourly mean meridional winds recorded by the SuperDARN meteor wind radar (top) and IDI 90–95 km height bin (bottom). Contours are plotted at 5 ms−1 intervals, positive northwards.
27◦W (the IDI location) and 78◦S, 24◦W (the mean posi-tion of the scattering points measured in the first five range gates of the SuperDARN radar) to demonstrate the magni-tude of the anticipated differences in the climatologies due to the different field of view of the two radars.
Between March and September the meridional mean winds measured in the 90–95 km height bin of the IDI are more equatorward than those recorded by the SuperDARN radar, and more poleward during the summer months. The difference is more pronounced in December where the Su-perDARN radar mean wind is nearly 6 ms−1more equator-ward, but differ by no more than 3 ms−1during the equinoxes and winter. The diurnal tide derived from the two different techniques is significantly different. The amplitude of the meridional component is seen more strongly in the IDI in the summer months and more strongly in the SuperDARN radar at other times. The phases of the derived mean diur-nal tides also differ during winter. Despite the differences in the observed diurnal tides recorded by the two techniques, surprisingly the semidiurnal tides are almost identical. The amplitudes track each other to within the standard errors throughout nearly all of the year, showing stronger tides than those predicted by the HWM-93 model during summer when the non-migrating S=1 component of the semidiurnal
Fig. 9. Meridional wind and tide climatologies generated from the SuperDARN radar (thick dashed red line) and IDI 90–95 km height bin (thick solid black line). The thin lines represent the climatolo-gies generated for equivalent sampling volumes from the HWM-93 model (note: on some panels these overlap).
tide becomes dominant at Halley latitudes (Baumgaertner et al., 2006). The phases are also in good agreement between the two techniques, only differing by a significant amount around the summer months.
The source of the differences in the derived meridional mean winds is discussed further in Sect. 7. Here we consider whether the increased variance in the IDI data, and in partic-ular the strong diurnal and seasonal cycle in the IDI variance, could bias the derived mean winds and tides determined from the least squares fitting procedure used here. For each month, a four-day synthetic wind and tide field was generated based on the monthly mean winds and tides determined from the SuperDARN radar. These four-day segments of hourly data were combined with a normal distribution of white noise, the amplitude of which was determined from the standard devia-tions of the hourly mean IDI winds presented in Fig. 4. In this way SuperDARN winds and tides with IDI-like noise levels were generated. These synthetic tides were passed through the fitting routine described in Sect. 2. This procedure was repeated 200 times for each month with a different realisation
Fig. 10. Meridional wind and tide climatologies generated from the SuperDARN radar as in Fig. 9 (solid black line) and those de-rived from SuperDARN hourly mean winds with IDI-like noise lev-els (dashed red line).
of white noise for each iteration. The resulting mean winds and tides were then averaged by calendar month and are re-produced in Fig. 10 for comparison with the original winds and tides derived from the SuperDARN radar data. The mean winds and tides derived from the SuperDARN data with IDI-like variance are essentially the same as those derived from the original SuperDARN data. There is a slight tendency for the increased variance to reduce the derived tidal ampli-tudes (e.g. in the diurnal tide observed in September and Oc-tober), but the derived phases are consistent, and the differ-ences are much smaller than the observed differdiffer-ences in the mean winds and diurnal tides derived from the two separate techniques. It is therefore apparent that the strong seasonal and diurnal variations observed in the IDI winds do not sig-nificantly bias the winds and tides derived from the fitting routines used here.
5 RMA regression
To determine if there is a tendency for one technique to measure systematically stronger winds than the other, a
R. E. Hibbins and M. J. Jarvis: IDI/SuperDARN comparison 1373
Fig. 11. Scatter plot of the daily mean meridional winds recorded by the SuperDARN radar and the IDI 90–95 km height bin. In-cluded on the plot are the RMS regression line (solid) and the linear regression lines assuming each of the two variables is independent (dashed).
reduced major axis (RMA) regression analysis (Sokal and Rohlf, 1981) was undertaken on the daily-mean meridional winds. Linear regression is inappropriate in this case as it assumes one independent variable with zero associated er-ror and hence the gradient of any fit will tend towards the axis on which the independent variable is plotted. To illus-trate this Fig. 11 shows a scatter plot of the daily meridional mean winds recorded by the two techniques. Overplotted are the least squares fit lines assuming linear regression with each technique as the assumed independent variable, and the RMA regression which gives a good estimate of the true re-lationship between two variables provided the errors associ-ated with one technique are less than a factor of three differ-ent than the errors in the other. The fits show that the Su-perDARN meridional winds are systematically weaker than those recorded by the IDI with fits to the data giving a straight line of the form:
VSD = 0.62(±0.02).VIDI + 0.13(±0.13)
where V is the meridional wind and the subscripts SD and IDI refer to the SuperDARN and IDI (90–95 km height bin) radars. The weakness of the SuperDARN meridional winds is likely to be due to the significant back lobe of the Super-DARN radar which is a mirror image of the forward radi-ation pattern (Milan et al., 1997) and at Halley points ap-proximately equatorwards. Arnold et al. (2003) have shown that the meridional winds recorded in the Finland CUT-LASS radar can be reduced by between 20% and 50% due to contamination of the wind field by meteors detected in the
Fig. 12. Monthly mean meridional winds versus monthly mean F10.7 index for the IDI 90–95 km height bin (top) and the Super-DARN radar (bottom). Included on the plots are the lines of least squares fit.
radar’s back lobe depending on the operating frequency, time of day and season with the largest effect seen at the lowest frequencies when the meteor echoes are strongest. These val-ues are in good agreement with the 38% reduction in merid-ional winds seen in the Halley SuperDARN radar compared with the IDI over the 11 years of operation. This observation is further supported here when the RMA regression analysis is repeated separating the data into summer and non-summer months. During the summer months of November to Febru-ary inclusive, when the SuperDARN echoes are strongest the RMA gradient is 0.55(±0.03) whereas outside these months when the echoes are typically weaker the gradient increases to 0.69(±0.02). Hence the SuperDARN meridional winds are closer in magnitude to the IDI winds when the echoes are weaker and the contribution from meteors detected from the radar’s back lobe is lessened.
6 Long term change
The 11 years of data presented here span the complete cy-cle 23 of solar activity presenting an opportunity to search for deviations from the climatological mean in the winds and tides caused by variations in solar flux. Figure 12 shows a plot of the monthly mean deviation from the climatolog-ical mean in the meridional wind in both the IDI and Su-perDARN radars versus the solar activity proxy measured
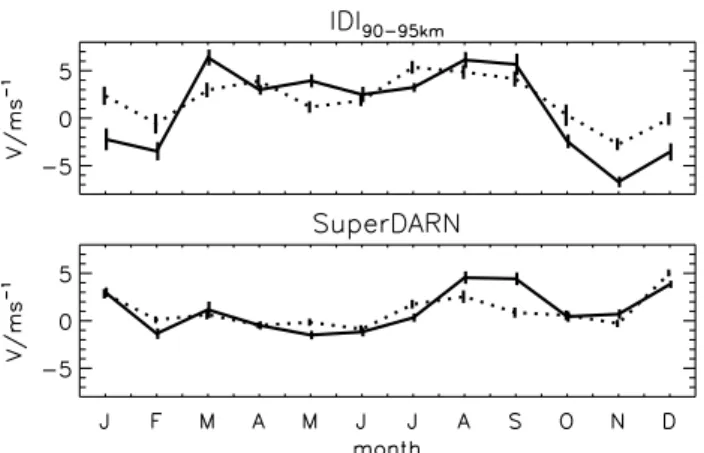
Fig. 13. Meridional wind climatology generated from the IDI 90– 95 km height bin (top) and the SuperDARN radar (bottom). Solid line: data from 1999–2002 inclusive (high solar activity), dashed line: data from 1996–1998 and 2003–2006 inclusive (low solar ac-tivity).
by the monthly mean observed flux of solar radiation at a wavelength of 10.7 cm. Although the scatter in the data are greater, the IDI meridional winds clearly show a more polewards tendency at periods of high solar activity that is not reproduced in the SuperDARN meridional winds. The gradient of a linear least squares fit gives a mean varia-tion of −2.21(±0.90)×10−2ms−1/SFU corresponding to a 3.7(±1.5) ms−1difference over a typical 170 SFU solar cy-cle, whereas this trend is not reproduced in the SuperDARN monthly meridional wind field over the same time period where a similar linear regression yields an insignificant gra-dient of −1.10(±42.0)×10−4ms−1/SFU.
Detailed discussions of the causes of these long term trends are beyond the scope of this paper and will be pre-sented elsewhere, though as comparisons are averaged over a whole cycle of solar activity it is clear comparison of the two techniques during periods of high solar activity will draw dif-ferent conclusions from comparisons undertaken during solar minimum. To emphasise this point, Fig. 13 shows a merid-ional wind climatology as presented in Fig. 9 for the IDI and SuperDARN radars derived from two separate time pe-riods representing typically high solar activity (1999–2002) and typically low solar activity (1996–1998 and 2003–2006). The two climatologies generated from the SuperDARN me-teor winds are both similar, apart from a single anomalous point in September, showing the insensitivity of the merid-ional winds to solar cycle. However the IDI climatologies show that at high solar activity the meridional winds are sig-nificantly more poleward throughout the summer months of October through to February. Comparison with Fig. 9 shows that the monthly mean meridional winds derived from the two techniques agree much better throughout the year during low solar activity.
above 80 km altitude, they found good agreement between the two techniques except in the region of maximum wind shear above 90 km where the meridional winds were seen to be much weaker in the IDI derived winds, an effect ascribed to interference from gravity waves preferentially propagating in the north-south direction. On timescales of one hour we find relatively poor correlations between the winds recorded by the IDI and the SuperDARN radar probably due to the two radars recording different gravity waves. Jones et al. (2003), in a more extensive study, compared an IDI system with a VHF SkiYMET all-sky meteor radar equipped with height finding over a four month period between November 2000 and March 2001 at Bear Lake observatory (42◦N, 111◦W). They found qualitatively good agreement between the two techniques, though histograms of the difference between the hourly mean winds recorded by the two techniques gener-ated distributions with an offset of up to 8 ms−1and standard deviations of up to 26 ms−1at 98 km altitude. However, be-tween the overlapping height ranges of 80–95 km during this period when the semidiurnal tide was strong, they concluded that there was a tendency for the tides derived from meteor winds to be up to 10% stronger than those derived by the IDI. The wintertime semidiurnal tides presented here derived from both radars are very similar in magnitude.
Hall et al. (1997) compared SuperDARN meteor wind ve-locities from a single beam of the Saskatoon radar with those determined from a co-located MF radar. During both Au-gust and January 1994 both techniques correlated best when comparing the MF radar winds recorded around 90(±10) km altitude, although the correlation coefficients were higher in summer than in winter. In addition they observed that the MF horizontal wind velocities at 97 km altitude were about 16% greater than those determined from the SuperDARN single beam during August 1994, a difference largely ascribed to the 200–300 km differing locations of the scattering points from the two radars. By comparing the phase of the semidiur-nal tide in each technique during those months of 1994 when the phase was seen to change rapidly with height they ob-served a best fit in phase of the SuperDARN winds with the MF radar winds recorded at 94(±3) km. Hussey et al. (2000) extended this work to observe winds with a MF and Super-DARN radar at Saskatoon and concluded “the two systems complement each other effectively”. Over a two week pe-riod in September 1997 they observed strong semidiurnal
R. E. Hibbins and M. J. Jarvis: IDI/SuperDARN comparison 1375 tides in both techniques and saw that the SuperDARN radar
matched best with the MF radar at an altitude of 94–97 km based on the phase of the semidiurnal tide. In addition they concluded that the MF radar winds were approximately 10% smaller than those observed by the SuperDARN radar based on the means of the 12-h oscillations. The present study also concludes that the semidiurnal tide is in good agreement be-tween the two techniques with the SuperDARN radar gen-erating a best fit to the IDI semidiurnal tides at an altitude of 90–95 km, but with the IDI typically producing slightly larger summer time semidiurnal tidal amplitudes than those derived from the SuperDARN winds. Arnold et al. (2003), in a more extensive comparative study, derived meridional wind climatologies based on one year of data recorded between September 1999 and September 2000 from the Hankasalmi SuperDARN radar in Finland and a VHF meteor radar lo-cated around 700 km away in Kiruna, Sweden. They found best agreement between the two climatologies occurred from data recorded between 06:00 and 18:00 UT when the Super-DARN radar was operating at 12 MHz and contamination from the back lobe of the SuperDARN radar was minimised. Otherwise the SuperDARN winds were found to be up to 50% weaker than the VHF meteor radar winds, although a statistical variance test on the derived climatologies showed better agreement between the SuperDARN and VHF radars than was found by separating the VHF meteor echoes into north and south centred quadrants, suggesting a significant geographical variation in the observed winds. The data pre-sented here also show that the SuperDARN meridional winds are suppressed with respect to the IDI winds by between 30 and 45% depending on the season, though these values are also shown to be dependent on the phase of the solar cycle due to the tendency for the IDI meridional winds to change with solar activity.
8 Summary
This paper has presented the first direct comparison of hor-izontal winds derived from an approximately co-located imaging Doppler interferometer and SuperDARN radar, and the first comparison of any two MLT wind radars to span a complete solar cycle. We have demonstrated that correla-tions between the parameters derived from these two radars vary on timescales ranging from hours to years, and that a true assessment of the differences between the two tech-niques requires simultaneous co-located long-term data sets. Care must be taken when combining data recorded by dif-ferent techniques to derive empirical models or to study the zonal structure and geographic extent of tides and plane-tary waves. The poor correlations between the hourly-mean winds are probably due to differences in the observed gravity wave field. However, when the daily mean winds are sepa-rated from the influence of the tides, the winds derived from two techniques are seen to correlate much better, with the
SuperDARN radar generating systematically weaker merid-ional winds due to the geometry of the radar’s radiation pat-tern. Monthly mean climatologies generated by the two tech-niques show good agreement in the winds and semidiurnal tides, but very poor agreement in the derived diurnal tidal amplitudes and phases. This is shown to be unrelated to the strong diurnal and seasonal variation in the standard devia-tion in the hourly mean winds used to fit the tides. Finally, in-terannual variations between the two techniques have shown that the meridional wind derived by the IDI is influenced by solar activity to a much greater degree than the SuperDARN winds, so much so that a climatology derived from IDI winds around solar maximum is significantly different from that recorded around solar minimum especially in summer time when the meridional winds recorded at periods of high solar activity are around 5 ms−1more poleward than at low solar
activity.
Acknowledgements. The authors would like to thank the staff of
the Engineering and Data Management Group of the Physical Sciences Division at the British Antarctic Survey for their technical assistance, and for the maintenance and operation of the Halley IDI and SuperDARN radars over the years. C. Lee is thanked for his assistance in the processing of some of the data presented in this paper. The Halley SuperDARN radar was developed under funding from NERC and NSF (grant DPP-8602975).
Edited by: F.-J. L¨ubken
References
Adams, G. W., Edwards, D. P., and Brosnahan, J. W.: The imaging Doppler interferometer: Data analysis, Radio Sci., 20(6), 1481– 1492, 1985.
Adams, G. W., Brosnahan, J. W., Walden, D. C., and Nerney, S. F.: Mesospheric observations using a 2.66-MHz radar as an imag-ing Doppler interferometer – description and first results, J. Geo-phys. Res., 91(A2), 1671–1683, 1986.
Arnold, N. F., Cook, P. A., Robinson, T. R., Lester, M., Chapman, P. J., and Mitchell, N.: Comparison of D-region Doppler drift winds measured by the SuperDARN Finland HF radar over an annual cycle using the Kiruna VHF meteor radar, Ann. Geophys., 21, 2073–2082, 2003,
http://www.ann-geophys.net/21/2073/2003/.
Baumgaertner, A. J. G., Jarvis, M. J., McDonald, A. J., and Fraser, G. J.: Observations of the wavenumber 1 and 2 components of the semi-diurnal tide over Antarctica, J. Atmos. Solar-Terr. Phys., 68(11), 1195–1214, 2006.
Charles, K. and Jones, G. O. L.: Mesospheric mean winds and tides observed by the Imaging Doppler Interferometer (IDI) at Halley, Antarctica, J. Atmos. Solar-Terr. Phys., 61(5), 351–362, 1999. Espy, P. J., Hibbins, R. E., Riggin, D. M., and Fritts D. C.:
Meso-spheric planetary waves over Antarctica during 2002, Geophys. Res. Lett., 32, L21804, doi:10.1029/2005/GL023886, 2005. Forbes, J. M., Makarov, N. A., and Portnyagin, Yu. I.: First results
from a meteor radar at South Pole: A large 12-hour oscillation with zonal wavenumber one, Geophys. Res. Lett., 22(23), 3247– 3250, 1995.
Hall, G. E., MacDougall, J. W., Moorcroft, D. R., St.-Maurice, J.-P., Manson, A. H., and Meek, C. E.: Super Dual Auroral Radar Net-work observations of meteor echoes, J. Geophys. Res., 102(A7), 14 603–14 614, 1997.
Hedin, A. E., Fleming, E. L., Manson, A. H., Schmidlin, F. J., Av-ery, S. K., Clark, R. R., Franke, S. J., Fraser, G. J., Tsuda, T., Vial, F., and Vincent, R. A.: Empirical wind model for the up-per, middle and lower atmosphere, J. Atmos. Terr. Phys., 58(13), 1421–1447, 1996.
Hibbins, R. E., Espy, P. J., and Jarvis, M. J.: Mean winds and tides in the mesosphere and lower thermosphere above Halley, Antarc-tica, J. Atmos. Solar-Terr. Phys., 68, 436–444, 2006.
Hines, C. O., Adams, G. W., Broshnahan, J. W., Djuth, F. T., Sulzer, M. P., Tepley, C. A., and Van Baelen, J. S.: Multi-instrument ob-servations of mesospheric motions over Arecibo: Comparisons and interpretations, J. Atmos. Terr. Phys., 55, 241–287, 1993. Hussey, G. C., Meek, C. E., Andr´e, D., Manson, A. H., Sofko,
G. J., and Hall, C. M.: A comparison of Northern Hemisphere winds using SuperDARN meteor trail and MF radar wind mea-surements, J. Geophys. Res., 105(D14), 18 053–18 066, 2000. Jarvis, M. J., Jones, G. O. L., and Jenkins, B.: New initiatives in
ob-serving the Antarctic mesosphere, Adv. Space Res., 24(5), 611– 619, 1999.
Jenkins, B., Jarvis, M. J., and Forbes, D. M.: Mesospheric wind ob-servations from SuperDARN HF radar meteor echoes at Halley, Antarctica: preliminary results, Radio Sci., 33, 957–965, 1998. Jenkins, B. and Jarvis, M. J.: Mesospheric winds derived from
Su-perDARN HF radar meteor echoes at Halley, Antarctica, Earth Planet. Space, 51, 685–689, 1999.
http://www.ann-geophys.net/15/29/1997/.
Murphy, D. J., Forbes, J. M., Walterscheid, R. L., Hagan, M. E., Avery, S. K., Aso, T., Fraser, G. J., Fritts, D. C., Jarvis, M. J., McDonald, A. J., Riggin, D. M., Tsutsumi, M., and Vin-cent, R. A.: A climatology of tides in the Antarctic mesosphere and lower thermosphere, J. Geophys. Res., 111(D23), D23104, doi:10.1029/2005JD006803, 2006.
Portnyagin, Yu., Solovjova, T., Merzlyakov, E., et al.: Meso-sphere/lower thermosphere prevailing wind model, Adv. Space Res., 34(8), 1755–1762, 2004.
Press, W. H., Flannery, B. P., Teukolsky, S. A., and Vetterling, W. T.: Numerical Recipes in C: The Art of Scientific Computing, 2nd edition, Cambridge University Press, 1992.
Sokal, R. R. and Rohlf, F. J.: Biometry, 2nd edition, Freeman, NY, 1981.
Turek, R. S., Roper, R. G., and Brosnahan, J. W.: Further direct comparisons of incoherent scatter and medium frequency radar winds from AIDA ’89, J. Atmos. Solar-Terr. Phys., 60(3), 337– 347, 1998.
Wright, J. W. and Pitteway, M. L. V.: Real-time data acquisition and interpretation capabilities of the Dynasonde, 2. Determination of magnetoionic mode and echo location using a small spaced re-ceiving array, Radio Sci., 14(5), 827–835, 1979.
Yukimatu, A. S. and Tsutsumi, M.: A new SuperDARN meteor wind measurement: Raw time series analysis method and its application to mesopause region dynamics, Geophys. Res. Lett. 29(20), 1981, doi:10.1029/2002GL015210, 2002.