Preprint typeset in JINST style - HYPER VERSION
Tracking within Hadronic Showers in the
CALICE SDHCAL prototype using a Hough
Transform Technique
The CALICE Collaboration
Z. Deng, Y. Li, Y. Wang, Q. Yue, Z. YangTsinghua University, Department of Engineering Physics, Beijing, 100084, P.R. China D. Boumediene, C. Carloganu, V. Français
Université Clermont Auvergne, Université Blaise Pascal, Université Blaise Pascal, CNRS/IN2P3, LPC, 4 Av. Blaise Pascal, TSA/CS 60026, F-63178 Aubière, France
G. Cho, D-W. Kim, S. C. Lee, Z. Liu, W. Park, S. Vallecorsa Gangneung-Wonju National University, Gangnung 25457, South Korea
S. Cauwenbergh, M. Tytgat, A. Pingault, N. Zaganidis
Ghent University, Department of Physics and Astronomy, Proeftuinstraat 86, B-9000 Gent, Belgium
O. Bach, E. Brianne, A. Ebrahimi, K. Gadow, P. Göttlicher, O. Hartbrich1,
A. Irles, K. Kotera2, F. Krivan, K. Krüger, S. Lu, C. Neubüser3, A. Provenza, M. Reinecke, F. Sefkow, S. Schuwalow, Y. Sudo, H.L. Tran
DESY, Notkestrasse 85, D-22603 Hamburg, Germany H. Hirai, K. Kawagoe, T. Suehara, H. Sumida, T. Yoshioka,
Department of Physics and Research Center for Advanced Particle Physics, Kyushu University, 744 Motooka, Nishi-ku, Fukuoka 819-0395, Japan
E. Cortina Gil, S. Mannai
Center for Cosmology, Particle Physics and Cosmology (CP3) Université catholique de Louvain, Chemin du cyclotron 2, 1320 Louvain-la-Neuve, Belgium
V. Buridon, C. Combaret, L. Caponetto, R. Eté, G. Garillot, G. Grenier, R. Han4, J.C. Ianigro, R. Kieffer5, T. Kurca, I. Laktineh, B. Li, N. Lumb,
H. Mathez, L. Mirabito, A. Petrukhin6, A. Steen7
Univ. Lyon, Université Lyon 1, CNRS/IN2P3, IPNL 4 rue E Fermi 69622, Villeurbanne CEDEX, France
J. Berenguer Antequera, E. Calvo Alamillo, M.-C. Fouz, J. Marin, J. Navarrete, J. Puerta-Pelayo, A. Verdugo
CIEMAT, Centro de Investigaciones Energeticas, Medioambientales y Tecnologicas, Madrid, Spain
F. Corriveau
Department of Physics, McGill University, Ernest Rutherford Physics Bldg., 3600 University Ave., Montréal, Québec, Canada H3A 2T8
M. Chadeeva8
P. N. Lebedev Physical Institute, Russian Academy of Sciences, 117924 GSP-1 Moscow, B-333, Russia
M. Gabriel, P. Goecke, C. Graf, Y. Israeli, N. van der Kolk, F. Simon, M. Szalay, H. Windel
Max-Planck-Institut für Physik, Föhringer Ring 6, D-80805 Munich, Germany
S. Bilokin, J. Bonis, R. Pöschl, A. Thiebault, F. Richard, D. Zerwas Laboratoire de l’Accélerateur Linéaire, CNRS/IN2P3 et Université de Paris-Sud XI,
Centre Scientifique d’Orsay Bâtiment 200, BP 34, F-91898 Orsay CEDEX, France
M. Anduze, V. Balagura, E. Becheva, V. Boudry, J-C. Brient, R. Cornat,
F. Gastaldi, Y. Haddad9, F. Magniette, J. Nanni, M. Ruan10, M. Rubio-Roy,
K. Shpak, T.H. Tran, H. Videau, D. Yu11
Laboratoire Leprince-Ringuet (LLR) – École Polytechnique, CNRS/IN2P3, Palaiseau, F-91128 France
S. Callier, F. Dulucq, Ch. de la Taille, G. Martin-Chassard, L. Raux, N. Seguin-Moreau
Laboratoire OMEGA – École Polytechnique, CNRS/IN2P3, Palaiseau, F-91128 France
J. Cvach, M. Janata, M. Kovalcuk, J. Kvasnicka12, I. Polak, J. Smolik, V. Vrba,
J. Zalesak, J. Zuklin
Institute of Physics, The Czech Academy of Sciences, Na Slovance 2, CZ-18221 Prague 8, Czech Republic
1Now at University of Hawaii, Manoa.
2Now at xy University.
3Now at CERN.
4Now at CAST, Beijing.
5Now at CERN.
6Now at Siegen University, Siegen.
7Now at the National Taiwan University, Taipei.
8Also at MEPhI.
9Now at Imperial College, London.
10Now at IHEP, Beijing.
11Also at at IHEP, Beijing.
12Also at DESY.
?Corresponding authors
E-mail: [email protected],[email protected],
ABSTRACT: The high granularity of the CALICE Semi-Digital Hadronic CALorimeter
(SDHCAL) provides the capability to reveal the track segments present in hadronic show-ers. These segments are then used as a tool to probe the behaviour of the active layers in situ, to better reconstruct the energy of these hadronic showers and also to distinguish them from electromagnetic ones. In addition, the comparison of these track segments in data and the simulation helps to discriminate among the different shower models used in the simulation. To extract the track segments in the showers recorded in the SDHCAL, a Hough Transform is used after being adapted to the presence of the dense core of the hadronic showers and the SDHCAL active medium structure.
Contents
1. Introduction 2
2. Hough Transform tracking in the SDHCAL 2
2.1 Hough Transform method 2
2.2 Hough Transform in a hadronic shower 4
2.3 Hough-Transform tracks within hadronic showers in the SDHCAL 6
3. Use of Hough Transform tracks in the SDHCAL 7
3.1 Calibration purposes and PFA applications 7
3.2 Hadronic shower energy reconstruction 9
3.3 Electromagnetic and hadronic shower separation 12
4. Tracks in hadronic shower models 13
5. Conclusion 15
6. Acknowledgements 17
1. Introduction
Hadronic showers produced by the interaction of hadrons in the absorber part of a sampling calorimeter like the CALICE SDHCAL prototype [1] often contain several track segments associated to charged particles. Some of these particles cross several active layers be-fore being stopped or reacting inelastically and others could even escape the calorimeter. High-granularity calorimeters provide an excellent tool to reconstruct such track segments. These segments could be used to monitor the active layers of the calorimeters in situ. They allow a better understanding of the response of the calorimeter and consequentially a better estimation of the hadronic energy. In addition, they help in the comparaison of the differ-ent hadronic shower models used in the simulation [2]. The capability of the calorimeter to construct such tracks depends on its granularity. The higher the granularity, the lower the confusion between such track segments and the remaining parts of the hadronic shower. Still, even with a highly-granular calorimeter, it is difficult to separate the track segments from the highly dense environment present in showers produced by high-energy hadrons. To achieve such a separation efficiently in the SDHCAL we propose to use the Hough Transform (HT) method [3] that was developed more than half a century ago to find tracks in a noisy environment.
In this paper we present the results obtained by applying the HT method to extract track segments in hadronic showers collected during the exposure of the SDHCAL prototype to hadron beams at the H2 CERN SPS beam line in 2012, and we show how these track segments can be used to study the response of the active medium of the calorimeter in situ and how they can help to better understand the hadronic shower structure to improve on the estimation of its energy. The paper is organized as follows: sect. 2 introduces the HT method and explains how the method is applied in the case of a dense environment such as that encountered in hadronic showers. In sect. 3 the use of the HT track segments as a tool to monitor the efficiency and pad multiplicity of the active layers of the hadronic calorimeter is presented. Their exploitation to improve on the hadronic energy resolution and to separate electromagnetic from hadronic showers is also discussed. In sect. 4, we show how the method is applied to estimate the number of track segments, their length and direction with respect to the incoming hadron in the data collected by the SDHCAL prototype and in simulated events using a few models. A comparison among these models and the data is presented.
2. Hough Transform tracking in the SDHCAL
2.1 Hough Transform method
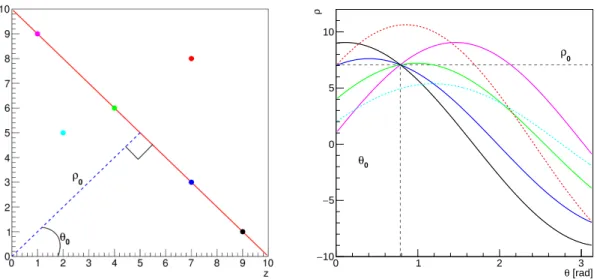
recognised among scattered points and the parameters of the straight line joining them to be reconstructed. The scope of this method is larger than what is presented here but all the variants of this method are based on the same principle. To search for points located on a straight line in a plane (say (z, x)), the Cartesian coordinates of each point present in the plane are used to define a curve in the associated polar plane (θ , ρ) [4]:
ρ = z cos θ + x sin θ (2.1)
Under this transformation aligned points have their curves intersecting at one node (θ0, ρ0)
of the polar plane. The node’s coordinates in the polar plane determine the angle of the straight line with respect to the ordinate axis of the (z, x) plane and the distance of the
straight line to its origin point as can be seen in figure 1. Curves associated to the other
points intersect also with those of the aligned ones. In scenarios with low density of points outside the track segments, these intersections scarcely coincide with (θ0, ρ0). Therefore, to find aligned points one should look for nodes in the (θ , ρ) plane. The number of in-tersecting curves in one node is an essential parameter to estimate the number of aligned points. In a dense environment the same method can be applied. However, one should take into account here the possibility that the points contributing to one node do not all necessarily belong to a given track.
The method described above cannot be applied as such to the hits (fired pads) left by par-ticles in a pixellated detector. The spatial resolution of the hit positions in the detector and more importantly the Multiple Coulomb Scattering (MCS) of the associated charged par-ticles requires the method to be adapted accordingly. This can be achieved by discretising the (θ , ρ) plane in a 2D histogram. For this histogram, the bins are incremented each time they are crossed by a curve associated to one point in the (z, x) plane. The size of the bins reflects the expected resolution associated to the hits belonging to one particle and can be optimized to help finding not only straight tracks but also slightly curved ones. In this way the nodes of intersecting curves are replaced by bins whose content depends on the number of aligned hits.
The Hough Transform technique was proposed and successfully used in muon tracking in high energy physics [5, 6]. Here we propose to use it in calorimetry.
[rad] θ 0 1 2 3 ρ 10 − 5 − 0 5 10 /4 π = 0 θ 0 ρ
Figure 1. Illustration of the Hough Transform method. Each point on the left figure has its asso-ciated curve on the right one with the same colour. The curves assoasso-ciated to the points located on the straight line, intersect in the same point of the (θ , ρ) plane. Arbitrary units are used here for the illustration.
2.2 Hough Transform in a hadronic shower
The SDHCAL is made of 48 active layers interleaved with absorber plates, 2 cm thick each, made of stainless steel. Each active layer is segmented into 96 × 96 pickup pads of 1 cm×1 cm. Two adjacent pads are separated by 0.406 mm. Hits left by charged particles in one layer are represented by fired pads. Each of the pads is read out thanks to an in-dependent electronic channel providing a semi-digital information. Indeed, following the amount of charge induced in a pad, one, two or three thresholds could be crossed. The threshold values are fixed by software. They are chosen to indicate roughly if the pad is crossed by one, a few or many charged particles in order to improve on the hadronic shower energy reconstruction as explained in ref. [7]. A pad is fired if at least the lowest of the three thresholds is crossed. A small number of pads are fired by the passage of a single charged particle in an active layer. The average value of this number is called the pad multiplicity.
Hadronic showers are generally characterized by a dense core (electromagnetic part) lo-cated in the centre and a less dense part (the hadronic one) in the periphery. To use the Hough Transform to find tracks within hadronic showers one should avoid using hits lo-cated in the dense core since one can build artificially many tracks from the numerous hits of the core. This can be achieved by keeping only hits that have a small number of neighbours in the same layer. To apply the Hough Transform to the hadronic showers col-lected in the SDHCAL prototype, a system of coordinates is needed. In this paper the z
axis is chosen parallel to the beam and x and y are the horizontal and vertical axes parallel to the prototype layers. In order to reduce computing time and improve efficiency, the Hough Transform method is not applied to the hits themselves but to the clusters of hits resulting from aggregating topologically neighbouring hits in one active layer (x, y) plane. These clusters are built recursively. The first cluster is built starting from the first hit of the collection of hits found in a given layer. Adjacent hits sharing an edge or an angle with this first hit are looked for and are added to the cluster. Hits adjacent to any of these hits are again added. The procedure is applied until no new adjacent hit is found. The hits belonging to this cluster are tagged and withdrawn from the hit list. The same procedure is applied to a new hit chosen among the remaining ones of the plane and repeated until all the hits are gathered into clusters.
The coordinates of a resulting cluster are that of the geometrical barycentre of its hits. Of all the clusters only those with less than 5 hits are kept since clusters belonging to track segments are expected to have at most 4 hits in the (x, y) plane. To eliminate the contribu-tion of the shower’s dense part, clusters are rejected if they have more than 2 neighbouring clusters in an area of 10 cm×10 cm around or if one cluster with more than 5 hits is found in this area.
To look for 3D track segments our method is based on applying the Hough Transform to the (z, x) coordinates of all the remaining clusters to find the candidate segments in the plane (z, x). A second Hough Transform iteration is then applied to the (z, y) coordinates of the hits associated to each of the candidate segments found in the first step. This allows the elimination of hits accidentally aligned with the track segment’s hits in one plane while reconstructing 3D track segments and find their straight line parameters without going through the technically complicated 3D application of the Hough Transform as explained in the following:
The clusters are used to fill a 2D histogram with 100 bins in the range 0 < θ < π and 150 bins in the range 0 < ρ < 150 cm. From the (z, x) coordinates of each cluster, the ρ value
for each bin of θ is computed using eq.2.1 and an entry is made in the histogram.
After filling the histogram, bins with more than 6 entries are considered. The choice of 6 entries is a compromise between finding tracks long enough to perform efficiency studies and at the same time keeping tracks associated to low energy particles affected by multiple scattering as well as those produced by particles undergoing inelastic interactions.
Depending on the histogram binning, the neigbouring bins of the one where the curves intersect may also be crossed by more than six of these curves and are thus also selected. To find the right bin, only the most populated among adjacent bins is kept.
To eliminate the scenario of accidentally aligned clusters in the 2D (z, x) plane and not in the 3D (z, x, y) space, the (z, y) coordinates of the clusters belonging to one selected bin
are used to fill a second histogram (θ0, ρ0) with the same binning as the one used for (θ , ρ)
histogram. If any of the (θ0, ρ0) bins is found with more than 6 entries then among all the
previous clusters, only those which contribute to this bin are kept. The clusters found in this way are then used to build a track segment whose parameters are determined from the
four values : θ , ρ, θ0, ρ0. It is worth mentioning here that using the (z, y) plane followed
by the (z, x) plane gives similar results.
Finally, to eliminate tracks made of topologically uncorrelated clusters, each of the clusters associated to a one selected bin is compared to the other clusters of the same bin. The cluster is kept if at least two other clusters from the track are found in the 3 adjacent layers located before and after that of the considered cluster. This requirement is fulfilled in 99% of the cases for genuine tracks in the SDHCL.
2.3 Hough-Transform tracks within hadronic showers in the SDHCAL
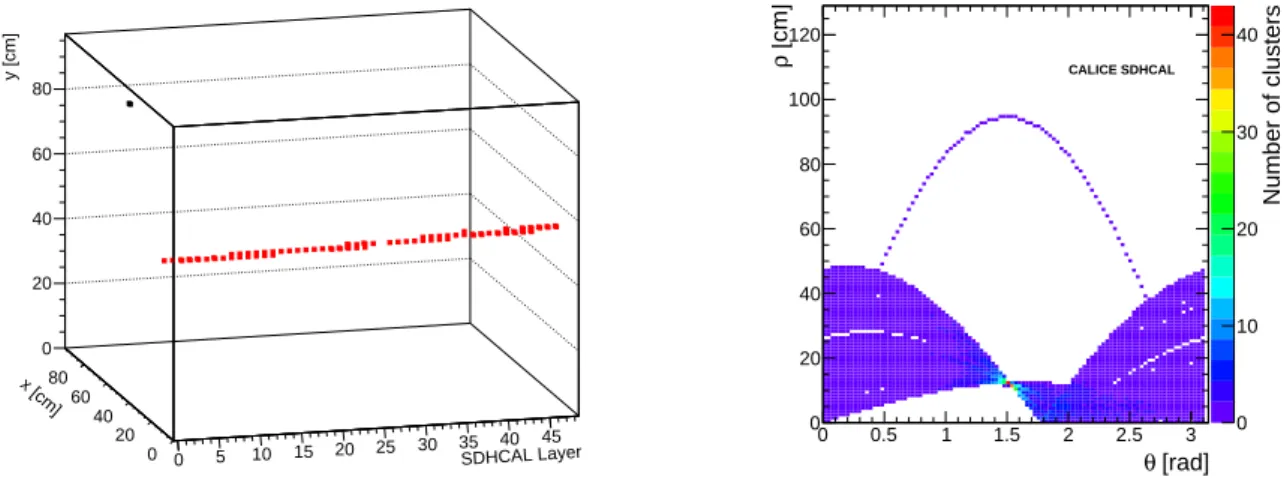
SDHCAL Layer 0 5 10 15 20 25 30 35 40 45 x [cm] 0 20 40 60 80 y [cm] 0 20 40 60 80 [rad] θ 0 0.5 1 1.5 2 2.5 3 [cm] ρ 0 20 40 60 80 100 120 Number of clusters 0 10 20 30 40 CALICE SDHCAL
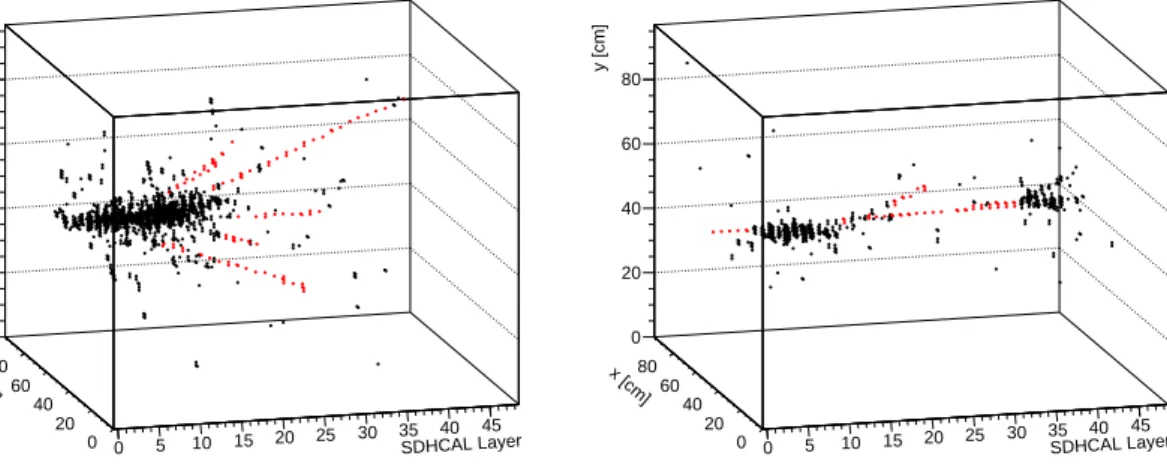
Figure 2. Left : Event display of a 50 GeV muon in the SDHCAL. The muon is impinging the SDHCAL perpendicularly to the (x, y) plane at a point around (x =12 cm, y = 53 cm). Red points are the identified hits belonging to a track while the black point is not. Right : Associated (θ , ρ) histogram which corresponds to the transformation of the (z, x) plane.
The Hough Transform method described in the previous section is first applied to cosmic and beam-muon events collected in the SDHCAL prototype during its exposure to particle beams at the CERN SPS in 2012. Most of the hits belonging to these events are found to
be well selected while noisy hits outside the particle path are not as is shown in figure2.
The Hough Transform method is then applied to events containing showers produced by negative pions. The auto-trigger mode used in operating the SDHCAL prototype leads to data containing all kinds of events. Electrons, cosmic and beam muons contaminating the hadronic events were rejected using topology-based criteria as described in [7]. The noise
contribution was also analyzed and found to be of the order of one hit per event which has negligible effect on the present study.
The energies of the collected hadronic showers cover a range going from 10 to 80 GeV. Many of the track segments of the hadronic showers are associated with low energy par-ticles that undergo multiple Coulomb scattering but are still able to cross a few active layers. To select such tracks one can either select Hough Transform histogram bins with a low number of clusters or increase the θ bin size of this histogram. The last option is technically simpler to apply and was therefore chosen. Although the algorithm used here is not optimized to reduce the CPU time, it is found that an average time of 0.16 ± 0.08 s is needed to analyze one hadronic shower of 80 GeV.
As an illustration of the method two event displays of hadronic showers at 30 and 80 GeV
are shown in figure3 with the Hough Transform selected hits.
SDHCAL Layer 0 5 10 15 20 25 30 35 40 45 x [cm] 0 20 40 60 80 y [cm] 0 20 40 60 80 SDHCAL Layer 0 5 10 15 20 25 30 35 40 45 x [cm] 0 20 40 60 80 y [cm] 0 20 40 60 80
Figure 3. Event display of 80 GeV (left) and 30 GeV (right) hadronic showers with hits belonging to tracks in red.
3. Use of Hough Transform tracks in the SDHCAL
3.1 Calibration purposes and PFA applications
The tracks one can extract from hadronic showers play an important role in checking the active layer behaviour in situ by studying the efficiency and multiplicity of the detector. To achieve such a study, high quality Hough Transform segments are selected. Indeed, the aligned clusters are fitted to straight lines in both the (z, x) and (y, x) planes using a least-χ2 technique. The variance (σ2) used in the χ2 definition here is the transverse cluster size
(number of pads in the cluster along x or y) divided by 12. Only tracks with χ2/NdF < 1
with NdF = Nl -2 are chosen, where Nl is the number of layers containing the clusters
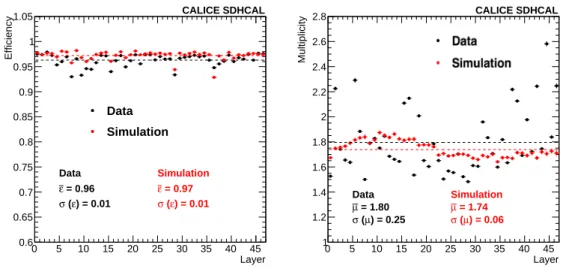
used to fit a straight line of 2 unknown parameters. To study one layer, only clusters belonging to the other layers are kept. The intercept of the straight line associated with the segment in the studied layer is determined. The efficiency of this layer is then estimated by looking for clusters in a 2 cm radius around the intercept. If at least one cluster is found, the multiplicity is then estimated by counting the number of hits associated to the closest cluster. Average efficiency and multiplicity per layer using the events collected in a 40
GeV pion run and that of simulated pion events of the same energy are shown in figure4.
These results are generally consistent with what was observed in ref. [7] where those two variables were estimated with beam muons. The slight difference, systematically positive, compared with the results obtained with beam muons (at the level of a few percent) is related to the fact that contrary to the latter the angle of the track segments in the hadronic shower is not necessarily perpendicular to the SDHCAL layers. This angular difference results in slightly higher efficiency and pad multiplicity with respect to that observed in cosmic muons [12]. Layer 0 5 10 15 20 25 30 35 40 45 Efficiency 0.6 0.65 0.7 0.75 0.8 0.85 0.9 0.95 1 1.05 Data Simulation Data = 0.96 ε ) = 0.01 ε ( σ Simulation = 0.97 ε ) = 0.01 ε ( σ CALICE SDHCAL Layer 0 5 10 15 20 25 30 35 40 45 Multiplicity 1 1.2 1.4 1.6 1.8 2 2.2 2.4 2.6 2.8 Data Simulation Data = 1.80 µ ) = 0.25 µ ( σ Simulation = 1.74 µ ) = 0.06 µ ( σ CALICE SDHCAL
Figure 4. Efficiency and multiplicity per layer for a 40 GeV pion in data (black dots) and in the simulation (red dots). Zones instrumented by faulty electronic ASICs are excluded. Values of the average efficiency ( ¯ε) and of the average hit multiplicity ( ¯µ ) as well as the RMS of the efficiency distribution (σ (ε)) and that of the hit multiplicity distribution (σ (µ)) of the 48 layers are also given.
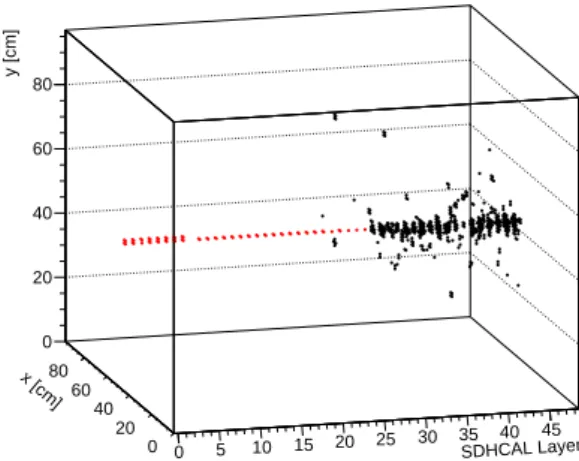
In addition to the use of track segments in hadronic showers to check the behaviour of the SDHCAL active layers, they could be useful in Particle Flow Algorithm (PFA) tech-niques [8–10]. Indeed, a by-product of this method is the possibility to tag the track segment associated to the incoming charged particle in the calorimeter as can be seen in figure 5. This is an interesting feature that could be exploited in PFA techniques where
SDHCAL Layer 0 5 10 15 20 25 30 35 40 45 x [cm] 0 20 40 60 80 y [cm] 0 20 40 60 80
Figure 5. Event display of a 80 GeV pion in the SDHCAL. The track (in red) before the shower starts, is well identified and could be useful for PFA.
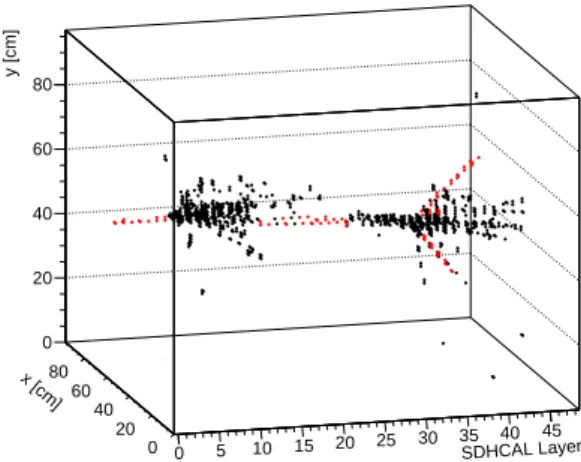
the contribution of charged hadrons is to be separated from that of neutral ones. If a tracker is placed in front of the calorimeter, the connection between the track segment in the calorimeter and that of the tracker leads to a better estimation of the charged hadron energy by using its momentum which is often more precisely measured in the tracker. Track segments could also be used to separate nearby hadronic showers by connecting clusters produced by hadronic interactions of secondary charged particles to the main one
as can be seen in figure6. A successful association increases the probability to attach
cor-rectly the clusters to the right particle reducing thus the confusion between the charged and neutral hadrons and preventing a possible energy double-counting. To quantify however the real contribution of using such track segments in improving the PFA performance a detailed study is needed.
3.2 Hadronic shower energy reconstruction
Another potential advantage of the track segments is to improve on the energy reconstruc-tion. In the SDHCAL energy reconstruction method, each of the thresholds is given a dif-ferent weight [7] to account for the number of tracks crossing one pad. The reconstructed energy is estimated as
Ereco= αN1+ β N2+ γN3 (3.1)
where N1corresponds to the number of hits which are above the first threshold and below
SDHCAL Layer 0 5 10 15 20 25 30 35 40 45 x [cm] 0 20 40 60 80 y [cm] 0 20 40 60 80
Figure 6. 50 GeV hadronic shower illustrating that connection between clusters could be done with the reconstructed tracks.
but below the third threshold and N3the number of hits that are above the third threshold.
α , β and γ are parameterized as quadratic functions of the total number of hits (Nhit =
N1+ N2+ N3).
Tracks of low energy that stop inside the calorimeter may have hits passing the second
or the third threshold, especially those located at the end of the segment1. These hits of
a single track segment may bias the energy estimation based on this method. Therefore, giving the same weight for all the hits belonging to these track segments could improve on the energy reconstruction. To check this assumption, the same procedure of energy re-construction for hits others than those selected by the HT method is applied and a constant weight is assigned to the latter as follows:
ErecoHT = α0N10+ β0N20+ γ0N30+ cNHT (3.2)
where NHT is the number of hits belonging to track segments selected by the HT method.
N10, N20 and N30 are respectively N1, N2 and N3after subtracting the hits belonging to track
segments. α0, β0 and γ0 are new quadratic functions of the total number of hits (Nhit =
N10+ N20+ N30+ NHT).
1The high ionisation value dE/dx of the tracks at the end produces more charges and thus hits of the higher thresholds are often observed.
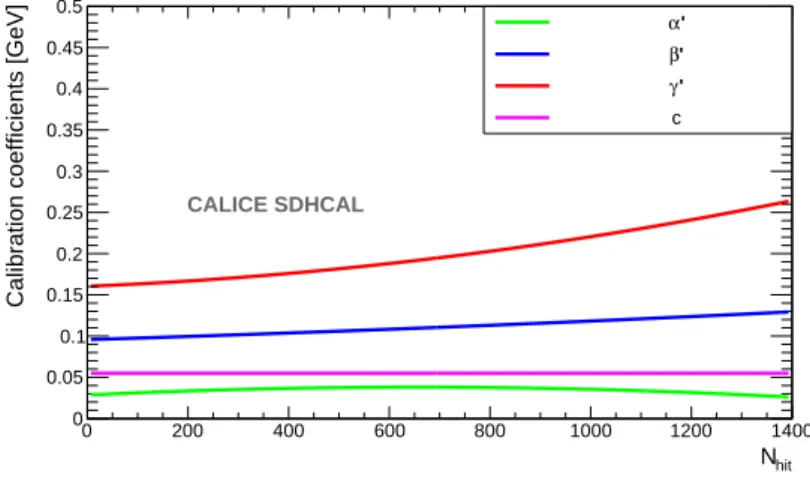
A χ2-like optimization procedure similar to the one described in ref. [7] is then performed
to determine the nine parameters associated to α0, β0 and γ0 functions as well as the
pa-rameter c. The evolution of α0, β0 and γ0as a function of Nhit as well as the constant c is
presented in figure7.
hit
N
0 200 400 600 800 1000 1200 1400
Calibration coefficients [GeV]
0 0.05 0.1 0.15 0.2 0.25 0.3 0.35 0.4 0.45 0.5 CALICE SDHCAL ' α ' β ' γ c
Figure 7. Evolution of the coefficients α0 (green), β0 (blue), γ0 (red) and c (magenta) in terms of
the total number of hits Nhit.
The energy of the hadronic events collected in the H2 test beam in 2012 is then estimated using the new formula of eq. 3.2. To estimate the energy resolution the same recipe of [7] is applied. First, a Gaussian is used to fit over the whole full range of the distribution. Then, a Gaussian is fitted only in the range of ±1.5σ of the mean value of the first fit. The σ of the second fit is used as the energy resolution R(EHTreco) and the new mean value as the reconstructed energy EHTreco. The relative energy resolution is thus given by the ratio R(EHTreco)/ EHTreco.
Results are then compared with those obtained in ref. [7]. The reconstructed energy ob-tained using the two methods as a function of the beam energy is shown in figure 8 (top). The relative difference of the two is also shown in figure 8 (bottom). Good linearity is ob-tained with the two methods. Figure 9 shows the energy resolution with the two methods as well as the relative difference. At energies higher than 40 GeV, where the second and third thresholds play an important role as explained in ref. [7], assigning the same weight to hits of track segments independently of their threshold improves the energy resolution by a few percent though it makes the linearity slightly worse. In addition, the higher the energy the more the number of track segments produced in hadronic showers as will be shown in section 4 which explains why the improvement is enhanced with the energy. Finally, the fact that the second and third threshold hits of the track segments represent on average about 5 ‰ of the total number of hits and that the contribution to the energy reconstruction of these high-threshold hits based on eq. 3.1 is a few times higher than
the one they have by using eq. 3.2, as can be seen in figure 7, could explain the relative improvement of a few percent observed in applying the new method.
Statistical and systematic uncertainties are included in the results shown in the previous figures. The sources of the systematic uncertainties included in this study are the same as those detailed in ref. [7]. These sources are the ones related to the method used to estimate the energy resolution, the hadronic events selection criteria, the effect of the beam intensity and the uncertainty of the beam energy.
At low energy, the systematic uncertainties related to the measurement of the resolution and to the event selection are of the same order and dominate, while at high energy, the one due to the beam intensity correction represents about half of the total uncertainty. The uncertainty on the beam energy was found to be negligible in all cases.
[GeV] beam E 0 10 20 30 40 50 60 70 80 E/E ∆ -0.1 0 0.1 b) [GeV] 〉 reco E 〈 10 20 30 40 50 60 70 80 90 a) NO HT tracks HT tracks NO HT tracks HT tracks CALICE SDHCAL
Figure 8. a) Reconstructed energy using the standard method as presented in ref. [7] and the one using the HT track segments as a function of the beam energy. b) The relative difference of reconstructed energy ∆E/E= ((EHTreco-ENoHTreco )/ ENoHTreco ) for both methods as a function of the beam energy. Both statistical and systematic uncertainties are included in the error bars that are within the marker size.
3.3 Electromagnetic and hadronic shower separation
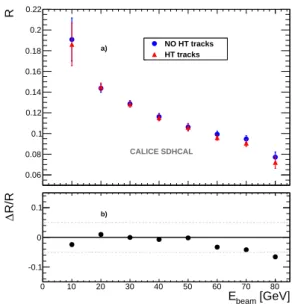
[GeV] beam E 0 10 20 30 40 50 60 70 80 R/R ∆ -0.1 0 0.1 b) [GeV] beam E 0 10 20 30 40 50 60 70 80 R 0.06 0.08 0.1 0.12 0.14 0.16 0.18 0.2 0.22 a) NO HT tracks HT tracks NO HT tracks HT tracks CALICE SDHCAL
Figure 9. a) Resolution R of the reconstructed energy using the standard method as presented in ref. [7] and the one using the HT track segments as a function of the beam energy. b) The
relative difference of reconstructed energy resolution ∆R/R = (R(EHTreco)-R( ENoHT
reco ) / R(ENoHTreco )) as a
function of the beam energy. Both statistical and systematic uncertainties are included in the error bars. They are within the marker size in the bottom plot.
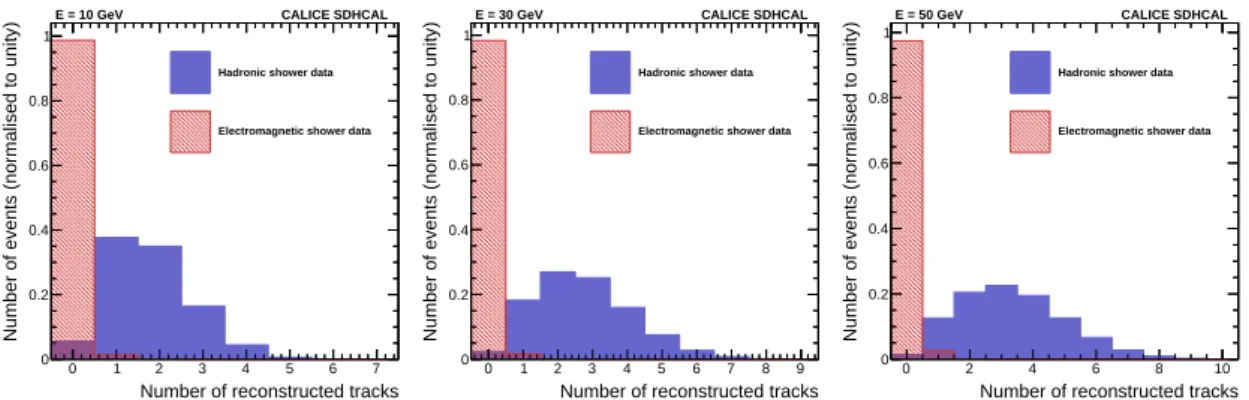
10 to 50 GeV energy range using a special filter during the 2012 SDHCAL beam test as explained in ref. [7]. The absence, as expected in electromagnetic shower, of such tracks in
the case of electrons, compared with pions as shown in figure10 shows the low probability
of the HT method to introduce fake tracks.
It is worth noting here that this difference in number of track segments between electro-magnetic and hadronic showers can also be used to discriminate the two species for particle identification purposes2. Requiring at least one track segment rejects indeed 99% (97%) of electromagnetic showers while keeping more than 95% (99%) of the hadronic showers at 10 (50) GeV respectively.
4. Tracks in hadronic shower models
The track segments produced in showers collected in the SDHCAL prototype can be used as a tool to compare different hadronic shower models used in the simulation. The number of tracks and their characteristics are related to those of charged particles (pions, kaons and protons) produced in the hadronic shower with an energy sufficient to cross a few absorber layers. In absence of high-granularity calorimeters such variables could not be
Number of reconstructed tracks
0 1 2 3 4 5 6 7
Number of events (normalised to unity)
0 0.2 0.4 0.6 0.8 1
E = 10 GeV CALICE SDHCAL
Hadronic shower data
Electromagnetic shower data
Number of reconstructed tracks
0 1 2 3 4 5 6 7 8 9
Number of events (normalised to unity)
0 0.2 0.4 0.6 0.8 1
E = 30 GeV CALICE SDHCAL
Hadronic shower data
Electromagnetic shower data
Number of reconstructed tracks
0 2 4 6 8 10
Number of events (normalised to unity)
0 0.2 0.4 0.6 0.8 1
E = 50 GeV CALICE SDHCAL
Hadronic shower data
Electromagnetic shower data
Figure 10. Number of reconstructed tracks in showers produced by electron (hatched histogram) and pions (filled histogram) at 10, 30 and 50 GeV.
easily used to tune the phenomenological models. Studying these segments in SDHCAL thus constitutes an unbiased tool to compare among the different models on the one hand and with the data on the other hand. Events with different energies produced by pion in-teractions in the SDHCAL prototype were simulated using a few hadronic shower models within the version 9.6p01 of the GEANT4 framework [11]. A digitizer [12] transforms the energy deposited by the particles crossing the active volumes into charges and induced signal in the neighbouring pads. In the case of a single charged particle crossing one pad of an active layer, the digitizer’s parameters are tuned to reproduce the efficiency and the pad multiplicity observed with beam muons. Cosmic muons are also used for this purpose to simulate correctly the track segments produced in hadronic showers at large angles with respect to the incoming hadron. The parameters are also optimized to reproduce the re-sponse of the GRPC to the passage of several charged particles in one pad by taking into account the charge screening effect. To do so, only the electron data are used in order to avoid biases when comparing the data with the simulation of the hadronic shower models. The same set of parameters is then used to simulate pion showers.
Three phenomenological models FTF_BERT_HP, QGSP_BERT_HP and FTF_BIC are studied. The tracks obtained using the HT in simulated events with these three models are compared to each other and to data for different energies. The distributions of the total number of reconstructed tracks within 10, 40 and 70 GeV hadronic showers are shown in
figure11. The track length could be an interesting variable to compare simulation models
with data. It is defined as the distance between the most upstream and downstream of the clusters belonging to a given HT selected track segment. Figure 12 shows the track length distribution of the data and the simulated events for the three energies. Another feature that may help to discriminate between the different hadronic models is the angular distribution of the track segments with respect to the incoming hadron. To determine the angle ψ of the track segments with the incoming hadron, the direction of the latter was determined by using a linear fit of the barycentre coordinates of the clusters in the first ten layers. The angular distribution of the track segments found with the HT method for
the same three energies is shown in figure13. Finally, in figure 14 are shown the average number of track segments (left), their average length (middle) and their average angle (right) with respect to the incoming pion as a function of the beam energy as obtained in simulated events using each of the three models and in data events. The three models seem to reproduce fairly well the number of reconstructed track segments observed in data with FTF_BERT_HP providing a better description at high energy but worse at 10 GeV. In the same way, FTF_BIC features slightly longer track segments with respect to the other models when compared with the data at high energy. All three models fail to describe adequately the angular distribution of the track segments. These results are in agreement with those found in the study of track segments in the CALICE AHCAL prototype [2] although here the model FTF_BERT_HP seems to describe slightly better the number of segments than the QGSP_BERT_HP while in ref. [2] the opposite is observed. This difference could be explained by the fact that the version 9.4p02 is used in in ref. [2] while here we use a more recent version (9.6p01) of the FTF_BERT_HP. The use of the version QGSP_BERT_HP(respectively (FTF_BERT_HP) here and the QGSP_BERT (respectively FTF_BERT) in ref. [2] should not in principle impact the comparison since the difference between the two versions is essentially related to the treatment of neutrons which is not relevant in this study.
In the present comparison only statistical uncertainties are included. Some sources of the systematic uncertainties such as the ones related to the minimum number of clusters required to apply the HT selection and the (θ , ρ) histogram binning are studied and found to be negligible. Although more detailed systematics study is needed, the low noise of the SDHCAL [7]3, the fact that the track efficiency per layer in data is well reproduced in the simulation [12] suggest that the contribution of the other systematic uncertainties will not modify the conclusion of this study. The impact of the difference in the track multiplicity which varies slightly from one layer to other in data while it is almost constant in the simulation is absorbed since clusters rather than the hits are used here to build the track segments in a low dense environment.
5. Conclusion
The Hough Transform is a simple and powerful method for finding track segments within a noisy environment. A new technique to use this method in hadronic showers is developed and successfully applied to events collected during the exposure of the CALICE SDHCAL to hadron beams. The advantages of using track segments obtained with this technique to calibrate the hadronic calorimeter in situ are shown. A slight improvement on the energy
3Only one noise hit is expected in a physics event in the SDHCAL prototype. This is to be compared
Normalised number of events 0 0.05 0.1 0.15 0.2 0.25 0.3 0.35
0.4E = 10 GeV CALICE SDHCAL
Data FTFP_BERT_HP QGSP_BERT_HP FTF_BIC
Number of reconstructed tracks
0 1 2 3 4 5 6 7 Sim/Data 0 0.5 1 1.5 2
Normalised number of events
0 0.05 0.1 0.15 0.2 0.25
E = 40 GeV CALICE SDHCAL
Data FTFP_BERT_HP QGSP_BERT_HP FTF_BIC
Number of reconstructed tracks
0 1 2 3 4 5 6 7 8 9 Sim/Data 0 0.5 1 1.5 2
Normalised number of events
0 0.02 0.04 0.06 0.08 0.1 0.12 0.14 0.16 0.18 0.2 0.22
E = 70 GeV CALICE SDHCAL
Data FTFP_BERT_HP QGSP_BERT_HP FTF_BIC
Number of reconstructed tracks
0 2 4 6 8 10 Sim/Data 0 0.5 1 1.5 2
Figure 11. Top: distribution of the number of the reconstructed track segments in hadronic shower for simulation and for data at 10, 40 and 70 GeV. Bottom: ratio of the same distribution between the simulation and data. Only statistical uncertainties are included.
# tracks (normalised to unity)
0 0.02 0.04 0.06 0.08 0.1 0.12 0.14 0.16 0.18
E = 10 GeV CALICE SDHCAL
Data FTFP_BERT_HP QGSP_BERT_HP FTF_BIC ] π I λ Track length [ 0 1 2 3 4 5 6 Sim/Data 0 0.5 1 1.5 2
# tracks (normalised to unity)
0 0.02 0.04 0.06 0.08 0.1 0.12 0.14 0.16 0.18
0.2E = 40 GeV CALICE SDHCAL
Data FTFP_BERT_HP QGSP_BERT_HP FTF_BIC ] π I λ Track length [ 0 1 2 3 4 5 6 Sim/Data 0 0.5 1 1.5 2
# tracks (normalised to unity)
0 0.02 0.04 0.06 0.08 0.1 0.12 0.14 0.16 0.18 0.2
E = 70 GeV CALICE SDHCAL
Data FTFP_BERT_HP QGSP_BERT_HP FTF_BIC ] π I λ Track length [ 0 1 2 3 4 5 6 Sim/Data 0 0.5 1 1.5 2
Figure 12. Top: distribution of the track segment length in hadronic showers for simulation and for data at 10, 40 and 70 GeV. The length is given in interaction length units. Bottom: ratio of the same distribution between the simulation and data. Only statistical uncertainties are included.
reconstruction is also obtained by giving the same weight to the hits belonging to track segments irrespective of their threshold.
The same technique are also applied to simulated hadronic showers. Comparison with data helps to better characterize the different hadronic shower models used in the simu-lation. FTF_BERT_HP model seems to be slightly closer to the SDHCAL data than the
QGSP_BERT_HPand FTF_BIC ones.
The extension of the method to hadronic showers in the presence of magnetic field should complete this work and allows the technique to be used in highly granular calorimeters in future experiments.
# tracks (normalised to unity) 0 0.02 0.04 0.06 0.08 0.1 0.12 0.14
E = 10 GeV CALICE SDHCAL
Data FTFP_BERT_HP QGSP_BERT_HP FTF_BIC ° ψ 0 10 20 30 40 50 60 70 80 90 Sim/Data 0 0.5 1 1.5 2
# tracks (normalised to unity)
0 0.02 0.04 0.06 0.08 0.1
E = 40 GeV CALICE SDHCAL
Data FTFP_BERT_HP QGSP_BERT_HP FTF_BIC ° ψ 0 10 20 30 40 50 60 70 80 90 Sim/Data 0 0.5 1 1.5 2
# tracks (normalised to unity)
0 0.01 0.02 0.03 0.04 0.05 0.06 0.07 0.08
E = 70 GeV CALICE SDHCAL
Data FTFP_BERT_HP QGSP_BERT_HP FTF_BIC ° ψ 0 10 20 30 40 50 60 70 80 90 Sim/Data 0 0.5 1 1.5 2
Figure 13. Top: distribution of the angle of the track segments in hadronic showers with respect to the incoming hadron for simulation and for data at 10, 40 and 70 GeV. Bottom: ratio of the same distribution between the simulation and data. Only statistical uncertainties are included.
> Track <N 1 2 3 4 5
SDHCAL DATA (H2 CERN SPS) FTFP_BERT_HP QGSP_BERT_HP FTF_BIC CALICE SDHCAL a) [GeV] beam E 0 10 20 30 40 50 60 70 80 data )/N Track N ∆ ( −0.1 0 0.1 b) ] π I λ <Track length> [ 1.4 1.5 1.6 1.7 1.8 1.9 2
SDHCAL DATA (H2 CERN SPS) FTFP_BERT_HP QGSP_BERT_HP FTF_BIC pi-CALICE SDHCAL a) [GeV] beam E 0 10 20 30 40 50 60 70 80 data L)/L ∆ ( 0.05 − 0 0.05 b) ° > ψ < 12 14 16 18 20 22 24 26
SDHCAL DATA (H2 CERN SPS) FTFP_BERT_HP QGSP_BERT_HP FTF_BIC CALICE SDHCAL a) [GeV] beam E 0 10 20 30 40 50 60 70 80 ψ )/ ψ ∆ ( 0.1 − 0.05 − 0 0.05 0.1 b)
Figure 14. Left: Mean number of reconstructed track segments in hadronic showers as a function of the beam energy (a) and the relative difference between simulation and data (b). Middle: Mean track segment length as a function of the beam energy (a) and the relative difference between simulation and data (b). Right: Mean angle of the track segments as a function of the beam energy (a) and the relative difference between simulation and data (b). Only statistical uncertainties are included.
6. Acknowledgements
We would like to thank the CERN-SPS staff for their availability and precious help during the beam test period. We would like to acknowledge the important support provided by the F.R.S.-FNRS, FWO (Belgium), CNRS and ANR (France), SEIDI and CPAN (Spain). This work was also supported by the Bundesministerium für Bildung und Forschung (BMBF), Germany; by the Deutsche Forschungsgemeinschaft (DFG), Germany; by the Helmholtz-Gemeinschaft (HGF), Germany; by the Alexander von Humboldt Stiftung (AvH), Ger-many; by the Korea-EU cooperation programme of National Research Foundation of
Ko-rea, Grant Agreement 2014K1A3A7A03075053 ;by the National Research Foundation of Korea.
References
[1] G. Beaulieu et al., Conception and construction of a technological prototype of a high-granularity digital hadronic calorimeter, JINST 10 (2015) P10039; e-print: arxiv:1506.05316.
[2] CALICE Collaboration Track segments in hadronic showers in a highly granular scintillator-steel hadron calorimeter, JINST 8 (2013) P09001.
[3] P.V.C. Hough, Method and means for recognizing complex patterns. United States Patents, n.3, 069, 654 (18 December 1962).
[4] R. O. Duda and P. E. Hart, Use of the Hough Transformation to Detect Lines and Curves in Pictures, Comm. ACM, Vol. 15, pp. 1115 (January, 1972).
[5] I. Laktineh, Brick finding efficiency in muonic decay tau neutrino events, LYCEN-RI–2002-07.
[6] L. Manhaes De Andrade Filho and J. Seixas Combining Hough Transform and Optimal Filtering for Efficient Cosmic Ray Detection with a Hadronic Calorimeter, XII Advanced Computing and Analysis Techniques in Physics Research, PoS(ACAT08)095.
[7] CALICE Collaboration, First results of the CALICE SDHCAL technological prototype, JINST (2016) 11 P04001, e-print:arXiv:1602.02276.
[8] J. C. Brient and H. Videau, The calorimetry at the future e+ e- linear collider in Proc. of the APS/DPF/DPB Summer Study on the Future of Particle Physics (Snowmass 2001) ed. N. Graf, Snowmass, Colorado, (30 Jun - 21 Jul 2001), pp E3047, arXiv:hep-ex/0202004. [9] V. L. Morgunov, Calorimetry design with energy-flow concept (imaging detector for
high-energy physics, Prepared for 10th International Conference on Calorimetry in High Energy Physics (CALOR 2002), Pasadena, California, (25-30 Mar 2002).
[10] M. A. Thomson, Particle Flow Calorimetry and the Pandora PFA Algorithm, Nucl. Instrum. Meth. A611 (2009) 25.
[11] A. Ribon et al, Status of GEANT4 hadronic physics for the simulation of LHC experiments at the start of LHC physics program, CERN-LCGAPP-2010-02, CERN, Geneva, (May 2010). [12] CALICE Collaboration, Resistive Plate Chamber Digitization in a Hadronic Shower
![Figure 8. a) Reconstructed energy using the standard method as presented in ref. [7] and the one using the HT track segments as a function of the beam energy](https://thumb-eu.123doks.com/thumbv2/123doknet/14075876.463021/15.892.293.589.435.850/figure-reconstructed-energy-standard-method-presented-segments-function.webp)