DEVELOPING THE BUSINESS CASE FOR QUALITY BY DESIGN IN THE BIOPHARMACEUTICAL INDUSTRY
By Julie Matthew
B.S. 2000 Chemical Engineering University of Massachusetts Amherst
Submitted to the MIT Sloan School of Management and the Department of Chemical in Partial Fulfillment of the Requirements for the Degrees of
Master of Business Administration AND
Master of Science in Chemical Engineering
L~SSACHUSE1TS INSilTUTE ASSACHUSETTS INSTITUT E OFTECHNOLOGY
JUN
10 2009
LIBRARIES
EngineeringARCHIVEs
In conjunction with the Leaders for Manufacturing Program at the Massachusetts Institute of Technology
June 2009
C 2009 Massachusetts Institute of Technology
All rights reserved ,
...-Signature of Author
Certified by
/ May 8, 2009
Chemical Engineering, MIT Sloan School of Management
Charles Cooney, hesis Supervisor Robert T. Haslam Professor of Chemical Engineering Certified by
Iy Welsch, Thesis Supervisor Professor of Statistics and Management Science, MIT Sloan School of Management Accepted by
William Deen, Chairman, Committee for Graduate Students Department Chemical Engineering Accepted by
Executive Director of MBA
Debbie Berechman Program, MIT Sloan School of Management
Developing the Business Case for Quality by Design in the Biopharmaceutical Industry by
Julie Matthew
Submitted to the MIT Sloan School of Management and the Department of Chemical Engineering on May 8, 2009 in Partial Fulfillment of the
Requirements for the Degrees of Master of Business Administration and Master of Science in Chemical Engineering
ABSTRACT
Quality by Design (QbD) is a systematic, science-based approach to pharmaceutical development that was defined in the International Conference on Harmonization (ICH) Q8 guideline in 2005. Expectations are that QbD will ultimately become a regulatory expectation and prerequisite for drug approval. The pharmaceutical industry has made significant progress in applying QbD principles for small molecules, and efforts to adapt the new paradigm to biologic products are gaining momentum. Although the primary motivation for adopting QbD is regulatory expectation, the business impact of QbD has not yet been defined. The purpose of the business case is to examine the internal impact of QbD using Amgen, Inc. as a model large biopharmaceutical company. This assessment aims to identify the most critical areas of focus and to align expectations around the impact of QbD. The business case captures the impact of QbD throughout the commercialization process, from drug discovery to commercial production, by applying a conceptual framework that divides the commercialization process into four major elements: Molecule Selection, Process Development, Technology Transfer, and Marketing Application & Commercial Production. Examples of on-going activities were identified within each of these elements to estimate the economic and operational impact of QbD. One of these examples was based on a deep-dive technical analysis of Smart Freeze Dryer technology, a novel means of lyophilization cycle development and temperature control. The business case demonstrated that internal drivers do exist for the systematic implementation of
QbD. Up-front investment early in the product life cycle offers economic and operational benefits later in development and commercial production. In addition, organizational learning and process development evolution lead to cumulative benefits for subsequent pipeline products. Though the magnitude and timing of investment depends on the available resources and long-term strategy of the business, investment should be concentrated in three key areas: Science & Technology, Knowledge Management Systems, and Business Processes.
Thesis Supervisor: Charles Cooney
Title: Robert T. Haslam Professor of Chemical Engineering Thesis Supervisor: Roy Welsch
Title: Professor of Statistics and Management Science 3
TABLE OF CONTENTS A bstract ... .. 3 Table of Contents .... ... ... ... ... ... 5 List of Figures... ... ... ... ... 7 List of Tables ... .. .. ... 8 Acknowledgments... ... ... 9 G lossary... ... ... 10 1 Introduction ... ... 11 1.1 Project Drivers ... ... 11
1.2 Problem Statem ent... ... ... ... 12
1.3 Thesis Overview ... 12 2 B ackground ... ... .... . ... ... 13 2.1 Biopharmaceutical Industry ... 13 2.2 Amgen, Inc... ... 16 2.3 Quality by Design (QbD) ... 17 2.3.1 QbD Prior to 2002 ... 17
2.3.2 QbD following the 21st Century Quality Initiative ... 19
2.3.3 Recent Progress in QbD for Biopharmaceuticals... .. ... 22
3 Hypothesis ... 25
4 Methodology... ... 26
4.1 Data Collection and Analysis... ... 26
4.2 Conceptual Framework ... 26
5 The Impact of QbD in the Biopharmaceutical Lifecycle... 29
5.1 Molecule Selection... ... 29
5.1.1 Applying QbD to Molecule Selection ... ... 29
5.1.2 Example: Monoclonal Antibody (mAb) Platform ... 30
5.2 Process Development & Characterization... 30
5.2.1 Applying QbD to Process Development & Characterization ... 31
5.2.2 Example: Smart Freeze Dryer TM (SFD) Technology (Deep Dive #1)... 32
5.3 Technology Transfer... ... ... .. 51
5.3.1 Applying QbD to Technology Transfer... ... 51
5.3.2 Example: Lyophilization Scale-Down Gap Assessment (Deep Dive #2) ... 53
5.4 Marketing Application & Commercial Production ... 58
5.4.1 Applying QbD to Marketing Application & Commercial Production ... 58
5.4.2 Example: Multivariate Statistical Process Monitoring... 59
5.4.3 Additional Benefits from QbD ... ... 62
5.5 Alignment and Knowledge M anagement ... 69
6 Recommended Areas of Investment for QbD... 71
6.1 Science & Technology ... 71
6.2 Systems... ... 71
6.3 Business Processes ... 72
7.1 Overview of the Business Case ... ... 73
7.2 Internal Challenges for QbD Implementation... ... 74
7.3 Sum m ary ... .. ... ... 75
Bibliography... 76
LIST OF FIGURES
Number Page
Figure 1: Relative Product and Process Complexity of Biologics ... 15
Figure 2: Biopharmaceutical Development Process ... ... 16
Figure 3: Evolution of Quality Control... ... 18
Figure 4: FDA Perspective of Quality by Design ... ... 21
Figure 5: Strategic Framework for the Business Case... ... 26
Figure 6: Phase Change Diagram for Lyophilization ... ... 33
Figure 7: Hypothetical Lyophilization Cycle ... ... 34
Figure 8: Lyophilizer Configuration ... 35
Figure 9: Vial Heat and Mass Transfer During Lyophilization ... 37
Figure 10: Sample Pressure-Rise Data during MTM... ... 41
Figure 11: Edge Effects on a Lyophilizer Shelf... 42
Figure 12: Lyophilization Cycle Data for SFD Run #2... 46
Figure 13: Lyophilization Cycle Data for SFD Run #4... ... 48
Figure 14: Impact of MSPM on a Manufacturing Process ... ... 61
Figure 15: Non-Conformance Analysis ... 64
Figure 16: Post-Marketing Regulatory Submission Analysis ... .... 67
Figure 17: Alignment in Quality by Design ... 69
Figure 18: Knowledge Base Concept for Knowledge Management ... 70
Figure 19: Elements of Quality by Design Investment Strategy... ... 71
LIST OF TABLES
Number Page
Table 1: Benefits of the Monoclonal Antibody Platform ... ... 30
Table 2: Set of Five Lyophilization Cycles Used to Test SFD Performance... 44
Table 3: Verification of MTM measurements for SFD Run #2... .47
Table 4: Verification of MTM measurements for SFD Run #4... 49
Table 5: Overview of Data Collected during Technology Transfer Gap Analysis ... 54
Table 6: Data Categories for Gap Analysis... 55
Table 7: Benefits of MSPM in Manufacturing ... . ... 60
ACKNOWLEDGMENTS
The author wishes to acknowledge the Leaders for Manufacturing (LFM) program at MIT, herpeers in the LFM class of 2009, and her advisors Roy Welsch and Charles Cooney for their support of this work.
The author would also like to express her sincere gratitude to Deborah Wong, whose guidance provided an unparalleled opportunity to learn and whose energy and eforts guaranteed an extremey successful internshzp. The author would also like to thank Cathryn Shaw-Reid, FerozJameel, Ed Walls, Erwin Freund, Joe Halcomb, and
Bob Maroney for their mentorship and support of this work. For their time and theirpatience in helping her to assemble the business case, she also wishes to thank Chakradhar Padala, Christian Ruitberg, Wei Liu, Cenk
Undey, Joseph Phillips, Karen Parker, and Ricardo Diaz.
Finally, and most importantly, the author is extremey grateful to herparentsfor their wisdom, support, understanding, and encouragement through the years.
GLOSSARY
Bioactivity: A measure of the effect of a drug on living materials or systems.
Biologic License Application (BLA): Application to obtain marketing approval from the U.S. FDA for a new biologic drug.
Cake: The solid product structure remaining after the lyophilization ("freeze drying") process Chemistry, Manufacturing, and Controls (CMC): The portion of a drug marketing application describing the nature of the drug, how it is made, and how quality is guaranteed (non-clinical information).
Common Technical Document (CTD): Standardized set of specifications for applications for marketing approval of a new drug in the U.S., E.U., and Japan. The CTD includes Chemistry, Manufacturing, and Controls (CMC) information as well as clinical data.
Comparability: Verification of consistency in the product. This is critical in the biotechnology industry, where the product is complex and often nearly impossible to characterize completely, but it is imperative that the material made for clinical trials be comparable to the material made for
commercial use (approval of the commercial product is based on clinical trial results).
Critical Quality Attribute (CQA): "A physical, chemical, biological, or microbiological property or characteristic that should be within an appropriate limit, range, or distribution to ensure the desired product quality." (ICH Q8 (R1), 2008)
Design Space: "The multidimensional combination and interaction of input variables (e.g., material attributes) and process parameters that have been demonstrated to provide assurance of quality."
(ICH Q8 (R1), 2008)
Excipient: An inactive substance used as a carrier for the active ingredients in a pharmaceutical or biopharmaceutical product.
Modality: The form of a pharmaceutical product. For instance, small molecules, therapeutic proteins, and monoclonal antibodies are all common modalities.
New Drug Application (NDA): Application to obtain marketing approval from the U.S. FDA for a new drug (not a biologic).
Product Pipeline: The collection of a company's products at all stages in the product lifecycle, from discovery and pre-clinical to commercial.
Quality Target Product Profile (QTPP): "A prospective summary of the quality characteristics of a drug product that ideally will be achieved to ensure the desired quality, taking into account safety and efficacy of the drug product." (ICH Q8 (R1), 2008) In the text that follows, the QTPP is referred to more simply as the Target Product Profile (TPP).
Titer: A measure of concentration; in the text, refers to concentration of the product of interest in cell culture during biologics manufacturing.
1 Introduction
1.1 Project DriversInnovators in the pharmaceutical and biotechnology industry are taking on a series of new challenges in recent years as their business environment continues to evolve. Among the most pressing issues are drying-up product pipelines, a shift towards personalized medicine (in contrast with the traditional blockbuster model), changing regulatory policy, and the emergence of generics and biosimilars (which have the potential to rapidly and drastically reduce an innovator's market share). The industry has taken a number of steps to address these challenges; among them is focusing increasing attention on the development process with the goal of bringing more high-quality drugs to market faster. Quality by Design is one of several tools with the potential to help streamline development activities while building in product quality.
Quality by Design (QbD) is a new approach to pharmaceutical development defined in 2005 by the International Conference on Harmonization (ICH), a joint initiative involving both industry and regulators in the US, the EU, and Japan. QbD represents a paradigm shift in development, applying more systematic and streamlined methodologies with a focus on end-product quality. Under QbD, pre-determined product specifications define the drug manufacturing process - the process no longer defines the product. Additionally, thorough process understanding and control minimize product variability so that quality is proactive rather than reactive (i.e., no more "quality by inspection").
The pharmaceutical industry has already begun to embrace QbD, which was originally developed with a small molecule focus. However, due to greater product and process complexity, the
biopharmaceutical industry is still working closely with regulatory agencies such as the United States Food and Drug Administration (FDA) and the European Medicines Agency (EMEA) to determine what QbD should look like for biotechnology products. While much of the current discussion
focuses on shaping future regulatory requirements, a key to successful implementation of QbD is determining whether it is a sound investment from an internal enterprise perspective and identifying how it will impact an innovator's business.
1.2 Problem Statement
Pharmaceutical and biotechnology companies are currently approaching QbD under the assumption that it will ultimately become a regulatory expectation. Since a company's success at applying QbD
could then impact whether or not their products will be approved, regulatory compliance is a major driver for implementation. However, the economic and operational impact of QbD in a
biopharmaceutical enterprise is not yet clear. The purpose of the business case is to examine the internal impact of QbD using Amgen, Inc. as a model large biopharmaceutical company. The magnitude of investment in QbD depends primarily on resource availability and the company's long-term business strategy. However, this assessment should serve to identify the most critical areas of focus and to align expectations around the impact of QbD.
1.3 Thesis Overview
The document is organized as described below:
Chapter 1 outlines the general motivation for the thesis and provides an overview of the thesis contents.
Chapter 2 provides a brief discussion of the industry and company background, as well as a description of the evolution of QbD in the pharmaceutical industry and the progress of QbD
adoption to date.
Chapter 3 presents the hypothesis for the study undertaken.
Chapter 4 describes the general approach to data collection as well as the conceptual framework applied in the development of the business case.
Chapter 5 details the impact of QbD in each of the four major areas of the drug commercialization process: Molecule Selection, Process Development, Technology Transfer, and Marketing
Application & Commercial Production. In each section, an overview of the potential applications for QbD is presented, followed by an in-depth example.
Chapter 6 provides recommendations from the business case, including three suggested areas of investment.
2 Background
2.1 Biopharmaceutical Industry
Though there is still some debate over the meaning of the term "biopharmaceutical", the
biopharmaceutical industry is generally considered to be a subset of the pharmaceutical industry where products are therapeutic agents derived from biotechnology.' This is in contrast with
traditional pharmaceuticals ("small molecules"), which are typically produced through chemical synthesis. Biopharmaceutical products ("large molecules" or biotech products) include living cells, sugars, proteins, and nucleic acids such as DNA and RNA, and they are used to treat a wide variety of illnesses from cancer to rheumatoid arthritis.2
The biopharmaceutical industry has experienced considerable growth since the first non-vaccine biologic product was approved in 1982. In 2007 there were more than 150 biopharmaceuticals on the market in the United States, with more than 600 in development for more than 100 different diseases.3 The global market for biopharmaceuticals in 2007 was $64.5 billion, with approximately 75% of the market in North America. Analysts predict that biotech products will drive growth in the pharmaceutical industry with a compound annual growth rate (CAGR) of approximately 11.6% through 2014.4
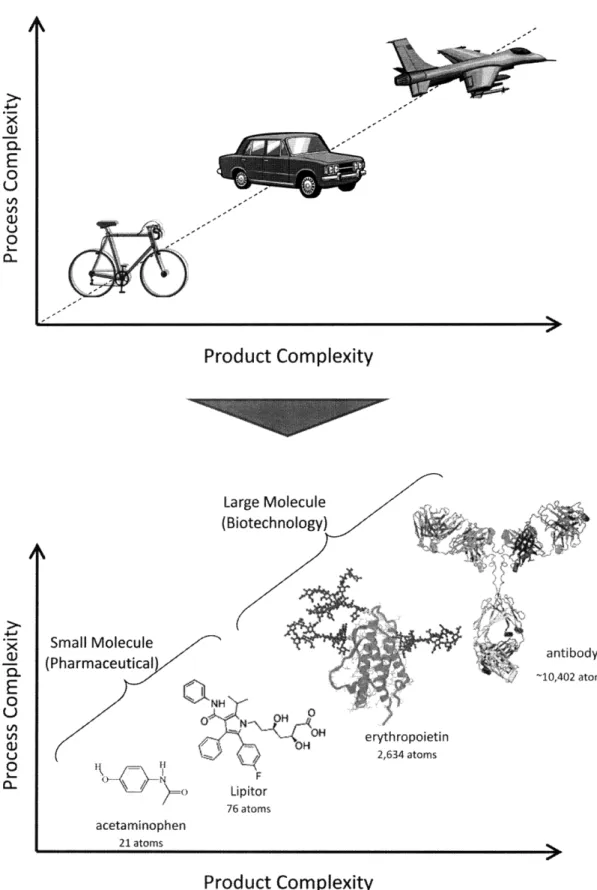
Biopharmaceuticals and traditional pharmaceuticals can be differentiated on the basis of product complexity. Whereas small molecules are often 100 atoms or less, large molecules can be two to three orders of magnitude larger with many subunits. The relative complexity of the two types of drugs is shown in Figure 1: where a small molecule would be analogous to a bicycle, a large molecule would be analogous to a jet aircraft. A similar comparison can be made for manufacturing
processes. Chemical synthesis of small molecules involves combining fixed quantities of reagents through a highly standardized process to yield a compound readily identifiable with available analytical techniques. In contrast, large molecules are typically derived from recombinant technologies and produced through live cell culture. Each cell acts like a miniature factory, and
I (Rader, 2008)
2 (Frost & Sullivan, 2008) 3 (Frost & Sullivan, 2008)
although synthesis is generally quite robust, certain variations within the cell or in the cell's
microenvironment have the potential to affect any of the molecule's hundreds of subunits. Further complicating manufacturing control, biopharmaceuticals often defy traditional analytical approaches due to their inherent intricacy.5 Hence, product and process complexity present a considerable
challenge in the biopharmaceutical industry.
4a
E
O 0 U () OProduct Complexity
Large Molecule (Biotechnology) Small Molecule (Pharmaceutical II r=-\ f 0 N~~ OH F Lipitor 76 atoms erythropoietin 2,634 atoms acetaminophen 21 atomsProduct Complexity
Figure 1: Relative product and process complexity for small and large molecules .R x Gi
-a
E
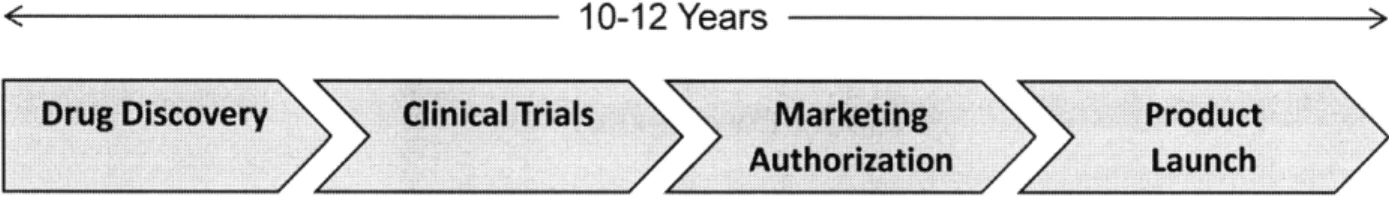
0 U Sl ci) a-antibody -10,402 atomsThe biopharmaceutical industry, like the rest of the pharmaceutical industry, manages a long, complex development process from drug discovery to product launch (Figure 2). The process can take ten or more years, and estimates place the cost of bringing a new drug to market between $800 million and $1.7 billion per successful drug.' Though much of the time and cost is consumed with the execution of clinical trials, considerable effort is expended in developing and characterizing both the product and the manufacturing process. Such development and characterization work is a primary focus in the business case for Quality by Design.
< .10-12 Years >
Drug Discovery
Clinical Trials
Marketing
Authorization
Figure 2: Biopharmaceutical development process, from launch.
Product >Z Launch discovery to product
2.2 Amgen, Inc.
Amgen, Inc. is a leader in the biopharmaceutical industry with more than 25 years of experience applying a science-based approach to drug development. After it was founded in 1980, Amgen pioneered the use of recombinant DNA and molecular biology to develop biologically derived
therapeutic products. In the 1990's, the company introduced the biopharmaceutical industry's first blockbusters, EPOGEN® (Epoetin alfa) and NEUPOGEN® (Filgrastim), which have since
improved the lives of hundreds of thousands of patients. The company currently has eight products on the market that provide supportive cancer care and treat a variety of conditions from anemia to rheumatoid arthritis and other autoimmune diseases. 7
Although most of the company's products are biologics, its approach to drug discovery is largely modality independent. That is, any of several modalities, large molecules (large molecule proteins or antibodies) or small molecules, may be pursued during drug discovery depending on which modality
6 (Landers, 2003), (Miller, 2009)
most effectively impacts the disease target.8 In this respect, Amgen's development activities support its mission to serve patients - they have expertise with a broad range of tools to find the best
possible treatments.
Amgen is headquartered in Thousand Oaks, CA and has approximately 17,000 staff worldwide. In 2008, product sales were $14.7 billion, and the company invested $2.9 billion in research and
development. Amgen has facilities around the world and operates manufacturing sites in California, Colorado, Rhode Island, Washington, and Puerto Rico.' As a leader in the biopharmaceutical industry with a proven development track record - specifically, seven biologics currently on the market and a full product pipeline - Amgen can offer valuable insight in the development of the QbD business case.
2.3 Quality by Design (QbD)
2.3.1 QbD Prior to 2002
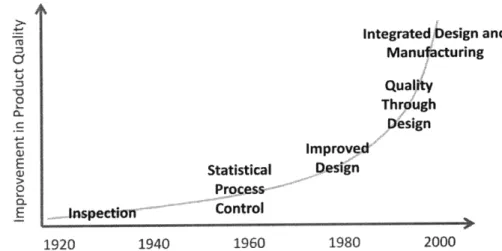
Quality by Design is not a new concept in manufacturing industries; rather, it has been an important part of the evolution of quality control since late in the 20th century (Figure 3). The concept of "quality through robust design" or "quality engineering" was introduced to the United States by Dr. Genichi Taguchi in the early 1980s and adopted as the Taguchi Method.'o In 1992 another expert in quality and quality management, J.M. Juran, described "planning for quality" as "the activity of (a) establishing quality goals and (b) developing the products and processes required to meet those goals." " Juran explained that product features and failure rates are largely determined during development stages, and emphasized the importance of understanding the costs of poor quality.
8 (About Amgen - Fact Sheet, 2009)
9 (About Amgen - Fact Sheet, 2009)
1o (Noori, 1989)
Integrated Design and Manufacturing Quality Through C Design improved, Statistical Design o Process . E Inspection- Control 1920 1940 1960 1980 2000
Figure 3: Evolution of quality control in manufacturing industries (adapted from Karbhari, 1994)
Quality by Design began in the automotive industry and spread to other industries, including at least one branch of healthcare. The medical devices industry began applying QbD principles to its development processes in the mid-1990s, building on ISO 9000 standards and the FDA's Quality System Regulations (21 CFR 820). In a 1997 paper, Lasky et al. outlined a procedure for QbD in devices: the process begins with product (device) attribute definition, which is then followed by risk analysis, verification and validation of product attributes and correct product function, and finally conformance monitoring and complaint tracking.12
Product quality is of the utmost importance for pharmaceuticals, and advanced quality systems are in place to guarantee product safety and efficacy. However, the industry has lagged behind these others in the adoption of QbD principles through development. One reason may have been that long and complex development timelines make it much more difficult to gain perspective of the entire process from early discovery (the product design phase) through commercial manufacturing. Another reason may have been technological hurdles. Whereas it is possible to touch and observe the components of an automobile or even a medical device, it is far more difficult to design and
characterize a product on the molecular scale. Analytical methods are still evolving to measure biopharmaceutical product attributes, and the relationship between product attributes and manufacturing process parameters or clinical performance is complex.
Ultimately, the delay in QbD adoption in pharmaceuticals was most likely because of the difficulty of changing existing, effective quality processes in such a highly regulated environment; the response from regulators was uncertain, making significant changes risky. Quality in the pharmaceutical industry has traditionally been controlled adequately through prescriptive and inspection-based systems. As technology and the regulatory environment have evolved, however, the need for and feasibility of an approach such as that described by Taguchi and Duran have become much more apparent.
2.3.2 QbD following the 21st Century Quality Initiative
In 2002, the FDA announced a new initiative, "Pharmaceutical CGMP Initiative for the 21s" Century - a Risk Based Approach". The purpose of the initiative was to promote the adoption of advanced technology, facilitate the application of quality management techniques, encourage a risk-based approach, and ensure that regulatory guidelines and review processes were science-based and aligned through quality systems.'3 Recently re-named "Pharmaceutical Quality for the 21st Century - A Risked Based Approach", the initiative marked the agency's acknowledgement that although pharmaceutical manufacturing and quality are adequate, the industry is generally less efficient and innovative and has higher costs than other high-tech industries.14
Since the launch of the Pharmaceutical Quality for the 21"s Century initiative, the FDA has initiated several additional quality programs to support its goals. Specific to encouraging new manufacturing technologies, the agency issued a process analytical technology (PAT) guidance in 2003 (finalized in 2004). PAT, as defined in the guidance, is
... a system for designing, analyzing, and controlling manufacturing through timely measurements (i.e., during processing) of critical quality and performance attributes of raw and in-process materials and processes, with the goal of ensuring final product quality. "5
In the broadest sense, PAT involves applying "chemical, physical, microbiological, mathematical, and risk analysis" to improve process understanding and facilitate innovation and risk-based
13 (FDA Pharmaceutical Quality for the 21st Century - Progress Report, 2007) 14 (Van Arnum, 2007)
decision-making.16 Practically speaking, PAT can include anything from a physical in-line process
sensor to the advanced statistical techniques described in section 5.4.2. While the technological tools themselves are important, PAT fundamentally means applying the tools appropriately to better understand the process.
In addition to issuing the PAT guidance, the FDA has also participated in the International Conference on Harmonization (ICH). ICH is an international collaboration between industry and regulators whose mission is to develop guidelines that ensure drug regulatory processes are efficient and uniform across the three major regulatory regions, U.S., E.U., and Japan." Among the
guidelines developed by the group is ICH Q8 (Pharmaceutical Development), which was finalized in November 2005 and most recently revised in November 2008. The Annex (Part II) to ICH Q8 defines Quality by Design for the pharmaceutical industry:
Quality by Design (QbD) [is] a systematic approach to development that begins with predefined objectives and emphasizes product and process understanding and process control, based on sound science and quality risk management.
The pharmaceutical development process prescribed by QbD (that is, by ICH Q8) begins with definition of the target product profile (TPP), which forms the basis of design and includes elements
such as route of administration, therapeutic agent release or delivery approach, and drug product quality criteria.'" Next, critical quality attributes (CQAs) are identified; these are properties or
characteristics of the drug that must be controlled within a certain range to ensure the desired product quality. Manufacturing process selection follows; process development includes identifying
critical process parameters (CPPs), those process parameters that have an impact on CQAs. The final step is to develop an appropriate control strategy with guidance from a thorough risk
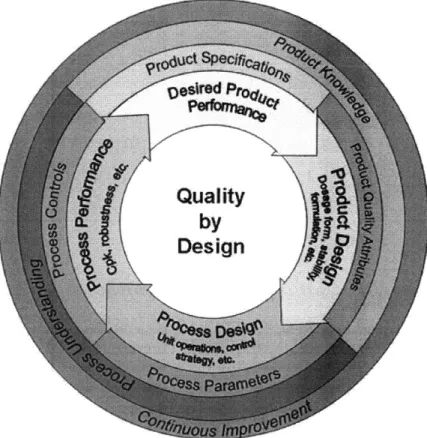
assessment, which evaluates the relationships between CPPs and CQAs, among other criteria. The FDA's view of QbD is shown in Figure 4 below.
16 (FDA PAT Guidance for Industry, 2004)
'7 (About ICH, 2009)
18 (ICH Q8 (R1), 2008)
Figure 4: FDA perspective of Quality by Design, from the FDA's Pharmaceutical Quality for the 21st Century progress report, 2007.
Another important concept introduced in ICH Q8 is that of design space, "[t]he multidimensional combination and interaction of input variables (e.g., material attributes) and process parameters that have been demonstrated to provide assurance of quality." 20 Design of experiments plays an
important role during process development as the relationships between CPPs and CQAs are evaluated to create design space. Once design space is approved by the FDA, a manufacturer would have the freedom to adjust operating conditions anywhere within that space without requiring regulatory approval. The concept of design space has the potential to afford a manufacturer considerably greater process flexibility.
It is valuable to note that ICH Q8 defines QbD from a traditional, small molecule perspective. While many of the concepts can be applied to large molecule development, the added product and process complexity render much of the guideline insufficient or impractical. The FDA is currently
working with industry representatives to develop guidelines that are more applicable to biopharmaceuticals.
Quality by Design is a systematic approach to pharmaceutical development that can incorporate prior knowledge, design of experiments, quality risk management, and knowledge management.
(The latter two concepts are the subject of the ICH Q9 and Q10 guidelines, respectively.)
Additionally, PAT is one of many tools that facilitate the implementation of QbD.21 At a high level, QbD is intended to help innovators demonstrate process understanding and build-in product quality while providing the necessary flexibility and support for innovation and improved efficiency.
2.3.3 Recent Progress in QbD for Biopharmaceuticals
The pharmaceutical industry and the FDA have made considerable progress in applying QbD since it was first defined in 2005. Given the relative simplicity of the product, the focus of the guidelines, and the availability of small-molecule technologies adapted from the fine chemical industry,
adoption has been more rapid for traditional pharmaceuticals. However, the efforts of
biopharmaceutical firms and regulators around QbD for biotech products are gaining momentum. In 2005 the FDA launched a QbD pilot program for small molecules through its newly created Office of New Drug Quality Assessment (ONDQA). The pilot program provided innovators with an opportunity to submit for agency review NDAs or supplements incorporating key elements of QbD. The goal of the program was to allow the FDA to work closely with industry so that both could gain insight into how QbD can be applied in practice. As of May 2008, the ONDQA had approved six pilot applications, with several more awaiting review.22
The FDA launched a similar pilot program for biotech products in July 2008. The program is managed by the FDA's Office of Biotechnology Products (OBP), and is open to new submissions until September 2009.23 Building on the successes of the program launched in 2005, this program is intended to encourage biopharmaceutical manufacturers to improve product and process
understanding and control. Through the pilot the FDA hopes to delineate an approach to implementing QbD that will provide further guidance for industry. The agency's commitment to
21 (Nasr, 2008) 22 (Wechsler, 2008)
23 (Office of Biotechnology Products - Notice of Pilot Program, 2008)
helping innovators improve their product & process development processes is consistent with the goals of their 21st century quality initiative.
Separate from the FDA's pilot programs, industry groups have also been working towards
biotechnology-specific guidelines for QbD. Most notably, Conformia, a product/process lifecycle management (PPLM) solutions firm, formed a QbD working group for biotech products in 2008. The group is comprised of seven industry leaders: Amgen, Genentech, Abbott, MedImmune (Astra Zeneca), Glaxo Smith Kline, Eli Lilly, and Pfizer.24 Building on a similar project for small molecules initiated in July 2007 (the "ACE Tablet" case study), the group will develop a case study based on a fictitious biological molecule (specifically, a monoclonal antibody) to outline potential interpretations of the ICH guidelines and to illustrate a science- and risk-based development approach. The results of the case study are expected in spring 2009.25
While industry and regulators have made progress in applying QbD principles to biopharmaceutical development and manufacturing, significant barriers remain. One of the greatest barriers is the perceived regulatory risk. Submitting a marketing application that incorporates QbD principles when the standard for such a regulatory filing is not yet established increases the risk of getting a negative reaction from regulators. In the early stages of biotech QbD when regulatory expectations are still not entirely clear, companies need to work closely with the FDA to ensure that a new
approach to development or a new technology is acceptable. A related concern is that providing too much information to regulators might increase the likelihood of a negative response. 26 From a market perspective, disclosing full product knowledge and process understanding could also increase the threat of biosimilar competition in the future.
Another hurdle to implementation is organizational momentum. QbD represents a fundamental change in the way that people think about pharmaceutical development. Implementing the new paradigm requires changing processes that have successfully churned out blockbusters in the past. Hence, innovator companies wishing to apply QbD must carefully re-design the business processes and incentive systems within their organizations to align with the principles of systematic and science-based development.
24 (Conformia, 2008)
25 (Conformia, 2008)
One final hurdle to implementation is cost. QbD requires a considerable up-front investment in technology and business process re-design. Although theory suggests that the up-front investment is repaid as a lower cost of quality, the business case has not yet been clearly communicated across
the biopharmaceutical industry.
As a leader in the biopharmaceutical industry, Amgen continues to work with regulators and its peers to interpret and apply the ICH guidelines for biotech products. In addition, the company had already achieved great success using QbD principals internally in various applications across the organization. However, one of the biggest challenges facing the company (and its peers) specific to
QbD is deciding how best to align on-going activities, determine the appropriate level of investment, and define a path forward. The business case is intended to inform these decisions by highlighting the impact of QbD across the entire development process. A successful approach to QbD
implementation could enable greater flexibility, innovation, and efficiency, thereby strengthening Amgen's leadership position in the industry.
3 Hypothesis
Quality by Design has both external and internal drivers. While the primary driver, regulatory expectation, is external, QbD can have considerable benefits to Amgen's internal operations.
Up-front investment in QbD throughout commercialization, particularly early in the product lifecycle, can positively impact a biotechnology company's business in at least four different areas:
* Operational cycle times, including time to market and production cycle times * Extent of regulatory compliance and status of quality management systems * Ability to meet demand while reducing scrap and inventory
4 Methodology
4.1 Data Collection and Analysis
All interviews, data collection, and analyses were performed at Amgen, Inc., primarily at the Thousand Oaks, CA site.
Quality by Design is a lifecycle approach to product and process development. Consequently, when developing the business case it was important to consider the lifecycle as broadly as possible.
Interviews of over 40 subject matter experts (SMEs) within several functions at Amgen, including Research & Development, Process Development, Quality, Regulatory, Finance, Supply Chain and Manufacturing, were integral to the business case.
Given the enterprise-wide scope of the project, analyses could not practically be exhaustive and are instead example-based. Representative examples within Amgen were identified and data were analyzed with assistance from SMEs. The business case also includes two deep-dive analyses based on hands-on work done in the Drug Product and Device Development (DP&DD) function in Process Development. DP&DD is responsible for the Fill/Finish and packaging portions of the process. Fill/Finish includes filling active drug substance into vials, syringes, or other delivery devices, lyophilizing (freeze drying) the product when necessary, and inspecting final product for delivery to patients. These deep-dives were intended as a technical proof-of-concept for one unit
operation: lyophilization (freeze drying).
4.2 Conceptual Framework
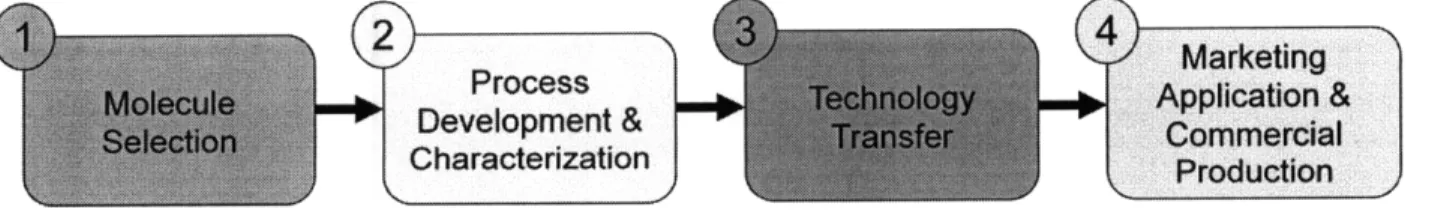
To ensure a holistic approach to the business case, a framework was developed to capture the key elements of the biopharmaceutical lifecycle. Commercialization, the process by which a product is identified, developed, and brought to market, was divided into four major elements:
Figure 5: Strategic framework for then business case
1. Molecule Selection: During this phase of commercialization, a small group of product candidates identified during early development is screened to identify the one molecule that will move on to the next phase of commercialization. Each of the candidates is screened for bioactivity, stability, and manufacturability, among other criteria. This phase also includes cell line selection.
2. Process Development & Characterization: During this phase of commercialization, a process is defined for the production of the selected molecule. Once the process has been defined, additional studies are performed to identify critical interactions, set operating conditions, and challenge the process. Analytical methods for product characterization are refined, and a process control strategy is identified. Considerable process knowledge is generated during this phase.
3. Technology Transfer: During commercialization, product is made for many different reasons: some is made only for development purposes, some is intended for use in clinical trials (small scale production), and the majority is intended for sale as commercial product
(large scale production). The Technology Transfer phase of commercialization encompasses transfer of the production process either between scales (e.g., from the development or pilot scale to the commercial scale) or between sites (e.g., from one commercial site to another). The primary concern during technology transfer is that the process and product remain comparable across sites and scales. For instance, product manufactured at the commercial scale must be highly similar to product manufactured at the clinical scale in order for the manufacturer to rely on data obtained during clinical development for marketing
authorization.
4. Marketing Application & Commercial Production: This phase consists of two major
elements: the production of commercial product and the creation of the Common Technical Document (CTD), which forms the basis of the Biological License Application (BLA) or Marketing Application (MA) to be filed with the FDA for approval. The CTD contains clinical trial data and demonstrates in-depth knowledge of the product and production process. FDA approval of the marketing application and a pre-approval facility inspection
are required before a company can launch a commercial product. Commercial production may begin prior to approval of the BLA, however the material may not be released into the market until approval is obtained.
The impact of QbD in the biopharmaceutical lifecycle is described in the next section in the context of the framework outlined above. Opportunities to apply QbD principles, the anticipated outcome, and an example of the impact of QbD at Amgen are detailed for each element of commercialization. Final results for each element are related to the impact to the business in four major areas:
5 The Impact of QbD in the Biopharmaceutical Lifecycle
5.1 Molecule Selection
A product is first defined during Molecule Selection. This is the ideal starting point for Quality by Design, with the creation of a target product profile (TPP) and identification of critical quality attributes (CQAs).
5.1.1 Applying QbD to Molecule Selection
Quality by Design can enhance and increase the efficiency of Molecule Selection through the application of innovative screening methods and analytical tools. For instance, high throughput tools such as Seahorse Bioscience's SimCellTM system allow more rapid and thorough screening than was previously attainable. SimCellTM is a micro bioreactor array that simulates a scale-down
bioreactor with 1ml culture volumes. The technology has a variety of applications for both Molecule Selection and Process Development, including clone selection and culture media optimization in early process development.2 7
QbD can also help by providing the impetus to harness the organization's collective product and process knowledge. For instance, a modality-specific knowledge bank can be created to facilitate organizational learning and leverage work done with prior molecules. Such a knowledge
management system can incorporate learnings from later-stage development and commercial production; this information can be used to select the molecule with the best possible
manufacturability. The concept of knowledge management is discussed in greater detail in section 5.5.
The ultimate benefit of QbD in Molecule Selection is the identification of molecules with the optimal balance of bioactivity, stability, and manufacturability. In addition, a solid knowledge management system leverages information across the product pipeline. The end result is acceleration of products through commercialization and a reduction in attrition (when pipeline products fail to make it to market).
5.1.2 Example: Monoclonal Antibody (mAb) Platform
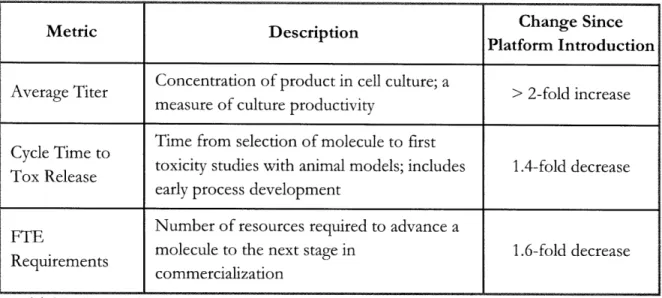
A monoclonal antibody (mAb) platform was implemented at Amgen six years ago and has since undergone a number of revisions. The platform is a library of knowledge specific to the mAb modality; it is a means of capturing and applying molecule and process knowledge gained during the development of previous mAb product candidates. Molecule characteristics such as bioactivity, stability, and manufacturability can all be optimized during selection of a new product candidate based on the successes and failures of prior mAbs. The platform can also provide preliminary production process conditions for the new molecule with typically only minor revisions required during process development. Table 1 shows the operational impact of the platform since its introduction. The operational metric most impacted by the platform is Speed, specifically speed to market, since these early activities typically lie on the critical path to product launch.
Metric Description Change Since
Platform Introduction
Concentration of product in cell culture; a
Average Titer > 2-fold increase
measure of culture productivity
Time from selection of molecule to first Cycle Time to
Tox Release toxicity studies with animal models; includes 1.4-fold decrease early process development
FTE Number of resources required to advance a
molecule to the next stage in 1.6-fold decrease commercialization
Table 1: Benefits of the monoclonal antibody (mAb) platform
Amgen has already seen considerable operational benefits as a result of the platform, which will continue to evolve over time as it captures organizational learning. The mAb platform is an example of applying knowledge management, a backbone of QbD, in Molecule Selection. QbD at this point in commercialization can positively impact the business primarily by reducing cycle times.
5.2 Process Development & Characterization
The majority of process knowledge is built during Process Development & Characterization. It is during this phase when relationships between a product's critical quality attributes (CQAs) and the
critical process parameters (CPPs) will ideally be mapped and understood, defining the design space. Consequently, the majority of the investment in QbD will be focused here. It is important to note that building process understanding can be extremely costly (financially and in terms of time to market); it is critical to balance the cost of development with the value of the knowledge obtained. 5.2.1 Applying QbD to Process Development & Characterization
QbD principles encourage the use of statistical tools such as Design of Experiments (DOE) along with Process Analytical Technologies (PAT) and high throughput development tools to verify relationships between CPPs and CQAs, identify optimal process conditions and process boundaries, and make process development more efficient. Process characterization using statistical tools allows for the identification of those parameters and interactions which can impact product quality. Critical parameters for a cell culture unit operation, for instance, may include raw material characteristics, pH, and temperature.
Risk analysis techniques may also be applied during Process Development & Characterization to identify the most critical process parameters and prioritize development work. An initial risk assessment may be on prior knowledge or experimental data (e.g., from design of experiments or mechanistic models); ICH guidelines recommend repeating the risk assessment throughout the development process.28 Quality Risk Management is described in great detail in the ICH Q9 guideline.
The benefits of applying QbD to Process Development & Characterization are considerable. First among them is a clear definition of process boundaries. With the tools described above, the range of process inputs that yield good quality product can be defined, creating the multi-dimensional design space. When presented clearly in the CTD, a well-defined design space demonstrates a thorough process understanding, which increases regulatory confidence and the likelihood of product approval. In addition, design space can allow for greater commercial process flexibility, as described in section 5.4.
The benefits of establishing clear process boundaries can be extended to earlier-stage pipeline products through organizational learning. Once design space is established for one product, the
amount of development work required to create design space for a similar, subsequent product can be significantly reduced. However, as with the mAb Platform example in section 5.1.2, the
usefulness of the information depends on how carefully the knowledge is captured and applied. The concept of knowledge management is discussed further in section 5.5.
An additional benefit of QbD is that optimal process conditions can be identified sooner and more efficiently: more knowledge is available prior to commercial launch. The primary result is improved commercial process performance (e.g., yield & cycle times), but earlier optimization may also lead to greater product consistency between scales and therefore simplified comparability.
While Amgen has long used DOE during process development, application of this and other statistical tools is increasing rapidly. Amgen has also begun to use several PAT tools for
development purposes. The next section describes one of these tools, SMART Freeze-Dryer TM (SFD) technology, in detail.
5.2.2 Example: Smart Freeze Dryer TM (SFD) Technology (Deep Dive #1) The purpose of this deep-dive project is to evaluate SMART Freeze Dryer TM (SFD) technology as a
PAT tool for lyophilization cycle development and for more accurate measurement and control of product temperature, a critical process parameter. This section begins with background information
for lyophilization, SFD technology, and manometric temperature measurement (MTM) and then describes the experimental plans, results, and key findings from this project.
5.2.2.1 Lyophilization Overview
Lyophilization, or freeze drying, is a common unit operation in the production of biologic products such as therapeutic proteins and monoclonal antibodies. Lyophilization is typically one of the last steps in production before final packaging. During this process, water is removed from the liquid formulation of the product to enhance stability, increase shelf-life, and allow for rapid reconstitution prior to injection. Unlike other drying methods which can damage proteins, lyophilization can produce a solid product cake with minimal impact to product quality. Freeze drying has been used in the pharmaceutical industry since the mid-1900s (beginning with antibiotics), and it is the most common method for producing solid dosage forms of products that are heat-sensitive and less
stable in the presence of water.29 Consequently, the process is well-understood both in the industry and among regulators.
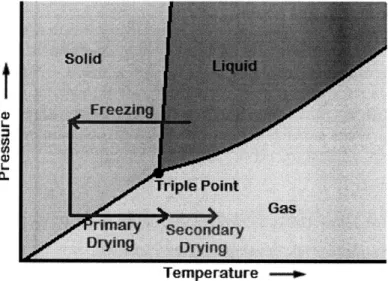
Lyophilization consists of a series of controlled phase changes. First, the liquid formulation, an aqueous solution of the product and excipients such as sugars or surfactants, is filled into glass vials and then frozen. The primary goal of the freezing step is to create a crystal matrix that will allow sublimating water to escape while locking the remaining constituents in a sponge-like configuration. Once the vials are frozen they are placed under vacuum, and heat is applied gradually to sublime the ice crystals. This stage, when unbound, crystalline water is driven out of the frozen matrix, is known as primary drying. At the end of primary drying the product typically has only 3-5% moisture. Additional heat is applied during secondary drying to remove most of the remaining bound moisture from the product/excipient matrix.30 The lyophilization process described above is shown overlaid
on the water phase change diagram below (Figure 6).
SGas
Temperature -e
Figure 6: Phase change diagram for water showing freezing, primary drying, and
secondary drying steps.
A freeze drying cycle may contain additional phases beyond those described above. For instance, an annealing step is commonly added during freezing to ensure that crystals in the frozen matrix grow as large as possible. Large water [and excipient] crystals ensure final product quality and help create
29 (Trappler, 2005)
30 (Freeze Drying/Lyophilization Info Online, 2009) 30 (Freeze Drying/Lyophilization Info Online, 2009)
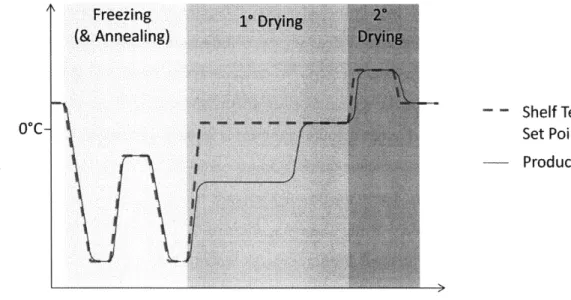
an "elegant" product cake. Annealing is accomplished by raising the temperature for a portion of the freezing step. Figure 7 shows a hypothetical lyophilization cycle, including an annealing step.
S Freezing 1' Drying2
(& Annealing)
S - - Shelf Temperature
So*C- Set Point
S- Product Temperature
E--Time
Figure 7: Hypothetical lyophilization cycle, generalized and drawn by the author. Temperatures and ramp rates for each step vary depending on the product; optimizing these values is the focus of cycle development. Note that product temperature tracks shelf temperature set point closely throughout the cycle, except during primary drying when the heat required for sublimation keeps product temperature low. When sublimation nears completion (unbound moisture has been removed), product temperature warms to the shelf temperature.
The optimal conditions for freeze drying depend on the nature of the product and the excipients, but the primary objectives during cycle development are consistent: achieve good product quality in
the shortest possible cycle time. Product quality considerations include moisture content and cake structure. A dry, "elegant" cake stabilizes the product and is easy to reconstitute (reconstitution is facilitated by the sponge-like microstructure of the dried product matrix). In addition, the absence of visual cake defects such as cracks can be crucial in clinical trials, where visual defects in the product make it discernible from the placebo, thereby "unblinding" and potentially invalidating the
study.
Lyophilization cycle time is an important area of focus during development, because it can be on the order of hours or days. Longer cycles negatively impact commercial operations by decreasing scheduling flexibility. Additionally, fixed costs are typically a large component of drug product
costs, so long cycle times have a significant negative economic impact. Cycle time may be a particularly important consideration for outsourcing, as most contract manufacturers providing lyophilization services charge based on the duration of the cycle. Cycle times can often be shortened by increasing drying temperatures and ramp rates.
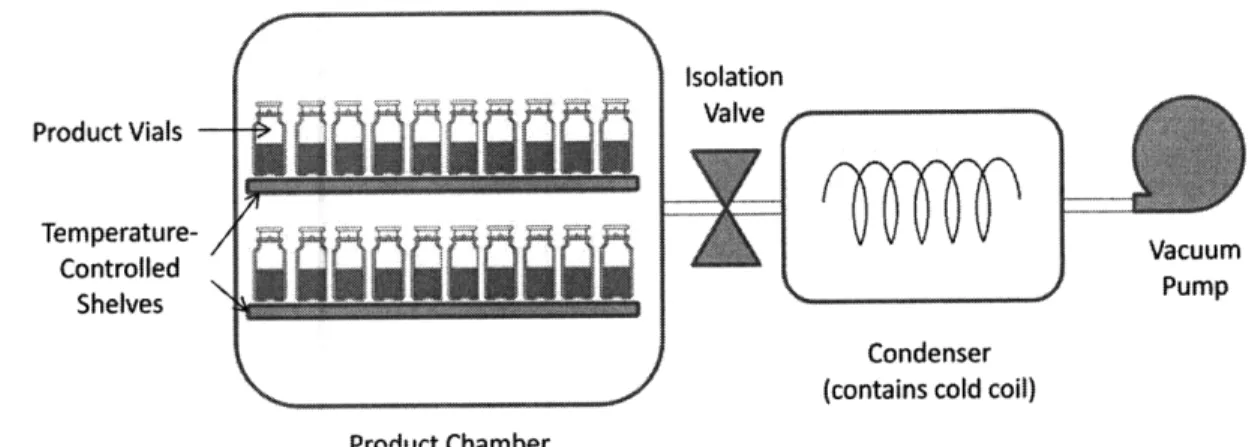
Conditions identified during cycle development are carefully controlled by the freeze drying equipment. Basic elements of a lyophilization system are a product chamber, a condenser, and a vacuum system (See Figure 8). Vials are arranged in the product chamber on
temperature-controlled shelves. During primary and secondary drying, when the entire system is under vacuum, moisture from sublimation in the primary chamber collects in the condenser, where it freezes on
cold coils. The isolation valve installed between the chamber and condenser remains open during drying. Isolation Product Vials Temperature- / Vacuum Controlled Shelves Pump Condenser (contains cold coil) Product Chamber
Figure 8: Lyophilizer configuration
5.2.2.2 SMART Freeze-Dryer TM (SFD) Technology Overview
The SMART Freeze-Dryer TM (SFD) is software based on technology originally developed jointly between the University of Connecticut and Purdue University. The technology was licensed to FTS Systems in 2003 and incorporated in their Lyostar II laboratory-scale lyophilizer. The integrated
product was officially released in 2005.31 SFD is primarily intended as a tool for accelerating and
streamlining lyophilization cycle development. Whereas cycle development has traditionally been done experimentally, requiring approximately 10 runs, the SFD can predict and test the optimal
cycle in 1 or 2 runs. FTS anticipates a reduction in average cycle development time of up to 78%.32 The SFD incorporates manometric temperature measurement (MTM), which is a novel, non-invasive means of measuring product temperature (a critical process parameter). MTM and SFD are described in greater detail below.
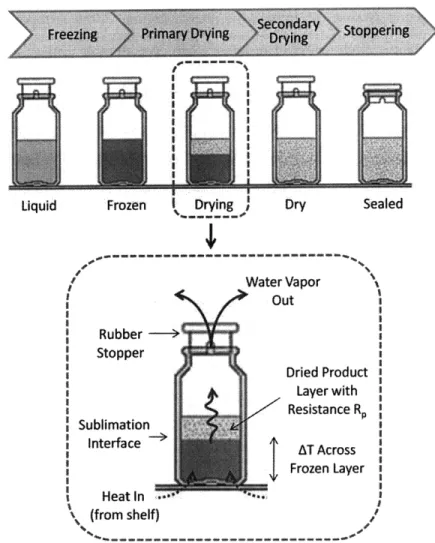
SFD technology and MTM rely on a fundamental understanding of heat and mass transfer within a product vial during primary drying. Key concepts are illustrated in Figure 9. Primary drying begins once freezing is complete and the product chamber and condenser are placed under vacuum. Shelf temperature is raised, and heat from the shelf is transferred through the bottom of the glass vial to the frozen contents. With the application of heat at low pressure, ice at the surface of the frozen layer begins to sublime into the vial headspace. Vials are only partially stoppered, so water vapor can escape into the product chamber via a small opening in the neck of the stopper. As the ice sublimes out of the frozen matrix, a porous dried product layer begins to form. The interface between the frozen layer and the dried product layer is known as the sublimation front; this front moves from top to bottom as the contents of the vial dries. Once the frozen layer is gone and only the product/excipient matrix (dry layer) remains, heat is no longer required for sublimation and product temperature rapidly rises to equilibrium with the shelf temperature. This temperature rise can be used to signal the end of primary drying.
I
I
Frozen it -Drying- W
Figure 9: Heat (red lyophilization Water Vapor i Out Rubber --~ Stopper Dried Product Layer with Resistance R Sublimation Interface . SInterface AT Across SFrozen Layer i 1 S Heat in (from shelf)
arrows) and mass (blue arrows) transfer in a product vial during
Two additional primary drying phenomena are important to note here:
1) Temperature gradient across the frozen layer: While heat is applied to the bottom of the vial from the shelves, heat is removed at the sublimation front (heat of sublimation).
Consequently, the temperature at the bottom of the frozen layer is greater than the temperature at the sublimation front. This is an important consideration for accurate product temperature measurement.
2) Mass transfer resistance from the dry product layer (Rp) and the stopper (Rs): During drying, water vapor must pass through both the dry layer and the opening in the stopper. Both
dry-Dry Sealed Liquid
layer and stopper resistance can impact the rate of drying. While stopper resistance is often considered negligible, high dry-layer resistance can considerably impact sublimation rate.33 As mentioned earlier, product temperature control is extremely important during freeze drying. Temperature is most critical at the sublimation front, where the product/excipient matrix may begin to collapse during sublimation if the temperature is too high. Collapse, or "meltback", occurs as material in the frozen matrix undergoes a phase change to a more mobile state and is no longer rigid
enough to support its own weight. A collapsed product cake is highly undesirable not only for cosmetic reasons but also because it leads to incomplete drying, product stability issues, and difficult reconstitution.3 4 Collapse temperature depends on the product and formulation, but it can be determined experimentally with a small sample using differential scanning calorimetry (DSC) or freeze drying microscopy.
Unfortunately, because product temperature results from a balance between heat input from the shelves and cooling from sublimation, product temperature cannot be controlled directly. Instead, adjustments are made to shelf temperature or chamber pressure. Estimates of product temperature are most often made using thermocouples (TCs), which may be placed in the bottom of a subset of vials prior to the start of a cycle. While TCs can provide vial temperature data throughout the cycle, there are several disadvantages to this method. First, because of the temperature difference across the frozen layer, temperature measured at the bottom of the vial by the TC does not accurately reflect the temperature at the sublimation front. Second, TCs cannot be used in a clinical or
commercial manufacturing setting because they may compromise sterility. Finally, the presence of the thermocouple may act as a nucleation site during freezing, impacting both freezing and drying behavior.35 MTM, proposed as a complement (or possibly an alternative) to TC temperature measurement during development, uses the heat and mass transfer phenomena described above to accurately measure product temperature at the sublimation front without interfering with the product.
33 (Tang, Nail, & Pikal - Part II, 2006)
34 (U.S. FDA - Guide to Inspections of Lyophilization of Parenterals, 2008) 35 (Tang, Nail, & Pikal - Part I, 2006)
5.2.2.3 Manometric Temperature Measurement (MTM)
Manometric temperature measurement is performed during primary drying by closing the isolation valve (see Figure 8) for a short, fixed period of time, thereby isolating the product chamber from the condenser and effectively "pausing" the lyophilization cycle. Sublimation continues during this period, causing chamber pressure to rise. Chamber pressure vs. time data are recorded for as long as the isolation valve is closed, typically less than 30 seconds. The resulting pressure-rise curve (see Figure 10 for an example) can be used to determine the temperature at the sublimation front. Chamber pressure rise is described by the MTM equation (Equation 1)36:
Equation 1: MTM Equation
3.461-N-A -T
P(t) = Pice - ice - Po) * exp[ -( PN.) 1
"Term 1
+ 0.0456. ice AT - 1 - 0.811 -exp( L) + (X t}ferm 3
Where Pic is the vapor pressure of ice at the sublimation front (to be determined, or "fit"); Po is the chamber pressure (set); N is the number of vials in the chamber (known); A is the total cross-sectional area of all vials (known); Ts is the shelf temperature (set); V is the product chamber volume
(known); Rp+Rs is the product and stopper resistance (to be determined, or "fit"); AT is the temperature difference across the frozen layer; L' is the ice thickness (calculated from other data); and X is a constant (to be determined, or "fit"). 37
Chamber pressure rise is attributed to three different factors, each of which is represented in the MTM equation. Term 1 accounts for pressure rise controlled by dry layer resistance and the
temperature at the sublimation front. Term 2 accounts for chamber pressure rise due to the transfer of heat across the frozen layer (from shelf to sublimation front). Finally, Term 3 accounts for chamber pressure rise due to the MTM measurement itself: closing the isolation valve increases
36 (Milton, Pikal, Roy, & Nail, 1997)
37 (Milton, Pikal, Roy, & Nail, 1997), (Tang, Nail, & Pikal - Part I, 2006)
chamber pressure and slows sublimation, reducing heat dissipation at the sublimation front and increasing product temperature.38
A commercial software package, such as that included in the SFD, can be used to fit pressure rise data to the MTM equation. The vapor pressure of ice at the sublimation front, Pie, and the total resistance (Rp+Rs) can be determined from the fit, and the product temperature at the sublimation front, T,, can be determined from Pice according to Equation 2." SFD uses these data to calculate additional system and cycle parameters such as product resistance (Rp), vial heat transfer coefficient
(Kv), frozen layer thickness (Lc), and the temperature difference across the frozen layer (AT)(see Appendix for these relationships).
Equation 2: Product temperature calculation from the vapor pressure of ice (Pic)
-6144.96
Tp (MTM) = Tp(MTM) = In(Pice) - 24.01849
Tang et al. have identified two distinct regions in an MTM pressure rise curve that are critical for the accuracy of the fit. As shown in Figure 10, the initial, rapid pressure rise is dominated by resistance to mass transfer (Rp+Rs), corresponding to Term 1 in the MTM equation. The more gradual plateau region is dominated by temperature (heat transfer across the frozen layer), corresponding to Term 2 and Term 3 in the MTM equation. Tang et al. demonstrated that MTM accuracy is considerably reduced if both regions of the curve are not allowed to develop, i.e. if pressure rise is too gradual. Though extending the duration of the measurement may allow the full curve to develop, this approach is unacceptable because it increases the impact on product temperature (Term 3 in the MTM equation). Tang et al. have found that data collection times of more than 30 seconds can adversely affect product stability and lead to collapse. The MTM measurement is typically restricted to 25 seconds.40
38 (Tang, Nail, & Pikal - Part I, 2006) 39 (Tang, Nail, & Pikal - Part I, 2006)
250
Figure 10: Sample pressure-rise data. (Data are from Run #4 described in Table 2 below)
There are three issues which can slow the development of the resistance-dominated (rapid-rise) region of the curve and thereby negatively impact MTM accuracy:
1) Low vial count (small sublimation surface area, A) 2) High chamber volume, V
3) High total resistance, R,+Rs
Several investigators have identified limits for each of these parameters within which product temperature can be measured accurately with MTM.41 These values were used as guidelines for the studies described below, and they must be considered carefully for any new stock-keeping unit (SKU; SKUs may vary by vial size, dose, etc.). For instance, if a new product formulation has an unusually high Rp, MTM may not be appropriate for product temperature measurement.
Finally, it is important to note here that MTM provides only one measure of product temperature, presumably some average temperature for all of the vials in the chamber. Hence, vial temperature heterogeneity can also impact MTM accuracy. It is generally accepted that temperature varies depending on a vial's position on the shelf: vials on the edges of a shelf are typically warmer due to
41 (Gieseler, 2006), (Tang, Nail, & Pikal - Part I, 2006)
S200 0o Resistance-' D a Temperature-Dominate S Dominated S100 -o E 50 0 5 10 Time (sec)