Publisher’s version / Version de l'éditeur:
Journal of Physics B: Atomic, Molecular and Optical Physics, 48, 6, 2015
READ THESE TERMS AND CONDITIONS CAREFULLY BEFORE USING THIS WEBSITE. https://nrc-publications.canada.ca/eng/copyright
Vous avez des questions? Nous pouvons vous aider. Pour communiquer directement avec un auteur, consultez la
première page de la revue dans laquelle son article a été publié afin de trouver ses coordonnées. Si vous n’arrivez pas à les repérer, communiquez avec nous à [email protected].
Questions? Contact the NRC Publications Archive team at
[email protected]. If you wish to email the authors directly, please see the first page of the publication for their contact information.
NRC Publications Archive
Archives des publications du CNRC
This publication could be one of several versions: author’s original, accepted manuscript or the publisher’s version. / La version de cette publication peut être l’une des suivantes : la version prépublication de l’auteur, la version acceptée du manuscrit ou la version de l’éditeur.
For the publisher’s version, please access the DOI link below./ Pour consulter la version de l’éditeur, utilisez le lien DOI ci-dessous.
https://doi.org/10.1088/0953-4075/48/6/061001
Access and use of this website and the material on it are subject to the Terms and Conditions set forth at
Attosecond lighthouse driven by sub-two-cycle, 1.8 μm laser pulses
Zhang, C.; Vampa, G.; Villeneuve, D.M.; Corkum, P.B.
https://publications-cnrc.canada.ca/fra/droits
L’accès à ce site Web et l’utilisation de son contenu sont assujettis aux conditions présentées dans le site LISEZ CES CONDITIONS ATTENTIVEMENT AVANT D’UTILISER CE SITE WEB.
NRC Publications Record / Notice d'Archives des publications de CNRC:
https://nrc-publications.canada.ca/eng/view/object/?id=29479abf-d117-4316-ba13-0c537fd1ec20 https://publications-cnrc.canada.ca/fra/voir/objet/?id=29479abf-d117-4316-ba13-0c537fd1ec20Chunmei Zhang, Giulio Vampa, D M Villeneuve and P B Corkum
Joint Attosecond Science Laboratory, University of Ottawa and National Research Council, 100 Sussex Drive, Ottawa, ON K1A 0R6, Canada
E-mail:[email protected]
Received 3 November 2014, revised 30 January 2015 Accepted for publication 4 February 2015
Published 20 February 2015 Abstract
We generate space-time coupled attosecond pulse trains with a 1.8 μm wavelength laser pulse using the ‘attosecond lighthouse’ technique. We show low divergence, spatially well-separated beamlets from low ionization potential gas media. We also find that there is little long trajectory contribution—only the short trajectory contribution is clearly visible for any beamlet. These results open a new route for extending attosecond technology to higher cut off energy and shorter pulse duration.
Keywords: attosecond, lighthouse, mid-IR
(Some figures may appear in colour only in the online journal) Introduction
High-order harmonic generation, the nonlinear interaction between intense laser pulses and an ionizing medium, pro-duces bursts of coherent XUV emission with attosecond pulse duration [1]. These attosecond pulses make the study and control of ultrafast electron dynamics [2] possible up to a time scale that is currently <100 asec [3]. To improve the duration further we need larger bandwidth emission with reduced temporal chirp.
Extending attosecond methods to infrared drivers is important because the bandwidth of the photons emitted during a re-collision [4] is limited by the cut-off energy of
∼ +
E 3.17UP IP [5], where IP is the ionization potential of
the atom andUP=I /(4ω2)is the ponderomotive energy of an
electron oscillating in the most intense part of the laser pulse with intensity I and angular frequency ω (atomic units are
used). While this equation suggests that the harmonic band-width can be extended by increasing either the intensity or the wavelength of the driving laser pulses, an extremely high driving laser field will saturate ionization in the nonlinear medium and limit the harmonic conversion efficiency. Therefore, the only effective approach to extend the
bandwidth of attosecond pulses is to use a longer-wavelength driving laser field. In fact, experiments confirm [6] that a mid-IR driving pulse produces more energetic photons. Moreover, a longer wavelength laser pulse reduces the temporal chirp of attosecond pulses. Known as the attochirp [7–9], this is a major obstacle to further decreasing attosecond pulses durations.
Most high harmonic sources emit a train of attosecond pulses, separated in time by half the optical period. For many experiments, a single, isolated, attosecond pulse is required. There are four gating methods [10–13] available for creating isolated attosecond pulses. Here we concentrate on the ‘attosecond lighthouse’ [13]. Using a space-time coupled fundamental beam, the attosecond lighthouse technique spa-tially separates the pulses in a train. The technique has been demonstrated numerically [13] and experimentally [14, 15] for harmonics generated from plasma mirrors and gases with 800 nm wavelength laser pulses.
The attosecond lighthouse relies on the temporal wave-front rotation of the laser electric field in the nonlinear medium in which the harmonics are generated. The wavefront rotation produces a train of attosecond pulses, each pulse propagating in a slightly different direction. As the pulses move away from the source, the XUV beamlets spatially
separate. Simulations show that this technique generates multiple coherent, isolated attosecond pulses.
In this paper, we report three important experimental contributions. First, we show that the beamlets produced by the attosecond lighthouse method are better differentiated using an a few-cycle infrared driver than are the beamlets produced with an 800 nm driver [15,16]. Second, we show that long wavelength drivers allow us to apply the attosecond lighthouse to low ionization potential molecules. This opens a pathway for measuring important polar molecules where subsequent pulses re-collide from one side or the other. The attosecond lighthouse separates each recollision on the detector. Third, we report the near absence of long trajectory contributions to any of the lighthouse beamlets. This high contrast trajectory selection will be a hallmark of infrared drivers.
The experimental setup for generating few cycle 1.8 micron pulses is described in [17]. It consists of a chirped-pulse-amplified Ti:sapphire laser system, a white-light seeded high-energy optical parametric amplifier (HE-TOPAS, Light Conversion), a hollow-core fiber compressor and a vacuum chamber for the generation and characterization of high-har-monic radiation.
The Ti:sapphire laser system that we use provides 50 fs laser pulses at 800 nm with 16 mJ pulse energy at a repetition rate of 100 Hz. The optical parametric amplifier is pumped by 7 mJ of the 800 nm light and it provides 1.8 μm pulses with
∼50 fs duration. The carrier–envelope phase (CEP) of the 1.8 μm laser pulses is inherently phase stable from the OPA. It was measured with a f–2f interferometer and controlled by a servo system.
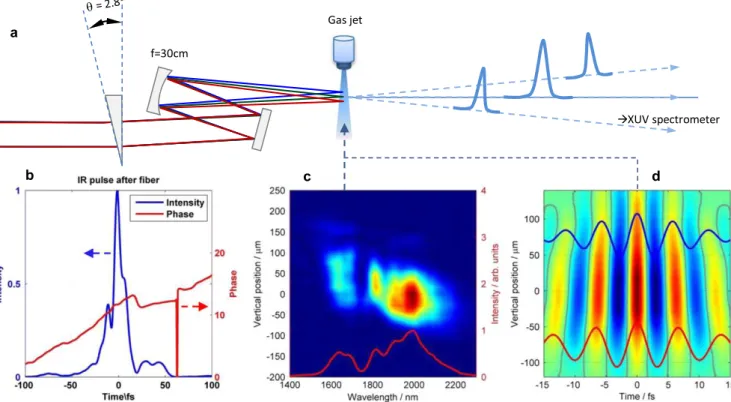
The 1.8 μm pulses from the OPA are focused into an argon-filled, differentially pumped hollow-core fiber (1 m long, 400 μm inside diameter) by an f = 75 cm lens made of CaF2. Nonlinear propagation in the hollow-core fiber adds bandwidth and an approximately linear chirp. We compensate the chirp with an antireflection coated fused silica plate in the beam path [16]. This produces 13 fs pulses, corresponding to 1.8 optical cycles at the central wavelength of 1.8 μm. We routinely achieve ∼500 μJ at the output of the fiber. The temporal profile of the amplitude and phase of the shortened pulses is shown in figure1(b).
To induce the wavefront rotation of the 1.8 μm experi-ment, we use a thin 2.8° BK7 wedge located in the beam path as shown in the figure 1(a). The wedge adds a slightly dif-ferent propagation angle to each color, imprinting a linear spatial chirp on the laser beam at the focus.
The spectrum of the spatially chirped laser pulse at the focus as a function of vertical position is shown in figure1(c). The red curve is a plot of the laser spectrum measured without the spatial chirp. The central wavelength of the pulse varies from 1600 nm to beyond 2000 nm in the direction along the linear spatial chirp. The beam size at the focus along the spatial chirp direction is measured by the knife-edge Figure 1.Principle scheme of attosecond lighthouse experiment with 1.8 μm laser source. (a) Diagram of the experimental setup. A thin wedge in the laser beam path induces spatial chirp at the focus. The attosecond pulses generated from each half-optical-cycle of the driving laser pulse propagate in different directions. (b) The temporal profile (blue curve) and phase (red curve) of the driving laser field measured after the fiber compressor using a FROG. (c) The spectrum of the spatially chirped beam measured as a function of vertical position at the focus. At the bottom, the red curve shows the laser spectrum without the spatial chirp. (d) The temporal electric field of the spatially chirped pulse at the focus. The zero crossing times of this field are shown by gray lines. The laser electric field at y = ±75 μm is shown by blue and red dotted lines.
2 J. Phys. B: At. Mol. Opt. Phys. 48 (2015) 061001
technique [18]. The Fourier transform of the spectrum at each spatial position allows us to show the electric field as a function of time and space in figure 1(d). Since the central wavelength of the laser pulse changes along the vertical axis, the zero-crossing time of each half-cycle rotates in time as shown in figure 1(d). The laser electric field at ±75 μm is shown by the blue and red curves.
The chamber has been described previously [15]. The gas source is a pulsed supersonic jet with a backing pressure of 4.5 bar. The space-time coupled laser beam is focused by a silver-coated focusing mirror (f = 30 cm) into the chamber. The gas jet is placed before the focus to optimize phase match of the short trajectory electrons. The peak intensity at the focus is ∼1015W cm−2
for all gases and the intensity at the jet position is estimated to be 0.5 × 10¹⁴W cm−2
by the high harmonic cut-off. The emission from the gas jet propagates to a slit which is parallel to the wavefront rotation direction. Therefore, each beamlet will pass through the slit at a dif-ferent height. The high harmonic spectra are resolved with a curved 1200 lines per mm grating and recorded on a micro-channel plate and CCD detector. The CCD records the spectrum of the emission along its horizontal axis, and the angle of the emission (from the gas jet to the MCP) along the vertical axis. The attosecond pulses generated at an earlier (later) time are seen on the top (bottom) of the detector in figure1(a).
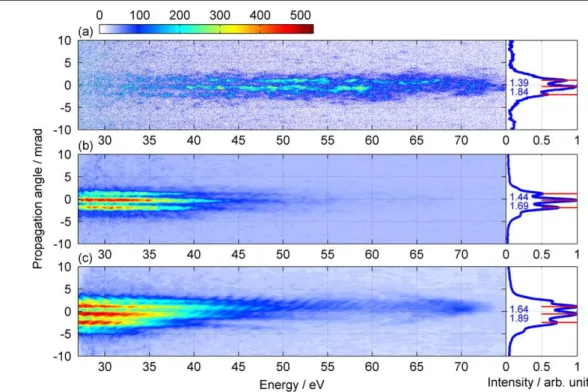
We optimize the spatial chirp by adjusting the distance between the thin wedge and the gas jet. When the distance is set to 3.5 m, we obtain beamlets that are well-separated spa-tially in the far-field. Figure 2 shows the beamlets from nitrogen (Ip= 15.4 eV), krypton (Ip= 14 eV) and xenon
(Ip= 12.1 eV). The curves in the right panels are obtained by integrating each XUV spectrum along the energy axis for the entire energy range. Wavefront rotation converts the temporal information to spatial information. Therefore, the black curves directly show the XUV beam intensity profiles in time. In each spectrum, there are three beamlets separated by about 1.5 mrad. In the case of krypton, each beamlet has a diver-gence ∼0.7 mrad. The separations between adjacent beamlets are labeled in the right panels.
All spectra in figure2 were obtained by integrating 100 pulses. Therefore, fluctuation of the CEP of the driving laser pulses blurs the spatial contrast that we measure. In the krypton spectrum (figure 2(b)) the separation between the earlier beamlets is smaller than that between the later beam-lets. This variation is due to the rapidly varying intensity envelope of the ultrashort laser pulse. When the intensity rises in time, the time spacing between adjacent XUV emissions is shorter than one half-optical cycle, while it is longer than one half-cycle when the intensity falls [19]. Similar behavior is observed in the spectra from N2 and Xe. However, the
separation between adjacent beamlets is not exactly the same for the three gases due to their different refractive index and electron density.
Compared to the lighthouse spectra obtained using an 800 nm laser, we see that the longer driving wavelength produces more continuous spectra, even for lower ionization potential gases. We also see isolated beamlets with a lower energy driver.
Figure 2 shows that the spectral intensity at 75 eV is greater for N2than for the others gases. This has two origins:
first, nitrogen has a higher ionization potential than xenon or Figure 2.Angularly resolved XUV spectrum (color map) generated in N2(a), Kr (b) and Xe (c) gas with spatially chirped laser pulse. Note
that the different background is due to the different intensity of the spectra. Right panel: the blue curve shows the spatial profile of the XUV radiation, obtained by integrating the angularly resolved XUV spectrum for the entire energy range. The red lines correspond to the propagation direction of all beamlets and the separations between adjacent beamlets are labeled.
krypton and so it requires a higher laser field to reach the same ionization rate. This produces a higher energy cut-off for N2. In addition, the structure of the transition moment of
N2 makes the high energy component relatively stronger
within the N2spectrum than is the case in Kr or Xe.
We have used the same laser parameters for all three gases in order to maintain the same wavefront rotation. This should lead to identical separation between the adjacent beamlets for each gas. Comparing the three spectra the krypton beamlets are more spatially distinct. The Kr data shows a more continuous structure because the parameters we used from figure2are optimized for Kr gas. However, if the 1.8 μm beam is optimized for the other gases, we can achieve krypton-like results. The spectrum of Kr is also notable because it only extends to ∼55 eV (much lower than the recollision electron energy would suggest). The lower energy cut-off is partly caused by the rapid decrease of the transition moment for krypton due to the Cooper minimum in this spectral region [20].
The lighthouse spectrum from Xe gas also has clear beamlets but they are less distinct than for the other gases due to xenon’s lower ionization potential which leads to increased plasma formation. Clearly visible on figure2(c) is the rise of the transition moment caused by the giant plasmon resonance at ∼100 eV [21].
Figure2 also shows that the contribution of long trajec-tories to the emission, which appears at large angle, is small. In addition, the spectral modulation arising from quantum path interference between different trajectories is not visible. In contrast, single-atom time-dependent Schrodinger calcu-lations [8] show that the contribution of long trajectories should increase with increasing laser wavelength. This sug-gests that phase matching is responsible. The intensity dependent dipole phase is larger for longer driving wave-length. When the short trajectory emission is phase matched well, the difference between short and long trajectory dipole phase implies that the long trajectory contribution should phase-match poorly. Therefore the relative contribution of the long trajectory to the emission is reduced.
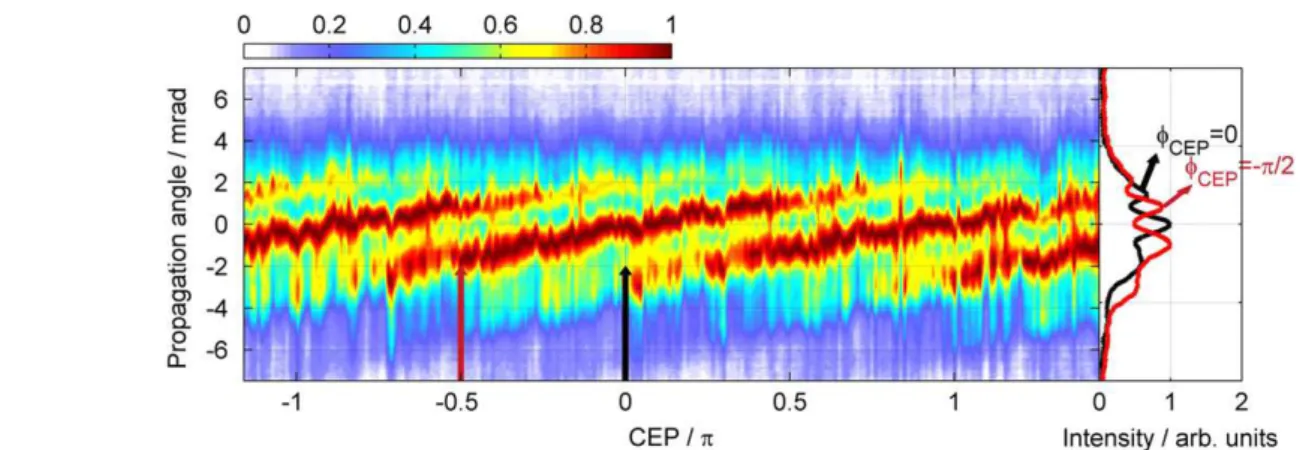
Figure 3 shows how the spatial profile of the XUV radiation varies with the CEP of the driving laser pulse. The CEP was controlled at the OPA by delaying the seed phase relative to the pump phase. The left panel displays the spatial distribution of beamlets (vertical axis) plotted for different values of CEP (horizontal axis). To obtain the figure, the spectrum was integrated from 45 to 50 eV (color code) at each spatial position. The data is shown for N2as a function of the
CEP phase which was scanned at ∼6 mrad per step (shot). As we scan the CEP continuously, the propagation direction of all beamlets shifts correspondingly due to a time shift of the whole emitted attosecond pulse train under the driving pulse envelope. In the right panel, the two lineouts correspond to the two specific CEPs indicated by the arrows. They are chosen to be a sine (red) pulse and a cosine (black) pulse. Changing from a sine to a cosine pulse shifts the direction of propagation of the beamlets by half of their separation.
In conclusion, given the long trajectory that electrons cover with infrared drivers it would not have been surprising if the spatial properties of the attosecond pulses were some-what compromised compared with 800 nm lasers. However, we have shown that the lighthouse beamlets have low divergence across their full spectra. If it were not the case, we would not be able to generate spatially separated beamlets. Quantitatively, a typical beamlet has a divergence of ∼0.7 mrad, while the divergence of the fundamental beam is ∼30 mrad.
Our results have important implications in the field of attosecond science, particularly in two directions. First, the photonic streaking can be used to optimize the phase-matching of high-order harmonic generation in high pressure gases that are important for efficient high harmonic generation with infrared drivers [22]. Photonic streaking allows us to map the temporal dynamics in the nonlinear medium directly onto the spatial dimension on a detector where it is easily observed. Second, we open a route to generate isolated atto-second pulse from many gases with very different ionization potentials. This will be important for high harmonic spec-troscopy of polar molecules where we can control from which side of a molecule an electron recollides.
Figure 3.The color figure shows the spatial profile of the XUV beam, in the presence of spatial-chirp in the driving field, as a function of the CEP of the driving laser pulse. Right panel: two lineouts at two particular CEPs differed by π/2. The shift of the spatial profile originates from the shift in time of the emitted attosecond pulse train with CEP.
4 J. Phys. B: At. Mol. Opt. Phys. 48 (2015) 061001
We also acknowledge financial support from NSERC, US AFOSR and the DARPA PULSE program through a grant from AMRDEC.
References
[1] Brabec T and Krausz F 2000 Intense few-cycle laser fields: frontiers of nonlinear optics Rev. Mod. Phys.72 545
[2] Corkum P B and Krausz F 2007 Attosecond science Nat. Phys.
3 381
[3] Zhao K, Zhang Q, Chini M, Wu Y, Wang X and Chang Z 2012 Tailoring a 67 attosecond pulse through advantageous phase-mismatch Opt. Lett.37 3891–3
[4] Corkum P B 1993 Plasma perspective on strong field multiphoton ionization Phys. Rev. Lett.71 1994
[5] Lewenstein M, Balcou P, Ivanov M Y, L’Huillier A and Corkum P B 1994 Theory of high-harmonic generation by low-frequency laser fields Phys. Rev. A49 2117
[6] Ishii N, Kaneshima K, Kitano K, Kanai T, Watanabe S and Itatani J 2014 Carrier–envelope phase-dependent high harmonic generation in the water window using few-cycle infrared pulses Nat. Commun.5 3331
[7] Doumy G, Wheeler J, Roedig C, Chirla R, Agostini P and DiMauro L F 2009 Attosecond synchronization of high-order harmonics from midinfrared drivers Phys. Rev. Lett.
102 093002
[8] Tate J, Auguste T, Muller H G, Salières P, Agostini P and DiMauro L F 2007 Scaling of wave-packet dynamics in an intense midinfrared field Phys. Rev. Lett.98 013901
attosecond pulses Phys. Rev. Lett.108 113904
[14] Wheeler J A, Borot A, Monchocé S, Vincenti H, Ricci A, Malvache A, Lopez-Martens R and Quéré F 2012
Attosecond lighthouses from plasma mirrors Nat. Photonics
6 829
[15] Kim K T, Zhang C, Ruchon T, Hergott J F, Auguste T, Villeneuve D M, Corkum P B and Quere F 2013 Photonic streaking of attosecond pulse trains Nat. Photonics7 651
[16] Quéré F et al 2014 Applications of ultrafast wavefront rotation in highly nonlinear optics J. Phys. B: At. Mol. Opt. Phys.47 124004
[17] Schmidt B E et al 2010 Compression of 1.8 μm laser pulses to sub two optical cycles with bulk material Appl. Phys. Lett.
96 121109
[18] Suzaki Y and Tachibana A 1975 Measurement of the μm sized radius of Gaussian laser beam using the scanning knife-edge
Appl. Opt.14 2809
[19] Varjú K et al 2005 Reconstruction of attosecond pulse trains using an adiabatic phase expansion Phys. Rev. Lett.95 243901
[20] Shiner A D, Schmidt B E, Trallero-Herrero C, Corkum P B, Kieffer J-C, Légaré F and Villeneuve D M 2012 Observation of Cooper minimum in krypton using high harmonic spectroscopy J. Phys. B: At. Mol. Opt. Phys.45 074010
[21] Shiner A D, Schmidt B E, Trallero-Herrero C, Wörner H J, Patchkovskii S, Corkum P B, Kieffer J-C, Légaré F and Villeneuve D M 2011 Probing collective multi-electron dynamics in xenon with high-harmonic spectroscopy Nat.
Phys.7 464
[22] Popmintchev T et al 2012 Bright coherent ultrahigh harmonics in the kev x-ray regime from mid-infrared femtosecond lasers Science336 1287–91