Blackwell Publishing Ltd
Microsatellite flanking region similarities among different
loci within insect species
E. Meglécz*, S. J. Anderson†, D. Bourguet‡, R. Butcher§, A. Caldas¶, A. Cassel-Lundhagen**, A. C. d’Acier‡, D. A. Dawson††, N. Faure‡‡, C. Fauvelot§§, P. Franck¶¶, G. Harper***, N. Keyghobadi†††, C. Kluetsch‡‡‡,
M. Muthulakshmi§§§, J. Nagaraju§§§, A. Patt‡‡‡, F. Péténian¶¶¶, J.-F. Silvain‡‡, H. R. Wilcock**** *Evolution Génome et Environnement, CASE 36,
Université de Provence, Marseille, France; †Department of Biological Sciences, The Open University, Milton Keynes, UK; ‡Centre de Biologie et de Gestion des Populations (CBGP), INRA, UMR-INRA-IRD-CIRAD-Agro.M, Campus International de Baillarguet, Montferrier/Lez, France; §Centre for Vectors and Vector-Borne Diseases, Faculty of Science, Mahidol University, Phaya thai, Bangkok, Thailand; ¶Department of Entomology, University of Maryland, USA; **Swedish University of Agricultural Sciences, Department of Entomology, Uppsala, Sweden; ††Department of Animal and Plant Sciences, University of Sheffield, Sheffield, UK; ‡‡IRD, UR072, c/o CNRS, UPR 9034, BP1, avenue de la Terrasse, Gif-sur-Yvette Cedex, France; §§Environmental Science, University of Bologna at Ravenna, Ravenna, Italy; ¶¶Plantes et Systèmes de culture Horticoles, INRA, AgroParc, Domaine St-Paul 84914 Avignon, Cedex 9, France; ***School of Applied Sciences, University of Glamorgan, Pontypridd, Mid Glamorgan; UK; †††University of Western Ontario, Department of Biology, London, Ontario, Canada; ‡‡‡Zoologisches Forschungsmuseum Alexander Koenig, Bonn, Germany; §§§Laboratory of Molecular Genetics, Centre for DNA Fingerprinting and Diagnostics, Nacharam, Hyderabad, India; ¶¶¶ER Biodiversité et Environnement, Université de Provence, Marseille, France; and
****Deceased, Department of Biological Sciences, University of Hull, Hull, UK
Abstract
Although microsatellites are ubiquitous in eukaryota, the number of available markers varies strongly among
taxa. This meta-analysis was conducted on 32 insect species. Sequences were obtained from two assem-bled whole genomes, whole genome shotgun (WGS) sequences from 10 species and screening partial genomic libraries for microsatellites from 23 species. We have demonstrated: (1) strong differences in the abundance of microsatellites among species; (2) that microsatellites within species are often grouped into families based on similarities in their flanking sequen-ces; (3) that the proportion of microsatellites grouped into families varies strongly among taxa; and (4) that microsatellite families were significantly more often associated with transposable elements – or their remnants – than unique microsatellite sequences. Keywords: microsatellite, flanking region, interspersed repetitive element, Lepidoptera, genome.
Introduction
Microsatellites have been detected in a wide diversity of eukaryotes of varying complexity and genome size (Tóth et al., 2000). Although numerous studies suggest that at least a fraction of microsatellites have important functions (Li et al., 2002, and references therein), they are generally regarded as highly variable neutral markers, and are thus the most frequently used genetic markers in population biology.
Despite early reports of microsatellite abundance (Beck-mann & Soller, 1990; Beck(Beck-mann & Weber, 1992; Epplen et al., 1997), the isolation of microsatellites as useable markers appears to be more difficult in some taxa than in others (Nematoda: Fisher & Viney, 1996; Lepidoptera: Nève & Meglécz, 2000; Zhang, 2004; Aedes aegypti and Ixodes scapulris: Fagerberg et al., 2001). There are at least two possible, non-exclusive, explanations for this heteroge-neity: (1) either the abundance of microsatellites, or (2) their localization in the genomes (e.g. coding or noncoding regions; association with repetitive DNA; extent of gene duplications or polyploidy; position on the chromosomes) significantly differ among species or higher level taxa.
Zhang (2004) has pointed out the relative scarcity of microsatellites in Lepidopteran genomes, as have Fagerberg
et al. (2001) in I. scapularis (Arachnida; Ixodida) and A. aegypti (Diptera). Both studies are based on indirect esti-mates, as genome data are rare for non-Dipteran (non-Drosophila) insects. The only Lepidoptera genome that has been sequenced so far is of Bombyx mori (Mita et al., 2004; Xia et al., 2004). In this species, microsatellites make up 0.31% of the genome (Prasad et al., 2005), which is rather low but not out of the range of other analysed genomes (Tóth et al., 2000). In this study, we directly compared microsatellite abundance among the 10 insect species for which Whole Genome Shotgun (WGS) sequences are available.
The use of polymerase chain reaction-based micro-satellite analysis in population genetics is based upon the premise that the flanking sequences are unique for each locus (single co-dominant locus evaluation) and that they mutate much more slowly than the microsatellite repeat motif (Hancock, 1999). While there have been many stud-ies on the mutation pattern of microsatellite core repeats (Weber & Wong, 1993; Michalakis & Veuille, 1996; Chakraborty et al., 1997; Schlötterer, 1998; Schug et al., 1998; Estoup & Cornuet, 1999; Hancock, 1999; Pupko & Graur, 1999), little is known on their origin, including the uniqueness of their flanking sequences. A recent study showed that in two butterfly species a considerable propor-tion of the isolated microsatellite loci cluster into families based on similarities between flanking regions of different loci (Meglécz et al., 2004). The work presented here aims to (1) test if this phenomenon is general in insects and in Lepidoptera in particular, and to (2) examine the distribution of the frequencies of these microsatellite families among taxa.
As microsatellites are generally more frequent in non-coding DNA regions (Hancock, 1995; Ramsay et al., 1999; Metzgar et al., 2000; Tóth et al., 2000; Karaoglu et al., 2005) and a large portion of noncoding DNA is repetitive in
many species (Comeron, 2001; Kidwell & Lisch, 2001; Li et al., 2002 and references therein), we also tested the association between microsatellite families and inter-spersed repetitive elements.
Results and discussion
Microsatellite abundance
The estimation of microsatellite abundance is very difficult without genomic data. Indirect methods, such as using the frequency of positive clones, have a number of potential biases. The emergence of genomic data provides a possi-bility to have a clearer picture, but only for a limited number of species. Furthermore, it is difficult to directly compare the results of independent studies, as there are no standard criteria for the minimal size of the microsatellites. In this study, we have used microsatellites with at least four un-interrupted repeat units (eight for single base pairs), so that even short mono- or dinucleotide repeats are included in the analyses. In similar studies, the criteria have been both more and less stringent. For example Tóth et al. (2000) used microsatellites longer than 12 bp for a wide variety of Eukaryotes, Dieringer & Schlötterer (2003) used at least two repetitions, Karaoglu et al. (2005) used microsatellites longer than 10 bp for fungal genomes and Prasad et al. (2005) used at least five repetitions (15 for single bases), for B. mori.
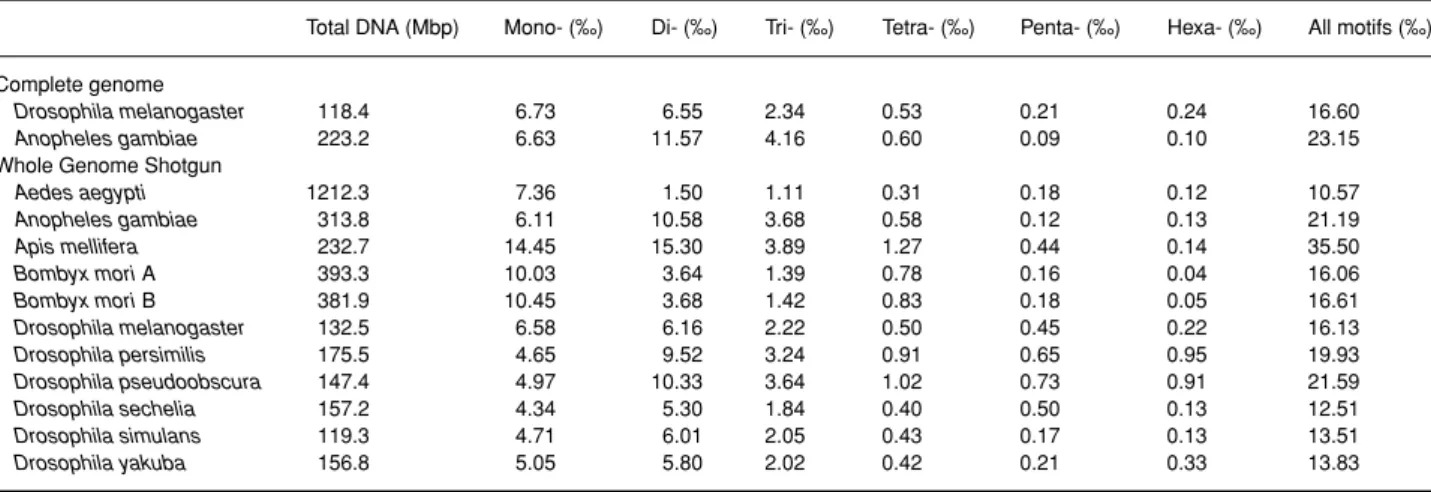
Table 1 presents the estimated proportion of pure micro-satellites in the genome, for each repeat unit length, calcu-lated from WGS and complete genome data. At first sight, our estimation seems extremely high. For example, we found that on average ≈ 16 kb of microsatellite is found per 1 Mb of genomic DNA in the B. mori genome, while this was found to be ≈ 3 kb in Prasad et al. (2005) for the same species. Rerunning our analyses with the same criteria as applied by Prasad et al. (2005), however, gave very similar
Table 1.Total length of the analysed genomic sequences and proportion of microsatellites observed for each repeat unit length for the complete genome and WGS data
Total DNA (Mbp) Mono- (‰) Di- (‰) Tri- (‰) Tetra- (‰) Penta- (‰) Hexa- (‰) All motifs (‰) Complete genome
Drosophila melanogaster 118.4 6.73 6.55 2.34 0.53 0.21 0.24 16.60
Anopheles gambiae 223.2 6.63 11.57 4.16 0.60 0.09 0.10 23.15
Whole Genome Shotgun
Aedes aegypti 1212.3 7.36 1.50 1.11 0.31 0.18 0.12 10.57 Anopheles gambiae 313.8 6.11 10.58 3.68 0.58 0.12 0.13 21.19 Apis mellifera 232.7 14.45 15.30 3.89 1.27 0.44 0.14 35.50 Bombyx mori A 393.3 10.03 3.64 1.39 0.78 0.16 0.04 16.06 Bombyx mori B 381.9 10.45 3.68 1.42 0.83 0.18 0.05 16.61 Drosophila melanogaster 132.5 6.58 6.16 2.22 0.50 0.45 0.22 16.13 Drosophila persimilis 175.5 4.65 9.52 3.24 0.91 0.65 0.95 19.93 Drosophila pseudoobscura 147.4 4.97 10.33 3.64 1.02 0.73 0.91 21.59 Drosophila sechelia 157.2 4.34 5.30 1.84 0.40 0.50 0.13 12.51 Drosophila simulans 119.3 4.71 6.01 2.05 0.43 0.17 0.13 13.51 Drosophila yakuba 156.8 5.05 5.80 2.02 0.42 0.21 0.33 13.83
results to theirs (data not shown). It thus appears that this large discrepancy among the estimates is due to the large number of short microsatellites present in the genome of B. mori.
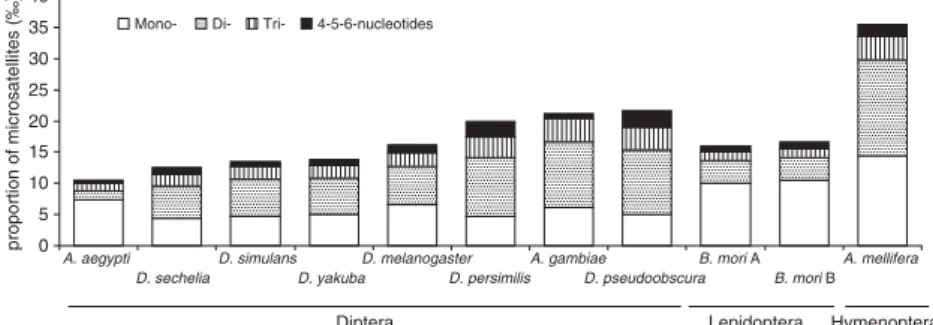
Nevertheless, our results enable us to compare the frequencies of microsatellites among the 10 species for which WGS data were available. We observed a three-fold variation in microsatellite frequencies among the 10 inves-tigated insect species, with the lowest value in A. aegypti and the highest in Apis mellifera. Even within the Drosophila genus, the variation among species is considerable (Table 1). Running the analyses with more stringent criteria (i.e. at least five to eight uninterrupted repeats) did not change the overall pattern of variation among species (data not shown). The difference between genomes is even more pro-nounced when only 2 – 6 bp motifs are considered (Fig. 1). The proportion of mononucleotide motifs compared with other motifs is particularly high in B. mori and A. aegypti. As microsatellites with mononucleotide motifs are rarely used as markers, this introduces even greater difference among species in the abundance of potential genetic markers.
A particularly low frequency of positive clones was reported in A. aegypti compared with Anopheles albimanus (Fagerberg et al., 2001) and for several Lepidoptera spe-cies (Zhang, 2004 and references therein), while A. mellif-era is one of the insect species for which a very large number of microsatellite markers are established (Solignac et al., 2003). Microsatellite abundance in the genome is thus probably a relevant factor in the success of micro-satellite marker isolation; however, it is unlikely to be the only source of the problems specifically found in some taxa such as Lepidoptera. The low frequency of microsatellites in the genome should not lead to amplification problems and in principle, with enrichment or by increasing the number of screened clones, a sufficient number of markers could be isolated.
Proportion of grouped sequences
Microsatellite flanking sequences were analysed species by species. Each data set was blasted against itself (e = 1E-40) and sequences were sorted into four catego-ries based on the results of the BLASTn: (1) Unique if no
similarities were observed to any other sequences of the same data set; (2) UnBLASTable if sequence had no hits at all, not even with itself; (3) Redundant, if the identity to another sequence was higher than 95% along the whole flanking sequence; and (4) Grouped if sequences pro-duced a significant hit with at least one different sequence and they were not redundant.
Data from complete genomes and WGS For both Drosophila melanogaster and Anopheles gambiae, the estimates of the proportion of grouped sequences were lower from com-plete genome sequences than from WGS (Table 2). This might be the consequence of the fact that genome assem-bly is the most difficult in regions with a high concentration of repetitive DNA, thus these regions might be over-represented among the contigs of the WGS sequences. Consequently, the proportion of grouped sequences should not be taken literally from WGS data. Nevertheless, the same tendency is observed in both WGS and complete genome estimations: the genome of A. gambiae con-tains a higher proportion of microsatellite sequences grouped into families than that of D. melanogaster (Table 2; χ2
= 4146.4, P < 0.0001; χ2 = 69.1, P < 0.0001, for com-plete genome and WGS data, respectively).
The presence of microsatellite sequence families is clearly demonstrated in all 10 species for which WGS data were available (Table 2). The proportion of grouped sequences among WGS data sets varied largely among species (χ2 = 12997.1, P < 0.0001). However, as discussed above, these proportions are only rough estimates, and should be interpreted with caution. Nevertheless, it is still striking that the proportion of grouped sequences in B. mori is the highest among the investigated 10 species (36.1% and 34.7%, respectively, for the two data sets) and it is significantly higher than the second highest proportion (23.6% for A. aegypti; χ2 = 368.5, P < 0.0001; χ2 = 293.6, P < 0.0001, respectively).
Data from screening partial libraries Sequences originating from screenings of partial genomic libraries may be biased by the screening protocol applied. However, as discussed in Meglécz et al. (2004) the same protocol used in the Figure 1.The proportion of pure microsatellites
for each repeat unit length based on WGS data. ‰ refers to the total length of microsatellites in kbp per one Mbp of analysed DNA.
same laboratory, at the same time, for different species gave strikingly different estimates of the proportion of grouped sequences (Euphydryas aurinia, Parnassius apollo, Aphis fabae). Our enlarged series of data from screenings show the same lack of association between the applied protocols and the proportions of grouped sequences. Indeed, the same protocol was used for Busseola fusca, Cydia pomonella, E. aurinia, Ostrinia nubilalis, P. apollo, A. fabae, with the percentage of grouped sequences ranging from 2.8% to 55.1% (χ2 = 75.3, P < 0.0001), and another protocol for Drupadia theda and Arhopala epimuta, where the two species were screened simultaneously, yielded 6.5% and 31.4% grouped sequences, respectively (χ2 = 10.3,
P = 0.0013). Thus, it is unlikely that the screening protocol is responsible for the high proportion of grouped sequences in some species (Table 2).
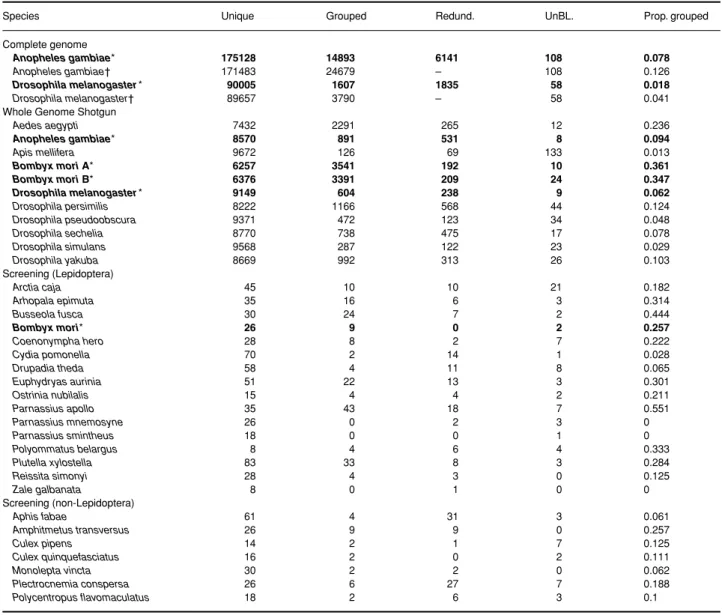
An obvious disadvantage of the screening data is the relatively small number of sequences available for each spe-cies. By increasing the number of investigated sequences some of the sequences classified as unique can become grouped. Thus the proportion of grouped sequences depends partially on the number of sequences available. This introduces a downwards bias in the estimation of the proportion of grouped sequences in small data sets. B. mori data provide a possibility to compare estimates of the proportion of grouped sequences based on screening Table 2.Number of sequences in each category for each data set
Species Unique Grouped Redund. UnBL. Prop. grouped
Complete genome
Anopheles gambiae* 175128 14893 6141 108 0.078
Anopheles gambiae† 171483 24679 – 108 0.126
Drosophila melanogaster* 90005 1607 1835 58 0.018
Drosophila melanogaster† 89657 3790 – 58 0.041
Whole Genome Shotgun
Aedes aegypti 7432 2291 265 12 0.236 Anopheles gambiae* 8570 891 531 8 0.094 Apis mellifera 9672 126 69 133 0.013 Bombyx mori A* 6257 3541 192 10 0.361 Bombyx mori B* 6376 3391 209 24 0.347 Drosophila melanogaster* 9149 604 238 9 0.062 Drosophila persimilis 8222 1166 568 44 0.124 Drosophila pseudoobscura 9371 472 123 34 0.048 Drosophila sechelia 8770 738 475 17 0.078 Drosophila simulans 9568 287 122 23 0.029 Drosophila yakuba 8669 992 313 26 0.103 Screening (Lepidoptera) Arctia caja 45 10 10 21 0.182 Arhopala epimuta 35 16 6 3 0.314 Busseola fusca 30 24 7 2 0.444 Bombyx mori* 26 9 0 2 0.257 Coenonympha hero 28 8 2 7 0.222 Cydia pomonella 70 2 14 1 0.028 Drupadia theda 58 4 11 8 0.065 Euphydryas aurinia 51 22 13 3 0.301 Ostrinia nubilalis 15 4 4 2 0.211 Parnassius apollo 35 43 18 7 0.551 Parnassius mnemosyne 26 0 2 3 0 Parnassius smintheus 18 0 0 1 0 Polyommatus belargus 8 4 6 4 0.333 Plutella xylostella 83 33 8 3 0.284 Reissita simonyi 28 4 3 0 0.125 Zale galbanata 8 0 1 0 0 Screening (non-Lepidoptera) Aphis fabae 61 4 31 3 0.061 Amphitmetus transversus 26 9 9 0 0.257 Culex pipens 14 2 1 7 0.125 Culex quinquefasciatus 16 2 0 2 0.111 Monolepta vincta 30 2 2 0 0.062 Plectrocnemia conspersa 26 6 27 7 0.188 Polycentropus flavomaculatus 18 2 6 3 0.1
Unique = number of sequences with no similarities to any other sequences of the same data set; Grouped = number of sequences grouped into sequence families based on similarities in their flanking region; Redund. = number of redundant sequences; UnBL. = number of the sequences that did not produce any hit; Prop. Grouped = proportion of grouped sequences (Grouped/(Grouped + Unique)).
*Species with more than one data set available are in bold characters. †Without the identification of redundant sequences.
vs. WGS data. As expected, the proportion of grouped sequences is lower when estimated from the screening data (25.7%) than from the WGS data (34.7% and 36.1% for the two data sets). However, these estimates are not significantly different (χ2 = 0.882, P = 0.348; χ2 = 1.222, P = 0.267, for the two comparisons, respectively).
In spite of the downwards bias of the proportion of grouped sequences from screening data, we demonstrated the presence of sequence families in almost all studied species apart from three species for which only a few sequences were available. Nevertheless, by decreasing the stringency of the search for sequence similarities (i.e. BLAST with e = 1E-10 instead of e = 1E-40) Parnassius mnemosyne and Parnassius smintheus had 6.9% and 15.8% of grouped sequences, respectively. Only Zale galbanata (with only nine sequences available) remained apparently free from grouped sequences. Thus, there appears to be a common trend that varying and often high proportion of microsatellite sequences within Lepidoptera species cluster into families. Some of the microsatellites of the seven control (non-Lepidoptera) species also grouped into families, and WGS data sets indicated that this phe-nomenon is indeed not restricted to Lepidoptera, but it is present in all investigated taxa (Table 2).
GenBank entries of microsatellites Of the 415 insect species for which microsatellite sequences have been sub-mitted to GenBank, 13% had at least one pair of grouped sequences. Note that redundant sequences were identified and discarded as before, in order to avoid a further possible bias of different teams of researchers working on the same species and finding the same microsatellite sequences. By selecting only species that have at least 10, 20, 30 or 40 sequences available in GenBank, the proportion of species having at least two grouped sequences increased strongly (32%, 53%, 71%, 81%, respectively). Undoubtedly, Gen-Bank microsatellite entries are not representative of whole genomes as in most cases researchers submit only poly-morphic loci for which successful amplification protocols were established. Furthermore, the number of sequences is very low for most of the species (i.e. only 58 insect spe-cies had a minimum of 20 microsatellite entries). In spite of these factors, which introduce a very strong downwards bias in the proportion of grouped sequences, a high propor-tion of species representing diverse insect orders had mic-rosatellite sequence families.
Grouped vs. redundant sequences For all data sets, the same approach was used to identify grouped and redun-dant sequences. This is a necessary step for data originat-ing from both screenoriginat-ing and whole genome shotgun sequencing, in order to eliminate alleles of the same locus or multiple copies of the same allele. Our choice of the 95% cut-off is based on previously published results (for
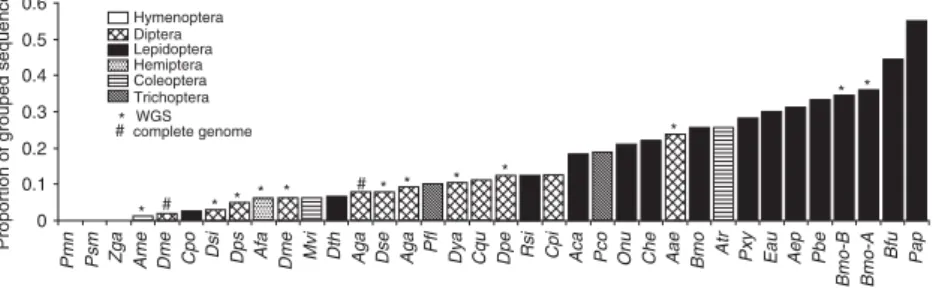
discussion see Meglécz et al., 2004). Although, the complete genome sequences are nonredundant, we used the same method for identification of redundant sequences in order to obtain results comparable with the other data. Running the analysis with or without the identification of redundant sequences for complete genomes suggests that our proce-dure of eliminating redundant sequences and setting the cut-off limit to 95% is rather conservative. Indeed, a con-siderable portion of the sequences classified as redundant are in fact not redundant but represent different loci grouped into families. As a result, the proportions of grouped sequences within species are underestimated. However, as our principal aim was to compare the proportion of grouped sequences among the different data sets, the cut-off value is of little importance as long as it is identical for all analyses. Furthermore, demonstrating the presence of microsatellite sequence families with a conservative method gives an even stronger evidence of their occur-rences. While using this conservative method, we man-aged to demonstrate the presence of microsatellite sequence families based on interlocus similarities of the flanking regions in a wide variety of insect species from data of diverse origins. Although the quantification of this phenomenon is difficult, our results indicate that the propor-tion of grouped microsatellites varies considerably among species and taxa. In particular, data from both partial genomic screens and WGS indicate that in many Lepidop-tera the proportion of grouped sequences is particularly high (approximately 20% or more; Fig. 2).
Association between microsatellites and interspersed repetitive elements
All sequences were screened for the presence of repetitive elements. When testing D. melanogaster microsatellites from the complete genome data set against the Drosophila repetitive elements bank, 6.4% of the sequences showed significant similarities to diverse repetitive elements. This proportion, however, was more than 20 times higher among grouped sequences (83.5%), than among unique sequen-ces (3.5%; χ2 = 21315; P < 0.0001). Testing D. melanogaster microsatellite sequences against the Anopheles repetitive DNA bank gave similar but much less striking results: 1.1% sequences showed similarities to repetitive elements in total, 1.9% among grouped sequences, 0.8% among uniques. Nevertheless, these proportions remained signifi-cantly different (χ2 = 19.4; P < 0.0001).
A similar tendency was observed for A. gambiae micro-satellites. When testing against the Anopheles repetitive elements bank the proportion of sequences showing simi-larities to a repetitive element is 40.1% and 3.4% for grouped and unique sequences, respectively (χ2 = 32142; P < 0.0001), while against the Drosophila bank these proportions are 0.6% and 0.3% (χ2 = 54.0; P < 0.0001). Thus, for a large proportion of grouped sequences in these
two species, associations between repetitive elements and microsatellites have been demonstrated. Furthermore, our results indicate that repetitive element banks are rather specific for each species or genus, and the sensitivity of the detection of repetitive elements is strongly reduced for species in different genera even from the same order.
Screening microsatellite sequences from WGS data for repetitive elements yielded very similar results for all Dro-sophila (six species) and Anopheles species as described above (data not shown). However, only 0.75% (n = 10000) microsatellites sequences of A. aegypti showed similarities to the Anopheles repetitive bank, and for all non-Diptera species this portion was even lower. This resulted in a low power of detecting the difference between the proportion of repetitive elements among grouped and unique sequen-ces. In spite of this, the proportion of the sequences associ-ated with repetitive elements was still significantly higher among grouped sequences than among unique ones in B. mori (data set B; against the Anopheles bank, χ2 = 9.27; P = 0.0023).
A large number of studies indicate that microsatellites are more frequent in noncoding regions than in coding ones (Wang et al., 1994; Edwards et al., 1998; Metzgar et al., 2000; Li et al., 2002; Tóth et al., 2000). Only tri- and hexa-nucleotide repeats seem to be more frequent in coding regions (Morgante et al., 2002), which is probably the con-sequence of negative selection against frameshift muta-tions in the coding regions (Metzgar et al., 2000). It is also known that, in species with large genomes in particular, noncoding DNA is largely composed of repetitive elements (Kidwell & Lisch, 2001). For example, 45% of the euchro-matic DNA in humans corresponds to transposable ele-ments (Smit, 1999; Lander et al., 2001), and the size of the genome of maize has been doubled as a result of retrotransposon insertions (SanMiguel & Bennetzen, 1998). Association between microsatellites and transposable ele-ments has been reported in nematodes (Hoekstra et al., 1997; Johnson et al., 2006), Dipterans (Fagerberg et al., 2001; Wilder & Hollocher, 2001), rice (Akagi et al., 2001; Temnykh et al., 2001) and barley (Ramsay et al., 1999). Similarly, our study clearly demonstrates that a large pro-portion of Drosophila (six species) and A. gambiae grouped microsatellites are associated with diverse transposable
elements. Furthermore, we demonstrated the specificity of the repetitive elements banks to each species/genus. This indicates that the lack of significant association between transposable elements and microsatellites for the other investigated insect species is probably the result of the scarcity of information on the transposable elements in those specific species, rather than a true lack of associa-tion. Thus, it is likely that the presence of microsatellite families is at least partially the result of the association bet-ween microsatellites and interspersed repetitive DNA elements or their remnants.
There are at least three different mechanisms that might create this kind of microsatellite–transposable element association. (1) Microsatellites arise at random in the genome, but they are more likely to be removed from cod-ing and control regions. In this case, the association would be incidental. However, with this mechanism, most micro-satellites are expected to be found near interspersed repet-itive elements and thus they should become grouped. Our results do not support this hypothesis. (2) If a microsatellite arises in a transposable element, the number of micro-satellite loci can be considerably amplified by transposition. (iii) Transposons might take an active role in microsatellite origin if microsatellites arise during transposition. In the two latter cases, grouped microsatellites are expected to be associated with transposable elements more often than unique ones. This is supported by our results. However, dis-tinguishing between these two scenarios requires more detailed analyses and it is beyond the scope of this paper.
BLAST against baculovirus sequences
Lepidoptera are commonly infected by baculoviruses (Cory & Myers, 2003). In order to test the hypothesis of non-insect amplified DNA, all Lepidoptera microsatellite sequences were BLASTed against genomes of baculoviruses. As these analyses did not produce any significant hits, it is unlikely that virus infection is a cause of the presence of sequences families in Lepidoptera.
Implications on the use of microsatellites as markers Although the use of grouped microsatellites as genetic markers is not impossible (Hoekstra et al., 1997), they are unlikely to be good candidates for single locus genotyping
Figure 2.Proportion of grouped sequences estimated from different type of data. The first letters of the three-letter codes refer to the genus the second and the third are the first two letters of the species names.
purposes as flanking region similarities can lead to multiple locus amplifications and unclear banding patterns. Thus the variability among species in both the proportion of grouped sequences and the abundance of microsatellites may explain the large differences in the success/effort ratio of establishing reliable microsatellite markers for Lepidop-tera and more generally for insects.
We are aware of two different methods to avoid clones containing grouped sequences. van’t Hof et al. (2005) have established a method to eliminate grouped sequences as a last step of the screening process prior to sequencing. An alternative approach is to isolate single-copy DNA from the genome prior to screening for micro-satellites (Elsik & Williams, 2001), as has recently been accomplished for Aedes japonicus (Widdel et al., 2005). Once the screening is done and sequences are available, it is strongly advised to check microsatellite flanking sequences for interloci similarities prior to primer design. The program, MicroFamily (Meglécz, 2007; http://www.up. univ-mrs.fr/Local/egee/dir/meglecz/MicroFamily.html) can accomplish this task. However, if only a low number of clones/sequences are available the fact that a sequence is found to be unique, does not necessarily indicate its uniqueness in the genome. The program Primer3 for designing primers (Rozen & Skaletsky, 2000) has a highly useful option of screening sequences for interspersed repeats using human, rodent or Drosophila repetitive element banks. However, as shown above, the sensitivity of detecting interspersed repeats from a noncongeneric repetitive bank is low.
A further problem in Lepidoptera and in many other spe-cies (Keyghobadi et al., 1999; Harper et al., 2003; Meglécz et al., 2004; Zhang, 2004; van’t Hof et al., 2005) is the fre-quent presence of null alleles, even for apparently clearly amplifying and interpretable microsatellite loci. This prob-lem still has to be addressed in future research. Hardison et al. (2003) have demonstrated the covariance of substitu-tion rate and transposisubstitu-tion frequency among different genomic regions in human and mouse genomes. One possibility is that transposition frequencies and substitution rates also covary among species, such that some species or groups of species have both a high number of trans-posable elements and high average mutation rates. In these species, the association between microsatellites and trans-posable elements can lead to many microsatellites that are not unique; but, even if amplification is successful, the high mutation rate in the flanking regions may lead to a high likeli-hood of null alleles.
Conclusions
Microsatellites are used as highly polymorphic, single locus, co-dominant markers. However, our results demon-strated that in insects, a variable proportion of microsatellites
cluster into sequence families based on similarities in their flanking region. In some species, this phenomenon, in association with a relatively low abundance of micro-satellites, renders the isolation of reliable microsatellite markers particularly difficult.
The association between microsatellite sequence fami-lies and interspersed repetitive elements suggests a mech-anism for the creation and/or amplification of microsatellites and thus the presence of such microsatellite families, and clearly indicates that the behaviour and evolution of micro-satellite sequences can only be fully understood within a larger genomic context.
Experimental procedures Cleaning and extraction of sequences
Sequences from screening partial librariesMicrosatellite sequ-ence data were collected from 23 species, including 16 Lepidoptera and seven other insect species (two Diptera, two Coleoptera, two Trichoptera, one Hemiptera). For each species, all readable, microsatellite-containing, sequences resulting from one or more screenings of partial genomic libraries were analysed (Table 3). Microsatellites with motifs of 1– 6 bp were identified. For the motif of a single base at least eight, for all other motifs at least four uninterrupted repetitions were necessary to retain the sequence.
Sequences were edited by (1) replacing all characters other than ACGT by N; (2) by deleting the extremities if they contained more than two Ns in the 10 most extreme base pairs; and (3) by removing vector and adapter contamination if the sequence
pro-duced a BLAST hit (e = 1E-3) against the UniVec vector base of
NCBI (ftp://ftp.ncbi.nih.gov/pub/UniVec) or the adaptors/linkers used during microsatellite isolation.
GenBank microsatellite entriesAll microsatellite sequences of all insects were downloaded from GenBank (10 January 2006) and treated species by species, as described above.
Whole Genome Shotgun All contigs of WGS sequencing projects were downloaded from NCBI (www.ncbi.nlm.nih.gov/ Genomes; 21 October 2005) for 10 insect species [Lepidoptera: (1) Bombyx mori (data set A: ADDK01000001– 01066482, Xia
et al., 2004; data set B: BAAB01000001– 01213289, Mita et al.,
2004); Diptera: (2) Anopheles gambiae (AAAB01000001–
01069724, Holt et al., 2002), (3) Aedes aegypti (AAGE01000001–
01655164, The Institute for Genomic Research, Broad Institute,
http://msc.tigr.org/aedes/release.shtml), (4) Drosophila
mela-nogaster (AABU01000001–01002756, Celniker et al., 2002), (5)
Drosophila simulans (AAGH01000001–01025284, Drosophila
simu-lans Sequencing Consortium, Genome Sequencing Center at
Washington University School of Medicine in St Louis, http://
genome.wustl.edu/genome_group_index.cgi), (6) Drosophila
pseudoobscura (AADE01000001–01012826, Richards et al., 2005), (7) Drosophila yakuba (AAEU01000001– 01013569, Genome Sequencing Center at Washington University School of Medicine in St Louis, http://genome.wustl.edu/genome_group_index.cgi), (8) Drosophila persimilis (AAIZ01000001–01026813, Broad Institute, http://www.broad.mit.edu/tools/data/data-vert.html),
(9) Drosophila sechelia (AAKO01000001–01021425, Broad Institute, http://www.broad.mit.edu/tools/data/data-vert.html);
Hymenoptera: (10) Apis mellifera (AADG01000001– 01018946,
The Honeybee Genome Sequencing Consortium, 2006). If sequences contained more than 10 consecutive Ns, the Ns were cut out and the sequences were not joined together. Then, all microsatellites containing at least four repeat units of di-, tri-, tetra-, penta- and hexanucleotide motifs, or at least eight single nucleotide repeats, with 150 bp flanking sequence on each side were extracted. If flanking regions of different microsatellites were overlapping (i.e. when two microsatellites were separated by less than 300 bp flanking sequences), they were pooled into the same
sequence to avoid redundancy. Thus, we obtained short sequences with one or more microsatellites in each and 150 bp flanking sequence on each extremity. These were used for further analyses and we refer to each such entity as a ‘sequence’. In this way, 11 pools of sequences were obtained, one from each WGS data set. From each pool, 10 000 sequences were randomly selected for comparison of the flanking regions.
Complete genomes All microsatellites from the complete
genome of D. melanogaster (NT_037436, NT_033779,
NT_033778, NT_033777, NC_004354, NC_004353; 23 July
2005; Adams et al., 2000) and A. gambiae (NC_004818,
Table 3.Number of available sequences (n) and their accession numbers for each species from screening partial genomic libraries
Species Order n Accession nos References
Arctia caja Lepidoptera 86 AJ809344 – 809406 Anderson et al. (2006) AJ829727 – 829729
AJ867349 – 867385
Arhopala epimuta Lepidoptera 60 DQ380801– 380855 Fauvelot (2005) AY974048 – 974052
Busseola fusca Lepidoptera 63 AY884595 – 884602 Faure & Silvain (2005) DQ393596 – 393652
Bombyx mori Lepidoptera 37 DQ383475 – 383511 Reddy et al. (1999) AY566203
Coenonympha hero Lepidoptera 45 AF499094 – 499100 Cassel (2002) AY396747
DQ399357– 399393
Cydia pomonella Lepidoptera 87 AY640590 – 640613 Franck et al. (2005) DQ393893 – 393955
Drupadia theda Lepidoptera 81 DQ380724–380800 Fauvelot (2005) AY974054–974057
Euphydryas aurinia Lepidoptera 89 AY491782–491857 Péténian et al. (2005) Ostrinia nubilalis Lepidoptera 25 AY642971–642974 Coates et al. (2005)
DQ375208–375226
Parnassius apollo Lepidoptera 103 AY491858–491940 Péténian et al. (2005) Parnassius mnemosyne Lepidoptera 31 DQ373968–373998 Meglécz & Solignac (1998) Parnassius smintheus Lepidoptera 19 AF1333661–133364 Keyghobadi et al. (1999, 2002)
AY048082–048096
Polyommatus bellargus Lepidoptera 22 AF276048–276052 Harper et al. (2000, 2003) DQ396449–396465
Plutella xylostella Lepidoptera 127 DQ649107–649234 Unpublished Reissita simonyi Lepidoptera 35 AY250742–250755 Klutsch et al. (2003)
DQ406603–406623
Zale galbanata Lepidoptera 9 AF484811–484815 Caldas et al. (2002) DQ372958–372962
Aphis fabae Hemiptera 99 AY506847–506854 D’Acier et al. (2004) DQ295044–295055
DQ381847–381924
Amphitmetus transversus Coleoptera 44 AY430192–430197 Patt et al. (2004b) DQ419530–419568
Culex pipiens Diptera 24 AY423738–423745 Keyghobadi et al. (2004); Smith et al. (2005) DQ388481–388496
Culex quinquefasciatus Diptera 21 AY958073–958078 Keyghobadi et al. (2004); Smith et al. (2005) DQ388497–388511
Monolepta vincta Coleoptera 34 AY575862–575868 Patt et al. (2004a) DQ415989–416015
Plectrocnemia conspersa Trichoptera 66 AY634882–634887 Wilcock et al. (2001) EF068319–068376
Polycentropus flavomaculatus Trichoptera 29 AJ429150–429164 Dawson & Wilcock (2002) AJ810098–810101
AJ810103–810104 AJ810106–810107 AJ810109–810110 AJ810113–810116
NT_078265, NT_078266, NT_078267, NT_078268; 23 July 2005;
Severson et al., 2004) were extracted as described for WGS
sequences.
Sequence analyses
Sequences were analysed separately for each species and for each type of sequence origin (i.e. screening partial genomic librar-ies, GenBank entrlibrar-ies, WGS and complete genome). In this way we treated 23 data sets from screenings, 415 data sets from GenBank entries, 11 data sets from WGS and two data sets from complete genomes. Pure microsatellite repeat regions (as defined above) were replaced by Ns in order to examine only the flanking regions in the successive analyses. Each data set was blasted against
itself with e = 1E-40, thus all BLASTn results presented in this paper
represent only intraspecies comparisons. Sequences were sorted
into four categories based on the results of the BLASTn. They were
classified as: (1) Unique if no similarities were observed to any
other sequences of the same data set; (2) unBLASTable if sequence
had no hits at all, not even with itself (if the flanking region is too
short or repetitive, but not a perfect microsatellite, BLAST masks the
region; thus the sequence becomes uninformative and does not
align even with itself); or (3) Redundant, if the identity to another
sequence was higher than 95% along the whole flanking sequence. All nonredundant sequences that produced a signifi-cant hit with at least one different sequence were classified as (4)
Grouped. The proportion of grouped sequences was calculated
after eliminating unBLASTable and redundant sequences (e.g.
number of grouped sequences/(number of grouped sequen-ces + number of unique sequensequen-ces)). For the whole genome sequences, both the above procedure was applied as well as the same process without identifying ‘redundant’ sequences.
All these operations were conducted by Perl programs written by the first author (available upon request), MICROFAMILY (Meglécz,
2007), BLASTn-2.2.10 (ftp://ftp.ncbi.nih.gov/blast/executable/) and
CLUSTALW1.83 (Higgins et al., 1991).
Repetitive sequence banks We scanned all the sequences of
our data sets against databases of repetitive sequences of D.
mel-anogaster and A. gambiae in order to detect the presence of inter-spersed repetitive elements. This analysis was performed using the program RepeatMasker2 (A.F.A. Smit and P. Green, unpub-lished data, http://repeatmasker.genome.washington.edu/RM/ webrepeatmaskerhelp.html) and its databases using default sen-sitivity parameters. The proportion of grouped vs. unique sequences that showed similarities to repetitive elements were
compared by χ2 tests conducted by the R stats package, version
2.0.1 (R Development Core Team, 2004).
Comparison with baculovirus sequences All Lepidoptera
microsatellite sequence data sets were BLASTed against the 19
genomes of baculoviruses available in GenBank (downloaded 13 December 2005):
NC_007383.1, Trichoplusia ni SNPV virus;
NC_007151.1, Chrysodeixis chalcites nucleopolyhedrovirus;
NC_005137.2, Choristoneura fumiferana defective
nucleopolyhe-drovirus;
NC_004778.3, Choristoneura fumiferana MNPV;
NC_004117.1, Mamestra configurata nucleopolyhedrovirus B;
NC_003094.2, Helicoverpa armigera nuclear polyhedrosis virus;
NC_004690.1 Adoxophyes honmai nucleopolyhedrovirus;
NC_005068.1, Cryptophlebia leucotreta granulovirus;
NC_001962.1, Bombyx mori nucleopolyhedrovirus;
NC_002169.1, Spodoptera exigua nucleopolyhedrovirus;
NC_005038.1, Adoxophyes orana granulovirus;
NC_004156.1, Helothis zea virus 1;
NC_004062.1, Phthorimaea operculella granulovirus;
NC_003102.1, Spodoptera litura nucleopolyhedrovirus;
NC_002816.1, Cydia pomonella granulovirus;
NC_002654.1, Heliocoverpa armigera nucleopolyhedrovirus G4;
NC_001982.1, Helicoverpa armigera stunt virus RNA 2;
NC_001973.1, Lymantria dispar nucleopolyhedrovirus;
NC_001623.1, Autographa californica nucleopolyhedrovirus.
Acknowledgements
We thank the following people for valuable help at different stages of this work: Ludvig Ahrén, Céline Brochier, Mike Bruford, Etienne Danchin, Arnaud Estoup, Dina Fonseca, Paul Johnson, Bénédicte Nguyen-The, Gabriel Nève, and for two anonymous referees for providing ideas for future research. We greatly appreciate the sequencing effort done by the following consortia and providing prepublication release Whole Genome Shotgun data for public use: Broad Institute (http://msc.tigr.org/projects.shtml), Genome Sequ-encing Center at Washington University School of Medicine in St Louis (http://genome.wustl.edu/genome_group_index.cgi), Human Genome Sequencing Center at Baylor College of Medicine (http://www.hgsc.bcm.tmc.edu/)
References
Adams, M.D., Celniker, S.E., Holt, R.A. et al. (195 co-authors)
(2000) The genome sequence of Drosophila melanogaster.
Science287: 2185 – 2195.
Akagi, H., Yokozeki, Y., Inagaki, A., Mori, K. and Fujimura, T. (2001) Micron, a microsatellite-targeting transposable element
in the rice genome. Mol Genet Genomics266: 471– 480.
Anderson, S.J., Dawson, D.A. and Freeland, J.R. (2006) Isolation and characterization of highly polymorphic microsatellite loci
for the garden tiger moth Arctia caja (Lepidoptera: Arctiidae).
Mol Ecol Notes6: 104 –106.
Beckmann, J.S. and Soller, M. (1990) Toward a unified approach to genetic-mapping of eukaryotes based on sequence tagged
microsatellite sites. Bio-Technol8: 930 – 932.
Beckmann, J.S. and Weber, J.L. (1992) Survey of human and rat
microsatellites. Genomics12: 627 – 631.
Caldas, A., Hawthorne, D.J. and Barbosa, P. (2002) Isolation and
characterization of microsatellite markers from Zale galbanata
(Lepidoptera: Noctuidae) and amplification in other members
of the genus. Mol Ecol Notes2: 296 – 297.
Cassel, A. (2002) Characterization of microsatellite loci in
Coenonym-pha hero (Lepidoptera: Nymphalidae). Mol Ecol Notes2: 566 – 568. Celniker, S.E., Wheeler, D.A., Kronmiller, B., Carlson, J.W., Halpern, A., Patel, S. (2002) Finishing a whole-genome
shotgun: Release 3 of the Drosophila melanogaster euchromatic
genome sequence. Genome Biol 3(12): research0079.1–
0079.14.
Chakraborty, R., Kimmel, M., Stivers, D.N., Davison, L.J. and Deka, R. (1997) Relative mutation rates at di-, tri-, and
tetranucleotide microsatellite loci. Proc Natl Acad Sci USA
94: 1041–1046.
Coates, B.S., Hellmich, R.L. and Lewis, L.C. (2005) Polymorphic
CA/GT and GA/CT microsatellite loci for Ostrinia nubilalis
(Lep-idoptera: Crambidae). Mol Ecol Notes5: 10 –12.
Comeron, J.M. (2001) What controls the length of noncoding
DNA? Cur Opin Genet Dev11: 652 – 659.
Cory, J.S. and Myers, J.H. (2003) The ecology and evolution of
insect baculoviruses. Annu Rev Ecol Evol S34: 239 – 272.
D’Acier, A.C., Sembene, M., Audiot, P. and Rasplus, J.Y. (2004)
Polymorphic microsatellites loci in the black Aphid, Aphis fabae
Scopoli, 1763 (Hemiptera, Aphididae). Mol Ecol Notes4: 306 –
308.
Dawson, D.A. and Wilcock, H.R. (2002) Isolation of polymorphic
microsatellite loci in the net-spinning caddisfly, Polycentropus
flavomaculatus (Polycentropodidae). Mol Ecol Notes2: 514 – 517.
Dieringer, D. and Schlötterer, C. (2003) Two distinct modes of microsatellite mutation processes: Evidence from the complete
genomic sequences of nine species. Genome Res13: 2242 –
2251.
Edwards, Y.J.K., Elgar, G., Clark, M.S. and Bishop, M.J. (1998) The identification and characterization of microsatellites in the
compact genome of the Japanese pufferfish, Fugu rubripes:
Perspectives in functional and comparative genomic analyses.
J Mol Biol278: 843 – 854.
Elsik, C.G. and Williams, C.G. (2001) Low-copy microsatellite
re-covery from a conifer genome. Theor Appl Genet103: 1189 –
1195.
Epplen, C., Santos, E.M.J., Maueler, W., vanHelden, P. and Epplen, J.T. (1997) On simple repetitive DNA sequences and
complex diseases. Electrophoresis18: 1577 –1585.
Estoup, A. and Cornuet, J.M. (1999) Microsatellite evolution:
infer-ences from population data. In Microsatellites: Evolution and
Applications (Goldstein, D.B. and Schlötterer, C., eds), pp. 49 – 65. Oxford University Press, Oxford.
Fagerberg, A.J., Fulton, R.E. and Black, W.C. (2001) Microsatellite loci are not abundant in all arthropod genomes: analyses in the
hard tick, Ixodes scapularis and the yellow fever mosquito,
Aedes aegypti. Insect Mol Biol10: 225 – 236.
Faure, N. and Silvain, J.F. (2005) Characterization of eight
micro-satellite loci in the maize stalk borer Busseola fusca Fuller,
1901 (Lepidoptera: Noctuidae). Mol Ecol Notes5: 846 – 848.
Fauvelot, C. (2005) Isolation and characterization of
microsatel-lites in two tropical butterflies, Drupadia theda and Arhopala
epimuta (Lepidoptera: Lycaenidae). Mol Ecol Notes 5: 724 – 726.
Fisher, M.C. and Viney, M.E. (1996) Microsatellites of the parasitic
nematode Strongyloides ratti. Insect Mol Biol80: 221– 224.
Franck, P., Guerin, B., Loiseau, A. and Sauphanor, B. (2005) Iso-lation and characterization of microsatellite loci in the codling
moth Cydia pomonella L. (Lepidoptera, Tortricidae). Mol Ecol
Notes5: 99 –102.
Hancock, J.M. (1995) The contribution of slippage-like processes
to genome evolution. J Mol Evol41: 1038 –1047.
Hancock, J.M. (1999) Microsatellites and other simple sequences:
genomic context and mutational mechanisms. In
Microsatel-lites: Evolution and Applications (Goldstein, D.B. and Schlöt-terer, C., eds), pp. 1– 9. Oxford University Press, Oxford. Hardison, R.C., Roskin, K.M., Yang, S., Diekhans, M., Kent, W.J.,
Weber, R. (2003) Covariation in frequencies of substitution,
deletion, transposition, and recombination during eutherian
evolution. Genome Res13: 13 – 26.
Harper, G.L., Piyapattanakorn, S., Goulson, D. and Maclean, N. (2000) Isolation of microsatellite markers from the Adonis blue
butterfly (Lysandra bellargus). Mol Ecol9: 1948 –1949.
Harper, G.L., Maclean, N. and Goulson, D. (2003) Microsatellite markers to assess the influence of population size, isolation and demographic change on the genetic structure of the UK
butterfly Polyommatus bellargus. Mol Ecol12: 3349 – 3357.
Higgins, D.G., Bleasby, A.J. and Fuchs, R. (1991) CLUSTAL V:
improved software for multiple sequence alignment. Cabios8:
189 –191.
Hoekstra, R., CriadoFornelio, A., Fakkeldij, J., Bergman, J. and Roos, M.H. (1997) Microsatellites of the parasitic nematode
Haemonchus contortus: polymorphism and linkage with a
direct repeat. Mol Biochem Parasitol89: 97 –107.
Holt, R.A., Subramanian, G.M., Halpern, A., Sutton, G.G., Charlab, R., Nusskern, D.R. (2002) The genome sequence of the
malaria mosquito Anopheles gambiae. Science298: 129 –149.
The Honeybee Genome Sequencing Consortium (2006) Insights
into social insects from the genome of the honeybee Apis
mellifera. Nature443: 931–949.
Johnson, P.C.D., Webster, L.M.I., Adam, A., Buckland, R., Daw-son, D.A. and Keller, L.F. (2006) Abundant variation in
micros-atellites of the parasitic nematode Trichostrongylus tenuis and
linkage to a tandem repeat. Mol Biochem Parasitol148: 210–
218.
Karaoglu, H., Lee, C.M.Y. and Meyer, W. (2005) Survey of simple
sequence repeats in completed fungal genomes. Mol Biol Evol
22: 639 – 649.
Keyghobadi, N., Roland, J. and Strobeck, C. (1999) Influence of landscape on the population genetic structure of the alpine
butterfly Parnassius smintheus (Papilionidae). Mol Ecol8: 1481–
1495.
Keyghobadi, N., Roland, J. and Strobeck, C. (2002) Brief report – Isolation of novel microsatellite loci in the Rocky Mountain apollo
butterfly, Parnassius smintheus. Hereditas136: 247 –250.
Keyghobadi, N., Matrone, M.A., Ebel, G.D., Kramer, L.D. and Fon-seca, D.M. (2004) Microsatellite loci from the northern house
mosquito (Culex pipiens), a principal vector of West Nile virus
in North America. Mol Ecol Notes4: 20 – 22.
Kidwell, M.G. and Lisch, D.R. (2001) Perspective: transposable
elements, parasitic DNA, and genome evolution. Evolution55:
1– 24.
Klutsch, C.F.C., Misof, B. and Naumann, C.M. (2003)
Characteri-zation of microsatellite loci for Reissita simonyi (Rebel, 1899)
(Lepidoptera, Zygaenidae). Mol Ecol Notes3: 528 – 531.
Lander, E.S., Linton, L.M., Birren, B., Nusbaum, C., Zody, M.C., Baldwin, J. (2001) Initial sequencing and analysis of the human
genome. Nature409: 860 – 921.
Li, Y.C., Korol, A.B., Fahima, T., Beiles, A. and Nevo, E. (2002) Microsatellites: genomic distribution, putative functions and
mutational mechanisms: a review. Mol Ecol11: 2453– 2465.
Meglécz, E. (2007) MICROFAMILY (version 1): a computer program
for detecting flanking region similarities among different
micro-satellite loci. Mol Ecol Notes7: 18– 20.
Meglécz, E. and Solignac, M. (1998) Microsatellite loci for
Parnas-sius mnemosyne (Lepidoptera). Hereditas128: 179 –180. Meglécz, E., Péténian, F., Danchin, E., D’Acier, A.C., Rasplus, J.Y.
and Faure, E. (2004) High similarity between flanking regions of different microsatellites detected within each of two species
of Lepidoptera: Parnassius apollo and Euphydryas aurinia. Mol
Ecol13: 1693 –1700.
Metzgar, D., Bytof, J. and Wills, C. (2000) Selection against frameshift mutations limits microsatellite expansion in coding
DNA. Genome Res10: 72 – 80.
Michalakis, Y. and Veuille, M. (1996) Length variation of CAG/CAA
trinucleotide repeats in natural populations of Drosophila
mel-anogaster and its relation to the recombination rate. Genetics
143: 1713 –1725.
Mita, K., Kasahara, M., Sasaki, S., Nagayasu, Y., Yamada, T., Kanamori, H. (2004) The genome sequence of silkworm,
Bombyx mori. DNA Res11: 27 – 35.
Morgante, M., Hanafey, M. and Powell, W. (2002) Microsatellites are preferentially associated with nonrepetitive DNA in plant
genomes. Nat Genet30: 194 – 200.
Nève, G. and Meglécz, E. (2000) Microsatellite frequencies in
dif-ferent taxa. Trends Ecol Evol15: 376 – 377.
Patt, A., Misof, B., Wagner, T. and Naumann, C.M. (2004a)
Isola-tion and characterizaIsola-tion of microsatellite loci in Monolepta
vincta Gerstaecker, 1871 (Coleoptera, Chrysomelidae,
Galeru-cinae). Mol Ecol Notes4: 572 – 574.
Patt, A., Misof, B., Wagner, T. and Naumann, C.M. (2004b)
Char-acterization of microsatellite loci in Amphitmetus transversus
(Kolbe, 1897) (Coleoptera, Curculionidae). Mol Ecol Notes4:
188 –190.
Péténian, F., Meglécz, E., Genson, G., Rasplus, J.Y. and Faure, E. (2005) Isolation and characterization of polymorphic
micro-satellites in Parnassius apollo and Euphydryas aurinia
(Lepidop-tera). Mol Ecol Notes5: 243 – 245.
Prasad, M.D., Muthulakshmi, M., Madhu, M., Archak, S., Mita, K. and Nagaraju, J. (2005) Survey and analysis of microsatellites
in the silkworm, Bombyx mori: frequency, distribution,
muta-tions, marker potential and their conservation in heterologous
species. Genetics169: 197 – 214.
Pupko, T. and Graur, D. (1999) Evolution of microsatellites in the
yeast Saccharomyces cerevisiae: Role of length and number
of repeated units. J Mol Evol48: 313 – 316.
R Development Core Team. (2004) R: a Language and
Environ-ment for Statistical Computing. R Foundation for Statistical Computing, Vienna, Austria. URL http://www.R-project.org. Ramsay, L., Macaulay, M., Cardle, L., Morgante, M., degli
Ivanis-sevich, S., Maestri, E., et al. (1999) Intimate association of
microsatellite repeats with retrotransposons and other dispersed
repetitive elements in barley. Plant J17: 415 – 425.
Reddy, K.D., Abraham, E.G. and Nagaraju, J. (1999)
Microsatel-lites in the silkworm, Bombyx mori: Abundance, polymorphism,
and strain characterization. Genome42: 1057 –1065.
Richards, S., Liu, Y., Bettencourt, B.R., Hradecky, P., Letovsky, S.,
Nielsen, R. (2005) Comparative genome sequencing of
Dro-sophila pseudoobscura: Chromosomal, gene, and cis-element
evolution. Genome Res15: 1–18.
Rozen, S. and Skaletsky, H.J. (2000) Primer3 on the WWW for
general users and for biologist programmers. In Bioinformatics
Methods and Protocols: Methods in Molecular Biology
(Krawetz, S. and Misener, S., eds), pp. 365 – 386. Humana Press, Totowa, NJ.
SanMiguel, P. and Bennetzen, J.L. (1998) Evidence that a recent increase in maize genome size was caused by the massive
amplification of intergene retrotransposons. Ann Bot London
82: 37 – 44.
Schlötterer, C. (1998) Genome evolution: Are microsatellites really
simple sequences? Curr Biol8: R132 –R134.
Schug, M.D., Hutter, C.M., Wetterstrand, K.A., Gaudette, M.S.M., Mackay, T.F.C. and Aquadro, C.F. (1998) The mutation rates of
di-, tri- and tetranucleotide repeats in Drosophila
mela-nogaster. Mol Biol Evol15: 1751–1760.
Severson, D.W., Knudson, D.L., Soares, M.B. and Loftus, B.J.
(2004) Aedes aegypti genomics. Insect Biochem Mol Biol34:
715 –721.
Smit, A.F.A. (1999) Interspersed repeats and other mementos of
transposable elements in mammalian genomes. Cur Opin
Genet Dev9: 657 – 663.
Smith, J.L., Keyghobadi, N., Matrone, M.A., Escher, R.L. and Fon-seca, D.M. (2005) Cross-species comparison of microsatellite
loci in the Culex pipiens complex and beyond. Mol Ecol Notes
5: 697 – 700.
Solignac, M., Vautrin, D., Loiseau, A., Mougel, F., Baudry, E.,
Estoup, A., et al. (2003) Five hundred and fifty microsatellite
markers for the study of the honeybee (Apis mellifera L.)
genome. Mol Ecol Notes3: 307 – 311.
Temnykh, S., DeClerck, G., Lukashova, A., Lipovich, L., Cartin-hour, S. and McCouch, S. (2001) Computational and
experi-mental analysis of microsatellites in rice (Oryza sativa L.):
Frequency, length variation, transposon associations, and
genetic marker potential. Genome Res11: 1441–1452.
Tóth, G., Gáspári, Z. and Jurka, J. (2000) Microsatellites in
differ-ent eukaryotic genomes: Survey and analysis. Genome Res
10: 967 – 981.
van’t Hof, A.E., Zwaan, B.J., Saccheri, I.J., Daly, D., Bot, A.N.M. and Brakefield, P.M. (2005) Characterization of 28
micro-satellite loci for the butterfly Bicyclus anynana. Mol Ecol Notes
5: 169–172.
Wang, Z., Weber, J.L., Zhong, G. and Tanksley, S.D. (1994)
Sur-vey of plant short tandem DNA repeats. Theor Appl Genet88:
1– 6.
Weber, J.L. and Wong, C. (1993) Mutation of human short tandem
repeats. Hum Mol Genet2: 1123 –1128.
Widdel, A.K., McCuiston, L.J., Crans, W.J., Kramer, L.D. and Fon-seca, D.M. (2005) Finding needles in the haystack: Single copy
microsatellite loci for Aedes japonicus (Diptera: Culicidae). Am
J Trop Med Hyg73: 744 – 748.
Wilcock, H.R., Hildrew, A.G., Nichols, R.A. and Bruford, M.W.
(2001) Microsatellites for the net-spinning caddisfly
Plectroc-nemia conspersa (Polycentropodidae). Mol Ecol Notes 1: 318 –319.
Wilder, J. and Hollocher, H. (2001) Mobile elements and the
gen-esis of microsatellites in dipterans. Mol Biol Evol18: 384 – 392.
Xia, Q.Y., Zhou, Z.Y., Lu, C., Cheng, D.J., Dai, F.Y., Li, B. (2004) A draft sequence for the genome of the domesticated silkworm (Bombyx mori). Science306: 1937 –1940.
Zhang, D.X. (2004) Lepidopteran microsatellite DNA: redundant