44
s
*
c4
w i,
*
"0
*"
aellTi
Ti T
T
'T
*
*
*
*
*
* ** * * *~m *l*ow ** * n** 11 VO il *j 4 4' LIT * * *Y* V*olWoo * *OU *1 n *0Qlba
"T' ', , ;'j, - , , ' I I A , ,, eIL* wl T* -"AM F~j T' To'
~
~~~~ ~
' e -'Q Q Ig EN * 1 *T***A" ... * TI"' *Ti -'.1~*, *tT "hl ' 'OonTe--
I
- 0
A
1 j, Z- Q 17 : shNs" woo 1 eN e sLby
Hal L. Moses John R. Chappell
Tomas Goldberger
Research carried out under the Bureau of Ships Fundamental Hydromechanics Research Program,
S-R009 01 01, administered by the David Taylor Model Basin
Contract Nonr 1841(91)
GAS TURBINE LABORATORY
REPORT No. 81
September 1965
MASSACHUSETTS INSTITUTE OF TECHNOLOGY
ABSTRACT
An investigation of incompressible turbulent boundary layer
separation in internal flow is presented with experimental results
for a variable geometry, two-dimensional diffuser and two conical
diffusers. A simple analytical model is adopted, which consists of
wall boundary layers and a one-dimensional, inviscid core. Several
approximate boundary layer methods and the possibility of extending
them into the separated region are examined. With a limited amount
of separated flow, the calculated pressure agrees reasonably well with the experimental results and gives a fair indication of maximum
diffuser performance. The limitations of the model to the more general
problem, as well as the problem of singularities and downstream stability,
ACKNOWLEDGMENTS
This research was carried out at the Massachusetts Institute of Technology Gas Turbine Laboratory; Professor E. S. Taylor, Director.
Financial support was supplied by the Bureau of Ships Fundamental Hydromechanics Research Program, administered by the
David Taylor Model Basin.
The numerical calculations were performed with the aid of the M.I.T. Computation Center, and Mrs. Sally Wolf typed the report.
TABLE OF CONTENTS
Abstract
Acknowledgments ii
Table of Contents iii
List of Figures iv
Nomenclature v
I. Introduction 1
II. Experiments and Nature of Flow 2
A. Experimental Apparatus 3
1. Two-Dimensional, Variable-Angle Diffuser 3
2. Conical Diffusers 4
B. Experimental Procedure
5
C. Experimental Results 6
D. Nature of Stalled Flow 8
III. Analytical Model 9
A. Boundary Layer 9
1. Velocity Profiles 9
2. Integral Equations 12
3. Comparison of Methods Using Measured Pressure 17
B. One-Dimensional Pressure Assumption 18
C. Calculated Results 19
IV. Discussion 22
V. Conclusions 24
References 26
Table 1 - Diffuser Performance 28
Appendix 29
Figures 1-23
1)
2)3)
4)
5)
6)
7)
8)
9)
10)
11)
12)13) Pressure distribution,
distribution, distribution, distribution, distribution, distribution, distribution, distribution, 2-D diffuser, TAN b-D diffuser, TAN 2-D diffuser, TAN 2-D diffuser, TAN 2-D diffuser, TAN 2-D diffuser, TAN conical diffuser, conical diffuser, = .10, AR = -.15,
AR =
- .20, AR =.
.25,
AR
=
-.30, AR
=
..20, AR ==
60
=
7 1/20
1.75
-
2.0
1.5
-
2.5
1.75
-
3.0
2.0
-
3.0
2.0
-
3.0
2.0 - 3.0profiles, 2-D diffuser, TAN = .20, AR = 2.5
profiles, conical diffuser, % = 7 1/20
performance (two-dimensional)
LIST OF FIGURES
Two-dimensional, variable-angle diffuser Conical diffuser
Experimental pressure distribution, 2-D diffuser, TAN = .20, AR = 2.5
Boundary layer velocity profiles, 2-D diffuser, TAN = .20, AR = 2.5
Velocity contours, 2-D diffuser, TAN = 2.0, AR = 2.5
Velocity contours, conical diffusers
Model velocity profiles
Energy thickness factor vs shape factor
Momentum thickness and shape factor, based on measured pressure
Momentum thickness and shape factor, based on calculated pressure
Calculated pressure distribution, 2-D diffuser, TAN = .20, AR = 2.5
Calculated pressure distribution assuming non-symmetric flow
14)
15)
16)
17)
18)
19)
20) 21) 22) 23) Pressure Pressure Eressure Pressure Pressure Pressure Pressure Velocity Velocity DiffuserNOMENCLATURE
AR Diffuser area ratio
b Width of two-dimensional diffuser C Skin friction,^ V/ 2
C Pressure coefficient, ppU02
H Boundary layer shape factor, */O
H Boundary layer energy thickness factor, s**/
h Height of two-dimensional diffuser
L Length of two-dimensional diffuser
o Subscript for diffuser inlet conditions, x = 0
p Static pressure
R Reynolds number, U h/y
r Radius of conical diffuser
TAN Tangent of diffuser angle, 8
U Free stream velocity
u Mean velocity parallel to the wall
v Mean velocity normal to the wall
w Wake function
x Distance parallel to the wall
y Distance normal to the wall
a Boundary layer parameter, equations 2 and
3
a Boundary layer parameter, equations 2 and 3
5 Boundary layer thickness
6* Boundary layer displacement thickness
S** Boundary layer energy thickness
Q Boundary layer momentum thickness
Z Shear stress
I. INTRODUCTION
The problem of separation, both in internal flow and flow over submerged bodies, has been recognized for many years. The pressure rise in diffusers, and consequent danger of stall, was of interest in ancient Rome and is no less so today. In fact, the general problem of separation is of great practical importance in almost all devices that involve the flow of fluids.
Although many years of research have led to some understanding of
the phenomena as well as some approximate analytical work, the present
situation is far from satisfactory. For any fixed geometrical shape,
experimental results extended by similarity arguments are of great practical value, but the existence of an infinite number of possible
shapes severely limits this approach. On the other hand, the
non-linear equations of motion with the added complexity of separation and turbulence make the problem essentially unamenable to a completely analytical approach.
Much of the analytical work on the problem of separation has been confined to the development of approximate boundary layer methods, with
the pressure assumed known. However, it is now clear that in separated
flow the usual boundary layer theory alone is not sufficient; even in laminar flow attempts to predict separation have been fruitless. Further-more, in any real situation the determination of the pressure is an
essential part of the problem, especially when separation is involved. More recent research has been directed at the base pressure in
the separated region behind blunt bodies. Most of these investigations have been confined to the development of the shear layer and reattachment (or closure of the stalled region) with the upstream boundary layer known
valuable step, they must eventually be considered simultaneously with the usual boundary layer theory in treating the more general problem.
The simultaneous consideration of the free stream and the boundary layer, however, leads to a fundamental difficulty in incompressible fluid
mechanics. One of the great simplifications of the boundary layer equation
is its parabolic nature, which allows the solution to be carried out from a given point. On the other hand, the elliptic nature of the free stream equation requires complete boundary conditions, which include the complete boundary layer, in order to determine the pressure gradient at any point. As will be shown in this paper, this difficulty cannot be avoided by a
straight-forward iteration when separation is involved. Only in a very
few cases, such as relatively narrow internal passages, can the pressure be simply related to the boundary layer at a point, and then only
approx-imately.
The work presented here is a part of a general investigation of the growtU and separation of turbulent boundary layers (References 1-4).
Diffusing passages were considered because of their great practical importance and, although the flow itself is not simple, the approximate
model is. The main purpose of the work was to investigate the possibility of extending boundary layer methods to limited separated flow, with only
the geometry known.
II. EXPERIMENTS AND NATURE OF THE FLOW
A large amount of experimental work on internal flow with rising
pressure, or diffusers, has been reported (see References 5-12 and their
bibliographies, for example). Although detailed velocity measurements
were presented in some cases, much of the earlier work was concerned only with overall performance. The present experiments were conducted for the specific purpose of obtaining detailed measurements of the
amount of separated flow.
A. Experimental Apparatus
The experiments were conducted on a two-dimensional, variable angle diffuser, which was made unsymmetrical for simplicity in construction
of the movable wall. By limiting the separation to one of the diverging
walls, this construction also stabilized the flow to some degree. Because
of the inherent difficulties with corners in the two-dimensional apparatus,
two conical diffusers were later included in the investigation. Air was used as a working medium with an inlet (or throat) velocity of approx-imately 100 feet per second in both cases.
1. Two-Dimensional, Variable Angle Diffuser
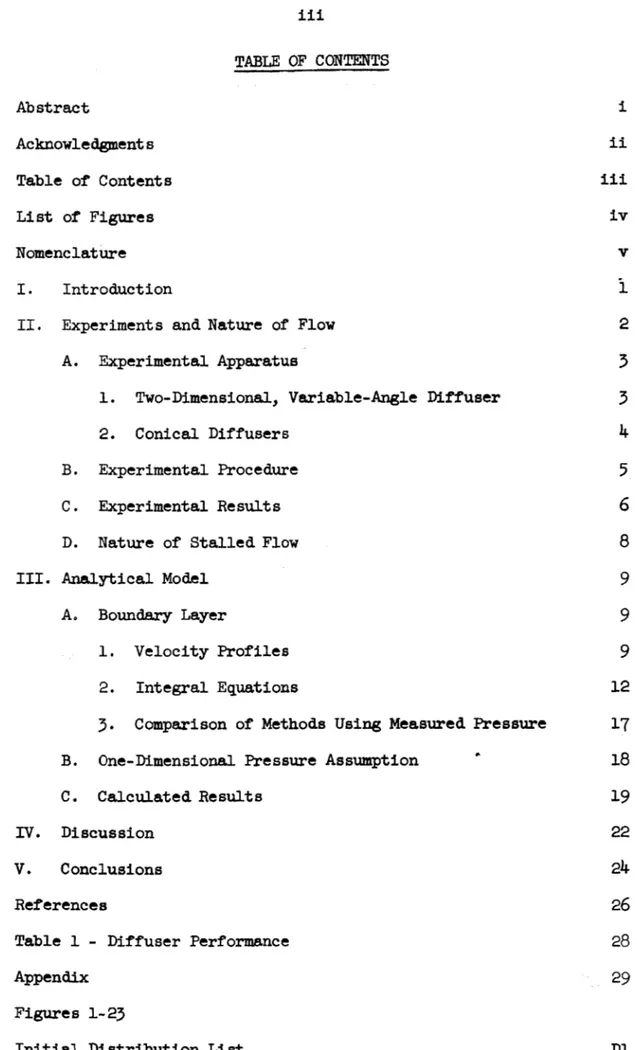
A schematic diagram of the two-dimensional apparatus is shown in Figure 1. The air was supplied by a 6000 CFM axial flow fan into a 30
inch diameter cylindrical plenum. After passing through a series of
screens, it was accelerated to the test section by a nozzle with a 5.5
centraction ratio. The width to height ratio at the throat was 6.85 and the throat height was 3.5 inches. Two constant area inlet sections of
12 and 24 inches in length were used.
The diffuser itself was built of 1/4 inch thick fiberboard reinforced
with metal angles. The bottom plate was adjustable to give area ratios
from 1.5 to 3.0, angles from 5 to 90 degrees and a maximum diffuser length of 35 inches. The diverging wall was hinged at the throat, giving a
reasonably sharp corner for the first experiments and later faired in with a flexible piece of plexiglass with a radius of approximately 2 to 3 inches. A 16 by 25 inch section of plexiglass was installed in the top wall for visual studies. The screen at the exit plane was used to
atmospheric pressure at the throat.
The static pressure taps were made of 1/2 inch diameter brass
plugs pressed into the fiberboard flush with the inside surface. The
static openings were .030 inch diameter holes drilled in the center of
the brass plugs. The pressure taps were spaced at 2 to 4 inch intervals
along the top and bottom centerline, in two vertical rows on the side
walls and in two additional rows 6 inches off the centerline on the
bottom wall, making a total of 43 taps. During the first experiments,
it was not feasible to install a static tap in the hinged joint, but
one was included in the flexible plexiglass.
Velocities were determined with a total pressure probe mounted on a micrometer traversing mechanism. Removable brass plugs for inserting the probe were located near each of the static taps. Both static and total pressures were read on an inclined oil manometer board.
2. Conical Diffusers
A schematic diagram of the conical diffusers is shown in Figure 2. Air was supplied by a 3000 CFM axial flow fan into an 18 inch diameter plenum with honeycomb and screens. The flow was controlled and unstead-iness eliminated by bleeding just upstream of the nozzle, which had a contraction area ratio of 20. The throat diameter was 4 inches, and the constant area inlet length was 12 inches.
Two conical diffusers were tested with half-angles of 6 and 7 1/2
degrees, both 15.4 inches long. The diffusers were made of fiberglass,
hand sanded to assure a smooth surface. Tests were conducted with and
without the perforated plate at the exit plane and also with a 2 feet
long constant area section downstream.
The static pressure taps were .030 inch diameter holes drilled in the fiberglass, leading into brass inserts. Care was taken to eliminate
any burrs in the small openings. Four rows of taps were located at 90 degrees around the circumference of the diffuser, spaced at 2 inch
intervals and beginning 4 inches upstream of the throat.
The velocities were measured with a total pressure probe inserted through the diffuser wall near the throat and also with a probe inserted from the exit plane, which could be rotated to any angular position. Both static and total pressures were read on an inclined oil manometer,
which had a total deflection of about 20 inches for the maximum velocity.
B. Eperimental Procedure
The experiments on the two- dimensiona4 variable geometry ,diffuser were conducted with three different inlet conditions:
1) 12 inch constant area section (91/ho = .008 at throat), inlet radius at the hinged joint approximately 1/8 inch.
2) 24 inch constant area section (91/h = .013), inlet radius
1/8 inch.
3) 12 inch constant area section (91/%0 = .007), inlet radius
&pproximately 2 to 3 inches.
The first series of experiments were concerned mainly with the
pressure distiribution an4 overall diffuser performance. These were
conducted with both constant area sections and the 1/8 inch inlet
radius. Twenty-one different geometries were tested, including bottom wall angles of 5.72 to 16.70 degrees and area ratios of 1.5 to 3.0. In these tests the static pressures were recorded at all points, but only
rough velocity traverses were made at three stations.
The second series of experiments were conducted with a bottom wall angle of 11.31 degrees and area ratio of 2.5 and with both inlet
radii. Since the objective was to obtain boundary layer measurements
pressure readings were made. Velocity profiles were determined mainly for the boundary layer on the centerline of the bottom wall, but
measurements were made throughout the diffusing section as far as
possible.
All experiments with the two conical diffusers were conducted with
a constant area inlet length of 13 inches, which resulted in a boundary
layer at the throat of 91/r = .012. Velocity traverses were made at
five ptations along the diffusers in a plane which included both the
stalled and Unstalled regions. Velocity contours were made for both
diffusers at x/r0 = 2. The results presented here were taken with the screen across the exit plane, which was necessary for the velocity probe used in the diffusing section. However, since this procedure might be questionable when comparing the results to diffusers under other
conditions, static pressures were also recorded with the diffuser exit discharging directly to the atmosphere and with a 2 foot long tail pipe.
C. Faperimental Results
The performance data and inlet conditions for all geometries tested
are listed in Table 1. The plotted results for pressure distributions
and velocity profiles are shown in Figures 3-6 and in comparison with
calculated results in Figures 9-22. An overall performance map is shown
in Figure 23 for the two-dimensional diffuser.
The experimental values for the pressure distributions in the
two-dimensional diffuser, Figures 3 and 11-18, are given in terms of C as
a function of distance along the top wall. Although the flow itself
was somewhat unsteady in some cases, the pressures as averaged by the
manometer were reasonably steady and reproducible. Typical experimental
values with separated flow are shown in Figure 3 (reproduced in Figures
tests. As can be seen, the pressure is reasonably one-dimensional or equal on the top, bottom and side walls except near the throat.
This corner effect was pronounced even with an inlet radius of 2 to 3 inches. In Figures 13-18 only the top wall pressures are shown in order to present several area ratios at the same bottom wall angle. These results show that the position of the bottom (or area ratio) has very little effect on the average upstream pressure, although the
transitory stall probably is affected to some extent. The effect of
the inlet boundary layer can be seen by comparison of Figures 15 and
18 and again on the performance map, Figure 23. The small difference
between Figures 3 and 15, with different inlet radii, is perhaps mainly
due to a slightly different inlet boundary layer.
The experimental pressure distributions for the two conical diffusers
are shown in Figures 19 and 20. Although four readings were taken at each
x-position, spaced 90 degrees around the diffuser, they were sufficiently
close to be plotted aa an experimental point. The plotted values were
recorded with the porous plate at the exit plane and with no total head probes in the diffuser; but very little difference was noticed under other conditions, except possibly at the last station.
Velocity profiles, Figures 4, 5, 21 and 22 were taken with total head probes using the wall static pressure. The velocity profiles in the bottom wall boundary layer along the two-dimensional diffuser
centerline are shown in Figure 4, and the corresponding Thomentum thickness and shape factor in Figure 9 (and 10). Complete profiles
for a centerline plane are given in Figures 21 and 22, where the
experimental points have been omitted for clarity. Velocity contours,
Figures 5 and 6, give some idea of the non-symmetrical flow. Close
accurate measurements were impossible due to the sensitivity required
and large relative fluctuations. Although the measurements were taken as carefully as possible, a reasonably large degree of approximation
must be admitted in this region for the velocity and corresponding boundary layer parameters.
The diffuser performance data, Table 1 and Figure 23, were based on the average static pressure at the exit plane, not including
the constant area section downstream. As can be seen from the figure,
the range of diffusers tested included the maximum performance angles
for the lengths considered. The maximum performance was obtained with
a limited amount of separated flow, as determined by velocity profiles
and visual studies. The large effect of inlet boundary layer indicates
one of the difficulties in attempting a direct experimental correlation
of diffuser performance.
D. Nature of the Stalled Flow
Although the general nature of stalled diffuser flow has been
recognized to some extent for several years, recent contributions by
Kline and others (References 12, 13, 14, 6 and 10) have greatly improved
the present understanding. Perhaps the major recent contributions in
this area have been due to visual studies and an improved description (and graphical representation) of the different types of flow.
In the present work visual studies were very limited because of the difficulties with air as a working medium. However, the results
were sufficient to indicate that the general behavior of the flow was
similar to the usual two-dimensional diffuser (Reference 12). As the
diffuser angle was increased the stalled region which first appeared
very limited in the bottom corners began to extend in a transitory
stalled region extended completely across the bottom and to some
degree on the side walls. Since the objective here was to study
limited separation near peak performance, fully stalled flow was not examined in detail.
III. ANALYTICAL MODEL
In view of the inherent complexity of the flow involving turbulent separation, any useful analytical model must be a great simplification
of the real situation. In fact, the entire process of turbulent mixing must be treated as an experimental phenomenon and based on a very
limited amount of experimental data when separation is involved. The
fact that only mean quantities are usually measured, or predicted, makes the attempted indirect correlation of the turbulent mixing both
difficult and questionable. Thus any simple analytical model, such as
the one presented here, should be viewed with caution. The
measure-ment of only mean quantities and the adoption of a two-dimensional,
steady model can be misleading with separation; the real flow, of
course, is neither two-dimensional nor steady. However, in order to
proceed past the direct experimental approach, some such model must be adopted.
A. Boundary Layer
The failure of usual boundary layer methods to predict separation reliably and the general nature of separated flow have led to some doubt
as to the value of the method in this area. Yet it seems clear that
any realistic model of flow separation must include the boundary layer. Furthermore, it seems reasonable to extend some type of boundary layer approach into the separated region, at least as a first approximation.
1. Velocity Profiles
the velocity profile in turbulent boundary layers by empirically determining a relation between gross parameters, it is not usually desirable. In order to extend the boundary layer approach into the separated region, the velocity profiles model must include the separated flow. However, since the velocity cannot be measured accurately near separation, the profile assumption cannot be based completely on experi-ment in this region.
Perhaps the simplest reasonable assumption for the velocity profile
in turbulent boundary layers is the power law:
u
=(pl/n
U (
where (1)
2
n =
However, the power law is only a rough approximation for the
attached boundary layer, and even more crude near separation. Yet, besides its great simplicity, the power law does have some desirable characteristics in separated flow, as will be seen later. Although no back flow is possible with this profile, a region of 'stalled' fluid does appear when H>3.
A more realistic assumption for the velocity profile should
include an inner wall region and an outer wake region. Indeed the
logarithmic velocity variation near the wall is one of the most consistent experimental findings in turbulent boundary layers.
Several such profiles have been proposed, but perhaps that suggested
by Coles (15) is better known and also one of the most reliable.
u
2.5 log
(
L
) +
5.1 +
2.5 Wrw
(p )
(2)
t
wCrf
Ut- -- = Up
2
By redefining the variables (Reference 2)
U
and approximating the wake function,
w
-2(32
- 3)Equation (2) can be written in a form more readily useful in
boundary layer theory:
u
= 1
+ olog
v
+
P
(1 - 3
2 + 2u)
(3)
By setting u = U at >. = 1 in Equation (2), the parameter 0
can be related tb oc and RS =
=e
log
(ex Ra) + 1.1237j -1 (4)Equations (2) and (3), however, become infinitely negative near the wall and should not be used in this region. Since the integral of Equation (3) is finite, the inner portion is sometimes neglected. Yet this procedure might be questionable, especially near separation and at low Reynolds numbers. Using the linear sublayer approximation plus a small contribution for the wake to be consistent with Equation (2) yields
=
(1
+0<log
;I + P) - (32 - 21)<>(5)
where
27.5/-Rs
Equations 3, 4 and 5 represent a two parameter family where the
parameters are related by the Reynolds number. One desirable feature
of this representation is that the skin friction, 2.= 2.
function of o<eand R ,
In order to use Equation (3) in flows involving separation,
the parameter P (Equation 4) must be redefined. At separation,
=
0, the derivative of 0 becomes infinite, and when
o<<K,
itself is not defined. Therefore, to extend Equation (3) to separated
flow without altering the attached profiles, 1 is defined:
3 =
oc
log
(Io<IRS
+ 1) + 1.1237]
-l
(6)
Although Equations
(5)
and (3) become identical at separation,
the joining point, 2ll, should be limited for numerical computation.
For this reason )l is defined:
S27-5
(7)
1 olR, +
27.5
The two velocity profile models are shown in Figure 7.
2.
Integral Equations
With either of the two preceding velocity profiles, which have
been extended to include the separated region, two unknowns are
involved:
the boundary layer thickness and one additional parameter.
By attaching significance to the integral parameters only as definitions,
it seems reasonable to also extend the usual integral methods of
determining the two unknowns.
By integration of the turbulent boundary layer equations,
x-momentum u -+ v;-u - +
-y-momentum
0 = -
-
(8
p by
-)y
continuity
(2-D)
-
+ ---
= 0
(axi-sym) ax)+ = 0
=
S
(1
-)
dy
C f ~ , 2
1/2 U
the well known1 momentum integral equation is obtained (Reference 16).
(2-D) do+ (H + 2) dy
(10)
(axi-sym) do+ (H + 2) 2 f ---d + (
d 2 ) 2
1/2 U
x
2
rd
2d
Although the last term in Equation (10), which accounts for the
Reynolds normal stress, is usually neglected in boundary layer
calculations, there is no general agreement as to its importance (see References 11 and 17, for example). An empirical correlation was included in Reference 2, but its effect was small compared to the present uncertainty in the turbulent shear stress, which is probably
a safe conclusion for any attached boundary layer. Because of the large fluctuations usually associated with separated flow, it is very
likely that these terms should eventually be included if time-averaged
equations are to be used. However, at present there is even greater
uncertainty in the turbulent shear stress and the pressure variation across the boundary layer, as well as the pressure itself when it
must be predicted, in separated flow. Furthermore, these large
fluctuations probably depend mainly on the overall flow conditions and can never be correlated with boundary layer parameters (which is
also true for the pressure variation across the boundary layer). Since no qualitative information is available for separated flow, Reynolds normal stress will be neglected in the present approximate
analysis.
Besides the shape factor, H, the skin friction, Cf, is introduced in Equation (10) as an additional unknown when the power-law profiles are used. Several empirical relations have been proposed, but perhaps one of the most widely used is that of Ludwieg and Tillmann (22),
which agrees reasonably well with that implied by the logarithmic
velocity profiles.
Cf
=
0.246 R -.268
10-.678H
(11)
Although Equation (11) does not decrease to zero or negative
values with separation, it is very small for large values of H.
With Equations (10) and (11) an additional integral equation is
needed to determine the two boundary layer parameters. The development
of a reliable auxiliary equation has been the primary objective of most recent turbulent boundary research, and several have been
proposed. Since these methods have been adequately described and
compared (References 18 and 19), only a representative group will
be considered here.
Most of the proposed auxiliary equations are obtained by one
of three general methods: integration of the moments (in u or y) of Equation 8, integration of Equation 8 across partial strips of the boundary layer, or by direct empirical correlation.
a. Moment of Momentum
The moment of momentum, which is derived by multiplying Equation (8) by y and integrating, has been used by several authors, using
both power-law and logarithmic velocity profiles (References 1,
17,
20
and 21 are examples).
With the power-law velocity profiles, this equation
can be written (for both axi-symmetric and two-dimensional flows)
9
=-H
(H+.)(H
2+ (H _ ) H
-(H+l)(H -l)
d
(12)
2
U(H -1 K
0~ptJ
2 9As with all approximate method, some experimental information for
the apparent, or turbulent, shear stress within the boundary layer must
be introduced.
Without attempting to determine the 'best' correlation,
that suggested
in Reference (1) will be used here.
dy = 0.06
(H1
0(13)
pU
(H+3)
QEquation (13) was derived by assuming that the apparent viscosity
is approximated in all cases by that at zero pressure gradient, using
the power-law profiles for the velocity derivative.
b. Energy Equation
The kinetic energy equation, or velocity moment, is derived by
multiplying Equation (8) by u and integrating. This equation, which
has been used by many authors, can be written for any velocity profile
(and for both axi-symmetric and two-dimensional flow):
9 (-
=
(H-1) A
-U
-
C
+
dy
dH d U d 2 U pU2
y
The energy thickness and second shape factor,
l,
are defined:
u(1 -
L)
dy
(15)
A
=
S**/Q
The parameter
f
is related to the other boundary layer parameters
through the velocity profiles. For the power-law, or any one parameter
family, it is only a function of H, but for the logarithmic profiles it
is also a weak function of the Reynolds number, RS (Figure 8).
- H
(power-law) =
3
-(16)
(logarithmic)
0 2 +.871
H(
+.095(17)
The shear stress integral in Equation (14), which is usually
called the dissipation function, must be determined from experimental
results. Perhaps one of the best known empirical relations, which
will be used here, is that suggested by Truckenbrodt (23).
S
- U
0.0056
R-6
(18)
0 pU
r1
9/
c.
Two-Layer Method
The method of dividing the boundary layer into two (or more) strips
is derived by integration of Equation (8)
(neglecting Reynolds normal
stresses) to y =
y
and y =u(y)
u dy -a
TVdy=
(19)
This form is particularly useful with complicated velocity profiles,
such as the logarithmic profile (References
2
and 24), but requires a
somewhat arbitrary choice of
y.
The present calculations were made
with the equations developed in Reference 2 using this method.
d.
Empirical Equations
Several strictly empirical auxiliary equations have been developed,
but none of the correlations actually included the separated region.
Although there is no justification for attempting to extend these
methods beyond the range of correlated data, the well known method
d
d
e4.68o(H
- 2.975)
d
I -2.035(H
23( - 1.2 (20)-.6(20)
U dx Cf
where the constants were determined using the Squire-Young skin
fric-tion equafric-tion
C
= .0576
log
1
(4.075
Re)
e.
Other Methods
Several other methods of obtaining an auxiliary equation, such
as satisfying
Equation (8) at a given point or by developing an
empirical correlation for the entrainment
of fluid into the boundary
layer, have been suggested.
However, these methods also depend mainly
on experimental results, and no attempt will be made to extend them to
separated flow.
Summary of Approximate Methods Considered
Method No. 1.
Power-law profile
-
moment of momentum
2. Power-law profile - energy equation
3.
Logarithmic profile
-
energy equation
4.
Logarithmic profile
-
two-layer method
5.
Empirical (von Doenhoff and Tetervin)
(Several other methods were also used, but the results were similar
to the above group).
3.
Comparison of Methods Using Measured Pressure
Before proceeding to the pressure calculations, the above methods
were compared with experimental results using the measured pressure
distribution (Figure
3).
The calculated and experimental values of
the momentum thickness and shape factor are compared in Figure
9.
The differences between experimental and calculated values of
the momentum thickness could be
due to one or more of the following
factors:
errors in experimental values (including initial values),
three-dimensional flow, Reynolds normal stresses (or unsteady flow), rough bottom wall or corner, errors in wall shear stress or H or
errors associated with the corner effect. All of these factors were examined as far as possible, but it was concluded that the
three-dimensional and corner effects were probably most important.
The difference between calculated and experimental values of the shape factor could also be due to one or more of the above factors.
However, the main cause of the discrepancy is very likely due to the approximate nature of the auxiliary equations, which must account for the difference between calculated results upstream of separation. Near and past separation singularities and downstream stability of
the equations must be considered, but discussion of these factors will be deferred to the general discussion.
B. One-Dimensional Pressure Assumption
The primary objective of the analysis was to calculate the
pressure distribution with limited separation and with only the
geometry assumed known. To this end an analytical model was adopted
consisting of boundary layers along the walls and an inviscid core,
or free stream. It was further assumed that the pressure, or free
stream velocity, was constant at any cross section of the diffuser. As shown in Figure 3, this assumption was justified reasonably well
experimentally for limited separation, except for the corner effect near the throat. This model also assumes that the pressure at any cross section depends only on the area and boundary layer displacement
thickness, and cannot be influenced by anything downstream. While
this is not true in general for incompressible flow, it does appear reasonable in this case (Figures 13-18).
From continuity and the definition of displacement thickness: b(ho - 2S *)
U=
00 (two-dimensional diffuser) (21)
U
0b(h
-2*
Equation (21) is based on the assumption of identical boundary
layers on the top and bottom walls and none on the end walls.
Calculations were also carried out with separate boundary layers on the top and bottom walls, both with and without end wall boundary
layers. The most general case considered, which corresponds to
Equation (21), can be written:
(b - 2 SE) (h - - *
)
_ ..E 0
OT
oB
(22)
U (b - 2*E) (h -g* )
where the subscripts E, T and B represent the end, top and bottom
wall boundary layers.
Equation (21) (and corresponding similar equations) were used in differential form, using = -9
2H
dx
+ 29dxU
-
(h-2HO)
1a-
d
(23)where
dh
= TAN '6in the diffusing section.
For conical diffusers the corresponding continuity equation can be written:
( 0 0) (24)
C. Calculated Results
Either of the boundary layer methods outlined above, along with the continuity, or free stream pressure equation, forms a complete
whether or not the boundary layers on different walls are considered
separately, the model results in 3, 5 or
7
simultaneous equations.A large number of calculations were made, using several different
methods under various conditions, but only those believed to be
significant will be presented here. The numerical computations
were carried out as outlined in the Appendix.
The calculated results for the momentum thickness and shape factor are shown in Figure 10, where the pressure was determined simultaneously
from Equation (23). As can be seen, the agreement between theory and
experiment is still not very good for the momentum thickness or shape
factor, but there is better agreement between the different methods.
Furthermore, no singularities appear and the solutions exhibit much greater downstream stability in H.
The calculated pressure distributions corresponding to the boundary
layer parameters in Figure 10 are shown in Figure 11. The agreement
between theory and experiment is reasonably good for some of the methods,
while others show decreasing pressure downstream of separation. One of
the simplest methods, the moment of momentum using power-law profiles, is apparently also one of the most reliable. Since the results were
similar to Figure 11 for the various methods under different conditions, only those calculated using Method No. 1 will be presented.
The results of considering the boundary layers on different walls separately are shown in Figure 12, as compared to the simple assumption
of symmetric flow with no end wall boundary layers. In the first case, the top and bottom walls were treated separately with a slightly thicker
inlet boundary layer on the bottom. As in the actual flow, this result
shows separation only on the bottom wall. Then, the end wall boundary
effect of diverging free streamlines along the end walls was also
determined. Although these improvements to the analytical model did
result in a more realistic description of the flow, they did not improve
the pressure calculation. Because of the approximation already involved,
only the pressure calculations based on symmetric flow with no end wall boundary layers will be considered further.
Figure 13 to 20 show the experimental and calculated pressure
distribution for all diffuser geometries tested. The calculated
results shown were made with Method No. 1. The moment of momentum
equation based on power-law profiles, with the assumption of symmetric
flow and no end wall boundary layers. For the results of Figures 13 to
17, the inlet boundary layer, 91//h, was .008; in Figure 18 %1/ho = .013.
Similar results for the two conical diffusers, where 91/ro = .012, are
shown in Figures 19 and 20. As might be expected, these results are in
very good agreement when there is no separation; and even when there is
a limited amount of separated flow, the calculations show reasonably good
agreement with the experiments. However, at larger angles the calculated
results become less reliable due to an analytical model that is no longer realistic.
The complete velocity profiles for a centerline plane in both the
two-dimensional and conical diffuser are shown in Figures 21 and 22. In
the two-dimensional case, Figure 21, the calculated results are based on separate boundary layers along the top and bottom walls.
Finally, the theoretical and experimental overall performance is
shown in Figure 23 for the two-dimensional diffuser. The results for
both inlet boundary layers are included. As can be seen, the maximum performance angles for the lengths considered have been reached in both
IV. DISCUSSION
In calculating the boundary layer development with a fixed pressure distribution, which is the usual procedure, the equations fail completely
near separation. The failure is apparently due to downstream instability
and singularities in some cases in the integral equations. An example of
the singularities, which are due to the choice of velocity profiles, can
be seen from the vanishing coefficient of dH/dx in the energy equation
(14) and Figure 8. The logarithmic profiles also result in singularities
in the moment of momentum and two layer methods at H > 3.1. (If the
sub-layer is neglected, the singularities appear at H > 2.2).
Although the singularity can be avoided by use of the power-law profiles (or by other methods) the equations still fail because of
"downstream instability" at separation. The term downstream instability
is sometimes used to describe the degree of amplification of small changes in upstream conditions, but in this case it means the possibility of
infinitesimal changes upstream producing finite changes downstream. An
example of this behavior can be seen by examining Equations (12) or (14)
for given values of R and d (Figure a).
Both values of H for which dH = 0 represent
equilibrium states (in a limited sense) but the
second case is unstable; small changes in H
0-H
-+cause a shift away from equilibrium. (A more
complete examination of downstream stability
should include the simultaneous variation of
Q, but the result is the same in this case). Figure a
A plot of H vs. ' for which dH = 0 (Figure 6) shows H to be multiple-valued for many approximate methods (Reference 18).
usually appears as a prediction of no separation at all on the calculated value of H increasing indefinitely
(see Figure 9). The singularity
either stops the calculation
completely or causes the value of
H to oscillate. In either case the
calculation cannot be continued. Figure b
The question now arises as to whether this behavior represents a
physical phenomena or is due to the approximations used in the numerical
solutions. Some degree of downstream instability and rapid increases in H are observable experimentally, but this is only related to the above
indirectly. The exact nature of the singularity and instability is
determined by the approximate method, but even laminar boundary layer calculations exhibit a singularity at separation and two equilibrium
solutions exist. The boundary layer assumptions of constant pressure
across the layer and small changes in the x-direction are not strictly valid at separation, but do not cause the singularity. Although all of
these factors are related, the main cause of the singularity and
down-stream instability is apparently the assumption that the pressure is
fixed independently of the velocity.
When the pressure is calculated simultaneously with the boundary layer, no singularity appears (this is possible with Equation 14 by a
vanishing right hand side). Downstream stability is brought about by
a reduced pressure gradient due to an increasing H (and 5*). In the
present model, as well as the actual case, this is due to the presence of a nearby wall. In general, the turning of the free stream has a
can be approximated easily in supersonic flow (Reference 25); just how it can be included in incompressible flow is not clear, but a direct
iteration is not possible.
The calculated pressure agrees reasonably well with the experiments
for a limited amount of separation, even when the agreement for 9 and H
are poor. This is to be expected since the boundary layer displacement
thickness is only a correction to the ideal flow and is small compared
to the height of the diffuser. With large amounts of separated flow the
analytical model fails, and the calculated pressure is no longer
reason-able. In particular, the logarithmic profiles result in a calculated
decrease in pressure past separation. This is due to an over-estimate
of the backflow for a given momentum and displacement thickness (A
similar effect has been noted for polynomial profiles in laminar flow
by Lees and Reeves (25)). However, the main difficulty in attempting
to predict the pressure for wide angle diffusers is due to the restriction of a one-parameter velocity profile and failure to account for a decrease
in pressure at the inlet. This results in an over-estimate of the
pressure rise to separation just downstream of the throat (Figures 16
and 17) .
V. CONCLUSIONS
Because of singularities and downstream instability in the boundary layer equations near separation, the solution cannot be continued when the
pressure is assumed fixed independently of the velocity. This fact
elimi-nates the possibility of a direct iteration of pressure and boundary layer
calculations when separated flow is involved.
By calculating the pressure simultaneously with the boundary layer,
with a suitable model for the separated flow it is possible to continue
choice of velocity profiles in the separated region.
Although the approximate model presented here yields reasonable results for relatively narrow diffusers with limited separation, more work is definitely needed. Several obvious improvements to the analyti-cal model might be made; but before any great improvement in the results
can be expected, a better understanding and empirical correlation of the
turbulent mixing is necessary. And in order to extend the method to the
more general case of external flow, some means of treating the pressure simultaneously with the boundary layer must be developed.
REFERENCES
1) Moses, H. L. - "Boundary Layer Separation - Preliminary Report"
-Gas Turbine Laboratory Report No. 68, M.I.T., May 1962.
2) Moses, H. L. - "The Behavior of Turbulent Boundary Layers in
Adverse Pressure Gradients" - Gas Turbine Laboratory Report
No. 73, M.I.T., January 1964.
3) Chappell, J. R. - "Separated Flow in Two-Dimensional Diffusers"
-M.S. Thesis, M.I.T., May 1964.
4) Goldberger, T. - "Boundary Layer Separation in Conical Diffusers"
M.S. Thesis, M.I.T., February 1965.
5) Sprenger, H. - "Experimental Investigation of Straight and Curved Diffusers" - Mitt. Inst. Aerodyn., Zurich (27), 1959, Switzerland
-Trans. and Issued, 1962, Ministry of Aviation, TIL/T.51 34.
6)
McDonald, A. T. and R. W. Fox - "Incompressible Flow in ConicalDiffusers" - Purdue Research Foundation, Tech. Report No. 1, September 1964.
7) Uram, E. M. - "The Growth of an Axisymmetric Turbulent Boundary
Layer in an Adverse Pressure Gradient" - Proc. of the 2nd Nat.
Congress of Applied Mechanics, U. of Michigan, June 1954.
8) Cockrell, D. J. and E. Markland - "A Study of Incompressible
Diffuser Flow" - Aircraft Engineering, Vol. 34, October 1963.
9) Henry, J. R., C. C. Wood and S. W. Wilbur - "Summary of Subsonic
Diffuser Data" - NACA Research Memo L56F05, October 1956.
10) Norbury, J. F. - "Some Measurements of Boundary Layer Growth in a Two-Dimensional Diffuser" - Trans. ASME, Jour. Basic. Engr.,
Vol. 81, No. 3, September 1959.
11) Rubert, K. F. and J. Persh - "A Procedure for Calculating the Development of Turbulent Boundary Layers under the Influence of
Adverse Pressure Gradients" - NACA TN 2478, 1951.
12) Kline, S. J., D. E. Abbott, and R. W. Fox - "Optimum Design of
Straight Walled Diffusers" - Trans. ASME, Jour. Basic Engr., Vol. 81, No. 3, September 1959.
13) Kline, S. J. - "On the Nature of Stall" - Trans. ASME, Jour. Basic
Engr., Vol. 81, No. 3, September 1959.
14) Dean, R. C., Jr. - "Separation and Stall" - Handbook of Fluid Mechanics, McGraw-Hill, ed. Streeter, 1961.
15) Coles, D. - "The Law of the Wake in the Turbulent Boundary Layer"
-Jour. Fluid Mechanics, Vol. 1, pp. 191-226, 1956.
16) Schlicting, H. - "Boundary Layer Theory" - trans. J. Kestin, McGraw-Hill, 4th ed., 1960.
17)
McDonald, H. and J. A. P. Stoddart
-
"On the Development of the
Incompressible Turbulent Boundary Layer"
-
Report No. Ae 225,
British Aircraft Corporation, Preston Division.
18)
Rotta, J. C.
-
"Turbulent Boundary Layers in Incompressible Flow"
-Progress in Aero. Sciences, Vol. II, pp. 1-220, Pergamon Press, 1962.
19)
Thomps9n, B. T. J.
-
"A Critical Review of Existing Methods of
Calculating the Turbulent Boundary Layer"
-
British Aero Research
Council., A. R. C. 26 109, F. M. 3492, August 1964.
20)
Tetervin, N. and C. C. Lin
-
"A General Integral Form of the
Boundary Layer Equation for Incompressible Flow with an Application
to the Calculation of the Separation Point of Turbulent Boundary
Layers" - NACA Report 1046, 1951.
21)
Granville, P. J.
-"A Method for the Calculation of the Turbulent
Boundary Layer"
-David Taylor Model Basin, Report 752, 1951.
22) Ludwieg, H. and
W.
Tillmann
-
"Investigation of the Wall Shearing
Stress in Turbulent Boundary Layers"
-
NACA TM 1285, 1950.
23)
Truckenbrodt, E.
-
"A Method of Quadrature for Calculation of the
Laminar and Turbulent Boundary Layer in Case of Plane and
Rotationally Symmetric Flow"
-
NACA TM 1379, 1955.
24) Libby, P. A., P.
0.
Baronti, and L. Napolitano - "Study of theIncompressible Turbulent Boundary Layer with Pressure Gradient"
-AIAA Journal, Vol.
2,
No. 3, March
1964.
25) Lees, L. and L. Reeves
-
"Supersonic Separated and Reattaching
Flows"
-
Cal. Tech., Firestone Flight Sciences Lab., Tech. Report
No.
3, 1963.
26)
von Doenhoff, A. E. and N. Tetervin
-
"Determination of General
Relations for the Behavior of Turbulent -Boundary Layers"
-
NACA
TABLE 1 Diffuser Performance
Two-dimensional diffuser, h
0=
3.5", b/h
0=
6.85,
Uo
=110 ft/sec
TAN~
0.10
it0.15
if it 5.72 it8.530
t
t
t
'0.20 11.310t
f"
f
"f
i
"0.25
14.030
i
f
I
t
0.30
16.700
t
"t
it
0.15
0.20
t
If
0.25
0.20
t
8.53 0
11.31P
f
ft
14-030
11.32
AR_
1.75
2.01.5
1.75
2.0
2.5
1.75
2.0
2.5
3.0
2.0
2.53.0
2.0
2.5
3.0
2.5
2.02.5
3.0
2.5
fQ/b
07.5
10.0
3.33
5.0
6.67
10.0
3.75
5.0
7.5
10.0
4.0
6.0
8.0
3.33
5.0
6.67
ior. 0
5.0
7.5
10.06.0
7.5
Q
1/ho
-008
f"
f
t
t
I
f
"1
It
t
t
"0
"t " "t "t.013
"t "t " ".007
(CM) exit
0.55
0.62
0.45
0-54
0.60
0.66
0-50
0.54
0-59
0.63
0.44
0.49
0.57
0.30
0.36
0.59
0.39
0-51
0.55
,0.40
.61
(2-3 inch inlet)
radius
Conical diffuser, r0 =
2",
U = 100 ft/sec6.00
7.50
AR
3.27
4.0
3.85
"t
.012
t
(CO) eit
0.63
o.61
APPENDIX - NUMERICAL CALCULATIONS
The numerical calculations were carried out on an I.B.M. 7094 computer,
as indicated in the following Fortran program for the two-dimensional
diffuser. The program shown is based on a second order Runge-Kutta
integration procedure, but a more elaborate procedure was also used with nearly identical results. The simultaneous equations were solved by a
programmed instruction, M = X51MEQ, where Fi, j is the coefficient matrix;
but this procedure is not necessary for only three equations.
The program was written to carry out calculations for several angles at different area ratios. A sub-routine that included several methods of
determining the shape factor was also used, but only Method No. 1 is shown
in the sub-routine here. Similar programs were used when the boundary
layers on different walls were treated separately with additional equations for the new variables.
The input variables are
K Number of area ratios
L Number of angles at each area ratio
M Number of steps between printouts
N Number of printouts
MN Number of different methods
AR(I) Area ratios
TANG(II) Tangent of total diffuser angles
Xl Initial value of X/h
DX Step size ( X/h )
TI Initial value of 0/h
HI Initial value of H
Ul Initial value of U/U
RH Reynolds number based on
C H= Hi U= Ul CP= U*U PRINT 7, XU 7 FORMAT (5X,3 DO 8 J=1,N DO 9 JJ=1,M RT= RH*T*U IF (RT-500.) 10 CONTINUE CALL DER (II TA= T+DT*DX HA= H+DH*DX UA= U+DU*DX RT= RH*TA*UA IF (RT-500.) 11 X= X+DX
CALL DER (II T= (T+TA+DT* H= (H+HA+DH*
IF (H-20.) 9 9 U= (U+UA+DU*
2D DIFFUSER# SYMMETRICAL, NO END WALLS DIMENSION AR(5), TANG(10)
READ 1, KLMqNMN
I FORMAT (513)
READ 2, (AR(I), I=1,K)
2 FORMAT (5F5.2)
READ 3, (TANG(II), II=19L)
3 FORMAT (10F5.3) READ 4, X1,DXTiH1,U1,RH FORMAT (5F7.5,F1O.0) DO 5 I=1.K ARD= AR(M) DO 5 II=1,L TAN= TANG(II) DO 5 III=1,MN PRINT 69 III,TAN,ARDRH 6 FORMAT (16H1 2D DIFFJSER,6X,16HMETHOD 1 8X,7H TAN = ,F6.3,6X,6HARD = ,F5.2,6X,
2 8X .2H X 11X .1HU ,1OX,2HCP ,11X, 1HT , 1 IX, X= Xi T= TI gCrTgH (Ft.3,4X) F8.5,4XF8.3) 5910910 ITANARDRT,X,T,H,U,DTDHDU) 5,11,11 ITANARDRT,X,TAHAUADTDHDU) DX)*5 DX)*5 '5,5 )X )*. 5 CP= U*U PRINT 7, XUCP,T,H CONTINUE CONTINUE CALL EXIT END
DER SUBROUTINE, 2D, SYMMETRUCAL, NO END WALLS SUBROUTINE DER (IIITANARDRT,X,T,H,U,DTDHDU) DIMENSION F(3,3), G(3,1), E(3) CF= .246/(RT**.268*10.0**(.67E*H)) CD= *0056/(RT**.1667) DHTH= 0.0 NUMBER = 913,// 5HRH =F8.0,// 1HH //) 8 5 C
HTH= 1.0 IF (X) 21,2192? 22 HTH= 1.0 + X*TAN IF (HTH-ARD) 23,24924 23 DHTH= TAN GO TO 21 24 HTH= ARD 21 F(1,1)= 1.0 F(1,2)= 0.0 F(193)= (H+2.0)*T/U G(191)= CF*.5 F(291)= 2.0*H F(292)= 2.0*T F(293)= -(HTH-2.0*T*H) G(2,1)= DHTH F(3,1)= 0.0 28 F(392)= 2.0*T/(H*(H+1. F(393)= (H+1.0)*T/U G(391)= CF - 1.0*(H-1. 25 C= 1. M= XSIMEQF(3#391,FG.C DT= F(1,1) DH= F(2,1) DU= F(3,1) RETURN END 0)*(H-1.0)) 0)*.120/(H*(H+3.0)*RT**.1)
K N U-P
U
0
ho fi 0 x Static tans Y Pitot tube Discharge screen L '3 Movable wallsFigure 1. VARIABLE DIFFUSER
Al
4-
PerforatedI gt
Removable section L
Figure 2. CONICAL DIFFUSER
/
Pitot
tube
TAN t =. 20 AR = 2.5 0/hO =.007 1.0
0 Bottom wall v Top wall
0 Side walls
8 Bottom wall (different test) Experiment Calculated (Ideal)
.6
1- CCp.4
.20
-2 0 2 46
8
10 12 14 X/ho EXPERIMENTAL PRESSURE DISTRIBUTIONTAN I =. 20 AR = 2.5 0/ho = .007
Bottom Wall Boundary Layer
/ / X 5.15 00 0 4.0 0 ZI 0 2. db
/0
0 0 0 1. 45 07.86
cf 01 O- ecCo l.I/
.2.4
.6
Experimental Velocity Profiles
1.2 1.0 Y (inches)
.6
.4
.2 07,
.8 1-0 u/U Figure 4.X/h = 2.7
-0---u/U .99
u/U .50
--- - u/U 0 (separated flow)
X/h = 5.0
TAN t = .20 AR = 2.5 a /h = .008
Figure 5. VELOCITY CONTOURS, TWO DIMENSIONAL DIFFUSER
-0--b
b) 8 ~1 00S.99
~-50
~~ 0 (separated region) 2*Figure 6. VELOCITY CONTOURS, CONICAL DIFFUSER X/h 0= 2
u/U u/U
-.2 0 . 24