Agronomie numéro 0-2010
LEAF SENESCENCE AND CARBON ISOTOPE DISCRIMINATION IN DURUM WHEAT
(Triticum durum Desf.) UNDER SEVERE DROUGHT CONDITIONS
M. Hafsi
1,, J. Akhter
2, P. Monneveux
31
Université Ferhat Abbas, Sétif, Département d’Agronomie, Faculté des Sciences de la nature et de la vie ,Algeria
2
Nuclear Institute for Agriculture and Biology, Faisalabad, Pakistan
3
International Maize and Wheat Improvement Center (CIMMYT), Mexico City, Mexico
Corresponding author:
hafsimiloud@yahoo.com
Résumé: Les relations entre la senescence foliaire, la discrimination isotopique du carbone et la performance du
rendement, sont examinées chez le Blé dur (Triticum durum Desf.), au niveau des hautes plaines sétifiennes. Dix
variétés de Blé dur à haut potentiel ont été conduits durant deux saisons agricoles successives caractérisées par une
faible pluviométrie (217 et 162 mm, respectivement), des températures gélives au stade épiaison et un stress
thermique en fin de cycle. La sénescence a été évaluée par le traitement numérique de l’image (NIA). La
discrimination isotopique du carbone de la feuille drapeau a été analysée pour les différentes variétés aux stades
anthèse et maturité du grain respectivement. La sénescence a été corrélée significativement et négativement au
rendement grain pour la première saison mais pas pour la deuxième. Il n’y a pas eu de relations significatives entre
Δ et le rendement pour les deux saisons. L’absence d’association entre Δ (la discrimination isotopique du carbone)
et le rendement grain est probablement dû à une forte contribution des assimilats au rendement au stade pré-anthèse
avec une limitation du puits (fertilité de l’épi).
Mots clés : discrimination isotopique du carbone, sécheresse, sénescence, blé dur (Triticum durum Desf.)
Abstract: The relationships between leaf senescence, carbon isotope discrimination and yield performance were
examined in durum wheat (Triticum durum Desf.), in the high plains of Setif, eastern Algeria. Ten CIMMYT
high-yielding cultivars were grown during two cropping seasons characterized by low rainfall (217 and 162 mm,
respectively), freezing temperatures at heading stage and terminal heat stress. Senescence was assessed using
numerical image analysis (NIA). Carbon isotope discrimination was analyzed in flag leaves at anthesis and grain at
maturity. Senescence was significantly negatively correlated to grain yield in season 1, but not in season 2. There
was no relationship between Δ and grain yield in both seasons. The absence of association between Δ and grain
yield is likely to be due a strong contribution of pre-anthesis assimilates to yield together with a sink limitation of
yield.
Agronomie numéro 0-2010
Introduction
Crop productivity in wheat is mainly related to
photosynthetic activity, total leaf area, and leaf green
area duration. Under drought conditions, photosynthetic
activity and duration are strongly limited by reduction of
stomatal conductance (Morgan et al., 1993) and
premature leaf senescence (Pajević et al., 1999),
respectively. Slow rates of senescence were found to be
associated to higher yield in wheat by Rawson et al.
(1983) and Ellen (1987). In some studies, however,
quick senescence increased kernel weight and grain
yield of wheat (Yang et al., 2001). Senescence is
coupled with remobilization (Yang et al., 2001) that in
some cases highly contributes to maintain grain yield
(Gebbing and Schnyder, 1999). Senescence rate in
wheat is particularly sensitive to water stress (Guo et al.,
1998; Mi et al., 1999) and heat stress (Paulsen, 1994).
Genetic variation for this trait has been reported in
durum wheat (Triticum durum DESF.) (Hafsi et al.,
2000). Evaluation of senescence still remains difficult.
Progression of senescence from the tip to the base of the
blade is heterogeneous and visual evaluation of the
percentage of leaf affected by senescence consequently
inaccurate. Dymond and Trotter (1997) and Clarke
(1997) used digital cameras to assess crop greenness.
Adamsen et al. (1999) developed this method to measure
the senescence of wheat canopies. Hafsi et al. (2000)
modified the technique to evaluate senescence of wheat
leaves.
Under terminal (post-anthesis) water stress, wheat yield
is associated with the capacity of the plant to maintain
CO
2assimilation (Morgan et al., 1993). Under field
conditions a wide range of environmental factors and
their interactions make difficult to detect genetic
variation for this trait. Isotopic methods represent an
alternative to gas exchange measurements. In C
3plants,
carbon isotope discrimination is a good long-term
indicator of stomatal conductance and transpiration
efficiency (Farquhar et al., 1989). In Mediterranean
environments, higher yield is generally associated to
high grain ∆ (Araus et al., 1998; Hafsi et al., 2001;
Merah et al., 2001b; Monneveux et al., 2005), and under
severe stress, to leaf ∆ (Hafsi et al., 2001). The
objectives of the present study were to investigate the
variation in the association between yield, senescence
and carbon isotope discrimination under the strong stress
conditions of the High-Plateaux of Eastern Algeria.
Material and Methods
Plant material and growth conditions
The study was conducted at experimental fields of the
Institut Technique Moyen Agricole (ITMA) of Sétif (5
o21' W, 36
o9' S, 1123 m above sea level), Eastern
Algeria, during two successive cropping seasons
(2001-2002 and (2001-2002-2003). Ten durum wheat cultivars (Table
1) were grown in randomized block design with two
replicates. Plots were 10 m x 4 rows with 18 cm row
spacing and interplant space of 3 cm. Sowing density
was adjusted to 300 g m
-2. Sowing was done on
December 5 in season 1 (2001-2002) and November 24
in season 2 (2002-2003) while harvesting in both
seasons was carried out on June 25. The soil at the
experimental site is a rendzin, mollisol (Calcixeroll
USDA) up to 0.6 m in depth, containing low organic
matter. P (superphosphate 100 kg ha
-1) and K (100 kg
ha
-1were applied to all plots before sowing, while N
(urea 150 kg ha
-1) was applied at tillage to all plots.
Weeds were removed manually as and when required.
Agronomie numéro 0-2010
Table 1. Brief description of the ten genotypes used in the study
Cultivar
Name
Information
1
Mexicali
CIMMYT cultivar, released in 1975
2
Sooty9/Rascon57
CIMMYT advanced line
3
Nacori
CIMMYT cultivar, released in 1997
4
Waha
CIMMYT/ICARDA line (Sham 1) released in 1986
5
Tilo1/Lotus4
CIMMYT advanced line
6
Yavaros
CIMMYT cultivar, released in 1979
7
Altar
CIMMYT cultivar, released in 1984
8
Dukem12/Rascon21
CIMMYT advanced line
9
Kucuk
CIMMYT cultivar, released in 1984
10
Cado/Boomer33
CIMMYT advanced line
Measurements
The number of days to sowing to heading (DH) was
recorded. At maturity 20 spikes were randomly
collected and threshed manually to obtain the number
of grain per spike (NGS). Grain yield (GY) was
determined from a 2.88 m
2central area. Thousand
kernel weight (TKW) was determined from
sub-samples taken from harvested grains of each plot.
Leaf senescence was evaluated by numerical image
analysis (NIA) according to Hafsi et al. (2000). Four
leaves per cultivar were sampled at 300
oC day after
anthesis and immediately photographed on a black
surface between 11:00 and 12:00 solar time with a
color digital camera (Sony SSC-C108P, Kyoto,
Japan). Images were stored in a JPEG (Joint
Photographic Expert Group) prior to downloading
onto a PC computer and analyzed using IPP (Image
Pro Plus, Version 4, Media Cybernetics, Silver
Spring, MA, USA) software. Senescence was
expressed as the ratio of senesced area to total leaf
area (in per cent).
At anthesis, twenty flag leaves were randomly
detached from each plot and oven dried at 80 °C for
48 h. After harvest 10 g of grain were collected from
each plot. Leaf and grain samples were ground to a
fine powder and composite samples from two
replicates was used for carbon isotope composition.
The C isotopic ratio (R=
13C/
12C) of samples (R
sample)
and standard (R
standard) was determined using an
isotope ratio mass spectrometer in the Seibersdorf
laboratory of the International Atomic Energy
Agency (IAEA), Vienna, Austria. R values were
converted to (in ‰) using the relation:
C (‰) =
[R
sample/R
standard-1] x 1000. Carbone
isotope
discrimination (∆) values were calculated as ∆ (‰) =
(
C
a-
C
p) /(1 -
C
p/1000) (Farquhar et al.,
1989), where
aand
prepresent air and plant,
respectively.
Data were analyzed using SAS, version 8.1. (SAS
Institute 1987, Cary, NC, USA). GLM procedure was
used for variance and correlation analysis.
Results
Rainfall was higher in season 1 (217 mm) than in
season 2 (162 mm). In season 1, most of the
precipitation (80%) occurred during early growth
period (December and January), well before anthesis
(Fig. 1). Conversely, in season 2, rainfall was
distributed evenly during months of January,
February and March, near or shortly before anthesis.
Season 1 was also characterized by high temperatures
during the post-anthesis period and by low minimal
spring temperatures, with negative (freezing)
temperature occurring during the heading period. GY
was affected significantly by season and season x
genotype interactions (Table 2). Genotype effect on
GY was significant in season 2 but not in season 1.
Agronomie numéro 0-2010
Mean GY in season 2 was significantly higher than in
season 1 (Table 3). In season 1, NGS was particularly
low and significantly correlated to GY.
Mean leaf senescence was 73% higher in season 1
than in season 2. The two old cultivars Mexicali and
Yavaros showed strong decreases, while the other
eight cultivars showed increases in leaf senesence in
season 2, compared to season 1. In season 1 average
senescence of the five top yielding genotypes
(Kucuk, Altar, Sooty9/Rascon57, Yavaros and
Tilo1/Lotus4) was less than 45%, while in season 2
the five top yielding cultivars (Yavaros, Waha,
Tilo1/Lotus4, Dukem12/Rascon21 and Mexicali) had
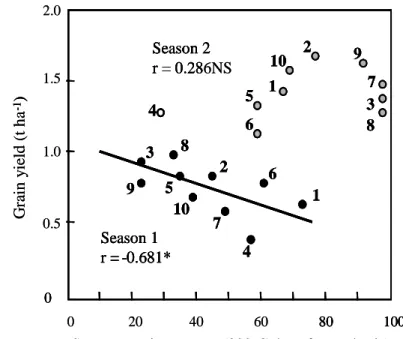
more than 65% leaf senescence. Senescence was
significantly and negatively correlated with grain
yield in season 1, but not in season 2 (Fig. 2).
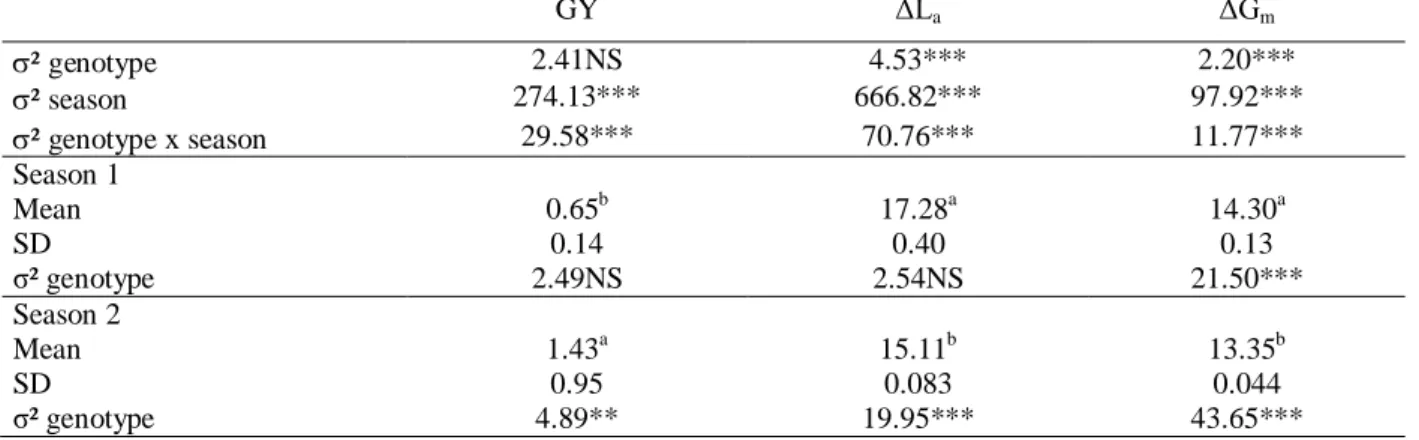
Highly significant effects of genotype, season and
genotype x season were found on leaf and grain
carbon isotope discrimination. ΔL was 20.0 and
14.3% higher than ΔG in season 1 and 2, respectively
(Table 5). Mean ΔL and ΔG were significantly higher
in season 1 than in season 2. There was no
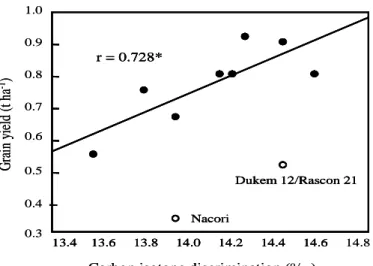
relationship between ΔG and grain yield. However, a
significant positive correlation was noted in season 2
by eliminating the cultivars Nacori and
Dukem12/Rascon21 that had the lowest yields (Fig.
3).
Discussion
Effects of climatic conditions on yield, senescence
and carbon isotope discrimination
Lower GY and higher senescence rates in season 1
compared to season 2 may be attributed to climatic
conditions (rainfall and temperature). Sharp increase
in temperature during grain filling stage in season 1 is
likely to have accelerated senescence. Lower grain
yield is probably the consequence of a lower grain
setting caused by freezing at heading and drought and
high temperatures around anthesis. The low number
of grains per spike and its strong correlation with
grain yield in season 1 supports this hypothesis. ΔL
was significantly higher in season 1 than in season 2.
Leaf Δ is mainly controlled by stomatal opening
(Farquhar and Richards, 1984) and consequently
largely determined by pre-anthesis conditions that
allow to maintain high stomatal conductance
(Morgan et al., 1993). More water supply due to
higher rainfall in early growing season 1 may have
led to higher stomatal conductance and consequently
higher leaf Δ.
Table 2. Variance analysis, mean and standard-deviation (SD) for grain yield (GY), leaf carbon isotope
discrimination in flag leaf at anthesis (ΔL
a) and in grain at maturity (ΔG
m)
GY
ΔL
aΔG
mσ² genotype
2.41NS
4.53***
2.20***
σ² season
274.13***
666.82***
97.92***
σ² genotype x season
29.58***
70.76***
11.77***
Season 1
Mean
0.65
b17.28
a14.30
aSD
0.14
0.40
0.13
σ² genotype
2.49NS
2.54NS
21.50***
Season 2
Mean
1.43
a15.11
b13.35
bSD
0.95
0.083
0.044
σ² genotype
4.89**
19.95***
43.65***
*** significant at P = 0.001; NS, non significant; mean values on the same column without a common letter are
significantly different (P < 0.05) according to the Duncan comparison test.
Agronomie numéro 0-2010
Table 3. Average value and correlation with yield for number of grains per spike and thousand kernel weight
in season 1 and season 2
Number of grains per spike
Thousand kernel weight (g)
Season 1
Mean
10.62
a36.00
aCorrelation with grain yield
0.860***
0.373NS
Season 2
Mean
16.52
b34.39
aCorrelation with grain yield
0.600NS
0.624*
NS, non significant; Mean values on the same column without a common letter are significantly different (P < 0.05)
according to the Duncan comparison test.
Table 4. Variation of carbon isotope discrimination in flag leaf at anthesis (ΔL
a) and in grain at maturity
(ΔG
m) and correlation with grain yield in seasons 1 and 2.
∆L
a∆G
mSeason 1
Mean
17.16
a14.30
aCorrelation with grain yield
-0.065NS
0.147NS
Season 2
Mean
15.21
b13.31
bCorrelation with grain yield
-0.518NS
0.061NS
NS, non significant; Mean values on the same column without a common letter are significantly different (P < 0.05)
according to the Duncan comparison test.
Fig. 1. Climatic conditions during
Fig. 2. Relationship between senescence the two cropping
seasons
and grain yield (seasons1 and 2)
0 10 20 30 40 50 60 70 80 0 5 10 15 20 25 30 35 40 0 10 20 30 40 50 60 70 0 5 10 15 20 25 30 35 R ai n fal l (mm ) M ean t em p er at u re s ( o C ) Months
Nov Dec Jan Feb Mar Apr May June 0 10 20 30 40 50 60 70 80 0 5 10 15 20 25 30 35 40 0 10 20 30 40 50 60 70 0 5 10 15 20 25 30 35 R ai n fal l (mm ) M ean t em p er at u re s ( o C ) Months
Nov Dec Jan Feb Mar Apr May June
0 0 20 40 60 80 100
1
4
6
7
2
10
5
8
3
9
4
6
5
1
10
2
9
7
3
8
Senescence in per cent (300
oC day after anthesis)
G
ra
in
y
ie
ld
(
t h
a
-1)
Season 1
r = -0.681*
Season 2
r = 0.286NS
2.0 1.5 1.0 0.5 0 80 1001
4
6
7
2
10
5
8
3
9
4
6
5
1
10
2
9
7
3
8
-1)
Season 1
r = -0.681*
Season 2
r = 0.28
0 0 20 40 60 80 1001
4
6
7
2
10
5
8
3
9
4
6
5
1
10
2
9
7
3
8
Senescence in per cent (300
oC day after anthesis)
G
ra
in
y
ie
ld
(
t h
a
-1)
Season 1
r = -0.681*
Season 2
r = 0.286NS
2.0 1.5 1.0 0.5 0 80 1001
4
6
7
2
10
5
8
3
9
4
6
5
1
10
2
9
7
3
8
-1)
Season 1
r = -0.681*
Season 2
r = 0.28
Agronomie numéro 0-2010
Fig. 3. Relationship between grain carbon isotope discrimination and grain yield in season 2
The higher difference in Δ between leaf and
grain in season 1 (2.4 ‰) compared to season
1 (1.9 ‰) is in good accordance with the
strong stress experienced by the crop after
anthesis. The significantly higher grain Δ in
season 1 is probably related to a higher
contribution to grain filling of C products
having high Δ values. Grain Δ is influenced
both by stomatal conductance and
re-mobilization from vegetative parts of the plant
(Hannachi et al., 1996; Hafsi et al., 2001;
Merah et al., 2001b). The contribution of
re-mobilization dramatically increases with
drought (Loss and Siddique, 1984). Products
filling the grain are likely to be originated
from vegetative organs and, having been
synthesized under optimal conditions, have a
higher Δ. Slafer and Araus (1998) and Royo et
al. (1999) also suggested that Δ under severe
terminal drought is defined early in the crop
cycle, photoassimilates produced before
anthesis playing a major role in determining
grain yield.
Relationship between grain yield, senescence and
carbon isotope discrimination
The lack of correlation between Δ values and grain
yield is in agreement with earlier findings from Hafsi
et al. (2003) and Araus et al. (2003) and is likely to
be due to a strong contribution of pre-anthesis
assimilates to yield together with a sink limitation of
yield, breaking the association observed between ∆
and yield under post-anthesis water stress by several
authors (Araus et al., 1998; Merah et al., 2001b;
Monneveux et al., 2005). Heading stage coincided
with strong drought and frost (particularly in the first
season) that strongly reduced potential grain number.
Significant correlation between grain yield and GPE
and significant correlation observed in season 2
between grain yield and Δ after excluding the
genotypes (Dukem and Nacori) in which ear fertility
was more affected, support this hypothesis.
Senescence showed a significant negative correlation
with grain yield in season 1, in good agreement with
Rawson et al. (1983) and Ellen (1987). Contrary to
these findings many studies have demonstrated that
delayed senescence delays remobilization and leads
to reduced grain weight (Yang et al., 1997; Zhu et al.,
1997). Yang et al. (2001) confirmed that association
between grain yield and senescence highly depends
1.0 0.8 0.7 0.6 0.5 0.4 13.4 13.6 13.8 14.0 14.2 14.4 14.6 14.8 Nacori Dukem 12/Rascon 21 r = 0.728* 0.3
G
ra
in
y
ie
ld
(
t h
a
-1)
Carbon isotope discrimination (o/ oo) 0.9 13.4 13.6 13.8 14.0 14.2 14.4 14.6 Naco Dukem 12/Rascon 21 r = 0.728* 1.0 0.8 0.7 0.6 0.5 0.4 13.4 13.6 13.8 14.0 14.2 14.4 14.6 14.8 Nacori Dukem 12/Rascon 21 r = 0.728* 0.3
G
ra
in
y
ie
ld
(
t h
a
-1)
Carbon isotope discrimination (o/ oo) 0.9 13.4 13.6 13.8 14.0 14.2 14.4 14.6 Naco Dukem 12/Rascon 21 r = 0.728*