Publisher’s version / Version de l'éditeur:
Journal of Adhesion Science and Technology, 25, 18, pp. 2501-2520, 2011-05-02
READ THESE TERMS AND CONDITIONS CAREFULLY BEFORE USING THIS WEBSITE. https://nrc-publications.canada.ca/eng/copyright
Vous avez des questions? Nous pouvons vous aider. Pour communiquer directement avec un auteur, consultez la
première page de la revue dans laquelle son article a été publié afin de trouver ses coordonnées. Si vous n’arrivez pas à les repérer, communiquez avec nous à PublicationsArchive-ArchivesPublications@nrc-cnrc.gc.ca.
Questions? Contact the NRC Publications Archive team at
PublicationsArchive-ArchivesPublications@nrc-cnrc.gc.ca. If you wish to email the authors directly, please see the first page of the publication for their contact information.
NRC Publications Archive
Archives des publications du CNRC
This publication could be one of several versions: author’s original, accepted manuscript or the publisher’s version. / La version de cette publication peut être l’une des suivantes : la version prépublication de l’auteur, la version acceptée du manuscrit ou la version de l’éditeur.
For the publisher’s version, please access the DOI link below./ Pour consulter la version de l’éditeur, utilisez le lien DOI ci-dessous.
https://doi.org/10.1163/016942411X580199
Access and use of this website and the material on it are subject to the Terms and Conditions set forth at
A new testing methodology for simultaneous assessment of monotonic
and fatigue behaviour of adhesive joints
Eskandarian, M.; Jennings, R. M.
https://publications-cnrc.canada.ca/fra/droits
L’accès à ce site Web et l’utilisation de son contenu sont assujettis aux conditions présentées dans le site LISEZ CES CONDITIONS ATTENTIVEMENT AVANT D’UTILISER CE SITE WEB.
NRC Publications Record / Notice d'Archives des publications de CNRC: https://nrc-publications.canada.ca/eng/view/object/?id=8f799b7f-f1da-4ec1-83af-4b40efc9f460 https://publications-cnrc.canada.ca/fra/voir/objet/?id=8f799b7f-f1da-4ec1-83af-4b40efc9f460
A NEW TESTING METHODOLOGY FOR SIMULTANEOUS
ASSESSMENT OF MONOTONIC AND FATIGUE BEHAVIOUR OF
ADHESIVE JOINTS
M. Eskandarian
* Aluminium Technology Centre (ATC / IMI), National Research Council Canada,501 boul. de l'Université, Chicoutimi, Quebec, Canada G7H 8C3.
R.M. Jennings
Industrial & Transportation Business Unit, 3M Center Bldg. 201-4N-01, St. Paul, MN 55144-1000.ABSTRACT
Adhesive joints are normally subjected to different working conditions in their service-life. This may involve both static and cyclic loadings. In many instances, a combination of various loading conditions occurs that can be further provoked by exposure to hostile environments. This, in turn, leads to the need to characterize the joint behavior under different combinations of working conditions. Extensive experimental tests are needed in order to evaluate the joint performance under such variable working conditions. This implies the development of low cost and efficient testing techniques that reduces the extra needs to operator time and sophisticated test procedures. Taking this objective into account, a novel technique in mechanical evaluation of adhesive joints was developed in the present work. Alternative monotonic and variable-amplitude cyclic loads were applied on the same double-cantilever-beam (DCB) specimens under cleavage mode. DCB specimens were made from aluminum bars joined together by a two-part toughened structural adhesive. On one face, a series of crack detection sensors were bonded to control the testing machine for switching between monotonic and cyclic loadings. The testing machine had two aligned hydraulic actuators applying bending forces on the upper and lower arms of the DCB
*
Corresponding author:
specimen. The effects of testing frequency and applied load history were also investigated within a range of 4 to 20 Hz for a nominal adhesive thickness of 0.5 mm. The fatigue performance of each configuration was represented by a power-law relationship and was compared for different testing conditions. The test results revealed that the fatigue damage occurred at relatively lower load levels (35%) when compared with monotonic fracture load. The power-law constants for the tested adhesive were influenced by testing frequency but not sensitive to loading order.
KEYWORDS
Adhesive joints, fatigue crack growth, quasi-static test, test frequency, fracture mechanics, critical energy release rate.
1. INTRODUCTION
Structural adhesive joining represents one of the most efficient enabling technologies for the innovative design concepts. Compared to other conventional joining methods, adhesive bonding offers better fatigue resistance along with economic advantages. Due to this, it is often practical to use adhesive joints for transferring cyclic loads that could also be concurrent with environmental exposure. Under such a severe working circumstance, effective determination of joint performance under monotonic and cyclic loadings is crucial for reliable joint design. Although this type of service condition is possibly the most destructive form of mechanical loading, the majority of joint designs are still based on simple monotonic test results at room temperature. As a simple reason, it should be remarked that fatigue in adhesive joints is more complicated than that in a homogeneous material. The tools often used to study fatigue in homogeneous materials are “S-N diagrams” which are based on “stress-life” approach. Their main limitation is the lack of an explicit account of damage evolution during fatigue [1]. The “fatigue crack growth” approach is normally employed to overcome this shortage. In this method, the crack growth per cycle ( ⁄ ) is commonly related to strain energy release rate calculated at maximum load ( ). This implies careful attention to crack propagation during fatigue test. Due to significant experimental efforts and time,
fracture-based fatigue tests are generally more expensive when compared to monotonic or stress-fracture-based fatigue tests. In view of large investment in such a fatigue experiment, a careful planning of test procedure and result analysis is required.
Over the years, research has been conducted on fatigue life prediction, crack nucleation and fatigue crack growth. The results of a literature review revealed that the research works, the ones using “fatigue crack growth” approach, can be classified into three major categories: (a) theoretical developments in fatigue threshold calculations and fatigue crack growth analyses [2–12], (b) application of numerical fatigue models, generally finite elements method, for modeling the fatigue behavior of adhesive joints [12–19], and finally (c) experimental fatigue works [20–40]. The focus in the latter category was mainly to determine the fatigue threshold, crack growth and also to investigate the effects of influencing parameters. As examples, the effects of load ratio [2, 27, 29], test frequency [39–40], adhesive thickness [13, 19, 20, 38], surface pretreatment [31–32], substrate surface roughness [38] and working environment and temperature [37] were investigated by researchers.
The effect of load ratio has been found to be significant in the fatigue response of adhesives [16]. For good bonded joints, an increase in fatigue life was reported by increasing the load ratio when the maximum fatigue load was kept constant. In poorly bonded joints, on the other hand, it was shown that the maximum fatigue load governed the fatigue behavior whilst the load ratio had little influence [32].
Mode I fatigue crack growth tests have been carried out in [39] and [40] on adhesive joints bonded either by filled, or filled and toughened, adhesives at different frequencies between 0.02 and 20 Hz. Higher fatigue crack growth rates were found in the joints bonded by the toughened adhesive, especially at lower frequencies, whilst no significant influence of testing frequency was observed for the filled adhesive.
The impact of the working temperature on fatigue characteristics of polymer composite joints of the type which could feature in aircraft construction were investigated in [37]. Superior quasi static
performance was observed at room temperature and the least at 90°C, while fatigue thresholds were similar at room temperature and -50°C but considerably lower at 90°C.
As with traditional methods, the crack length during a fatigue test can be measured either by physical methods like optical observation [10, 28, 30, 34] or by following a more sophisticated technique based on compliance measurements [26, 27]. The optical crack length measurements require a lot of operating time and efforts while the latter method needs to be empirically calibrated [26]. Some other physical methods were also employed for crack length determination such as back face strain method [35, 36] and the methods using electrical conductive materials [33] or crack propagation gauges [10].
In the present work, a novel experimental technique was developed in order to simultaneously evaluate quasi-static and fatigue behaviors of adhesive joints. The main objective of this work was “to development a new fatigue test methodology that requires minimum operator effort which, in turn, reduces experimental costs and provides better results reproducibility and thus lower scatter in the results”. The methodology was used in testing different structural epoxy adhesives where the influences of test frequency and working temperature were investigated. As the objective of this paper is to clearly show the test methodology, the results presented are limited to the ones obtained for a toughened epoxy adhesive in order to study the effects of testing frequency. Temperature dependency in static and fatigue behaviors of three different structural epoxies, developed for aerospace and automotive industries, are presented in details in separate papers referenced in [41, 42]. It should be noted that determination of fatigue thresholds was not a goal of these studies. Instead the trend of fatigue crack growth has been investigated in a loading range superior than the threshold region.
2. EXPERIMENTS
Adhesive joints of this work were fabricated from aluminum adherends in the form of double cantilever beam (DCB) specimens bonded by the adhesive DP920 of 3M Company. A series of alternative fracture and fatigue tests have been conducted on a single DCB specimen under mode-I loading in order to measure the fracture forces ( ) and the fatigue crack growth rate ( ⁄ ) as a function of applied load, respectively. The critical energy release rate ( ) has then been calculated from measured and crack length ( ). The maximum energy release rate in each cycle ( ) of fatigue tests was also determined from the maximum load of cycle ( ) and fatigue crack length.
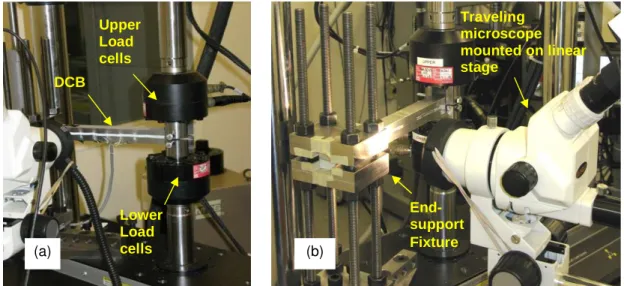
A closed-loop servo hydraulic system (MTS 810) was used in this study which had two aligned hydraulic actuators (2 x 15 kN) applying tensile forces on upper and lower arms of the DCB specimen. This dual-actuator machine is especially adapted for the adhesive joint testing under complex-mode loading by means of an end-support fixture, as shown in Figures 1a and 1b.
Thirteen DCB specimens were fabricated and tested in this study under mode-I loading at different testing frequencies ranging from 4 to 20 Hz. The first specimen was tested under quasi-static loading in order to give an idea of the variation of fracture force along the length of DCB specimen. This also determined the first value of critical energy release rate ( ) for the adhesive selected.
Fig. 1: (a) Dual-actuator test setup of this study and (b) end-support fixture.
(a) (b) Upper Load cells DCB Traveling microscope mounted on linear stage Lower Load cells End-support Fixture
Adhesive
3M™ Scotch-Weld™ DP920 (“DP920”) is a general-purpose two-part (2:1 mix ratio) toughened epoxy structural adhesive with a 20 minute work life. It exhibits excellent shear and peel strengths along with good impact and durability. It bonds to oily metal substrates with minimal surface preparation [43]. Full adhesive curing occurred in 24 hours at room temperature (RT) followed by 60 min at 60°C.
A series of tensile tests have preliminarily been conducted in accordance to ASTM D638 [44] using dogbone specimens (Type I) in order to determine the mechanical properties of DP920. Specimens were prepared by injecting liquid adhesive resin from dual pack cartridges into a plaque mold consisting of two glass plates treated with Frekote 55-NC (Loctite) mold release agent and separated by a 3.2 mm thick silicone gasket. The plaque molds were then placed in a convection oven for curing.Dogbone specimens were then machined from the plaques using a diamond saw and a router / dogbone jig to the dimensions shown in Figure 3. Specimen edges in the gage region were then lightly sanded with 600 grit sand paper to remove any large defects before testing. The inclusion of occasional 1 to 2 mm sized bubbles in the cured plaques and specimens was unavoidable due to the generally high viscosity of the resin. Although attempts were made to keep the worst bubbles out of the specimens it was generally difficult to keep them all out.
Tests were performed on a 20 kN MTS 880 hydraulic load frame equipped with a 2200 N load cell and wedge-type grips. Two extensometers were attached within the 50.8 mm gage region. The first was an axial extensometer with a grip length of 25.4 mm and a maximum range of 15% strain to measure the specimen axial strain. The second was a transverse extensometer to allow the determination of Poisson's ratio. Tests were performed at rate of 5 mm/min giving a nominal strain rate of 10% /min. Test results are summarized in Table 1 while Figure 2 shows the stress-strain curves for five DP920 dogbones tested at room temperature.
Fig. 2: (a) Schematic of dogbone specimen tested,
(b) Stress-strain curves for the dogbones of DP920 tested at RT.
Specimen preparation
Thirteen double cantilever beam (DCB) specimens of this study were made from aluminum bars (2024-T351, T 12.7 mm × W 25.4 mm × L 305 mm) through three assembling batches #1, #2 and #3. In each assembling batch, five specimens were fabricated and designated as “x-y” where “x” and “y” represent batch (1 to 3) and specimen numbers (1 to 5). Prior to bonding, the bars were cleaned by solvent and then treated as a standard sulfuric acid/ sodium dichromate etch (FPL etch) and phosphoric acid anodization process [45]. Aluminum bars were then bonded by the
0 5 10 15 20 25 30 35 0 0.005 0.01 0.015 0.02 0.025 0.03 0.035 0.04 0.045 Axial Strain [mm/mm] Specimen #1 Specimen #2 Specimen #3 Specimen #4 Specimen #5 13 50 R 76 165 19 3.2
Table 1: Mechanical properties of adhesive DP920 at RT
Specimen Young’s Modulus (MPa) Poisson’s Ratio 0.2% Offset Yield (MPa) Elongation at failure (%) 1 1471.6 0.352 16.8 2.9 2 1521.1 0.357 16.8 4.1 3 1750.3 0.381 20.8 2.7 4 1691.3 0.390 18.7 3.0 5 1607.4 0.349 18.6 4.1 Average Standard Dev. 1608.3 7% 0.366 5% 18.4 9% 3.4 21% (a) (b) T ru e S tr e s s [ M P a ]
adhesive DP920 with a nominal adhesive bondline thickness of 0.5 mm. A folded aluminum foil was used as precrack with an approximate length of 28 mm. Figure 3 shows the final geometry of DCB specimens which was slightly shorter than the one recommended by ASTM Standard D3433 [46] due to test setup limitations.
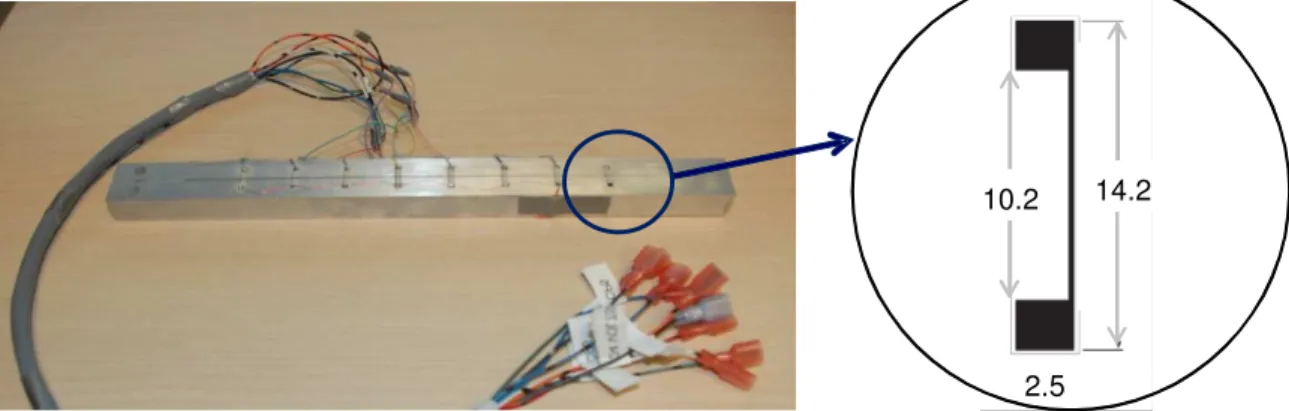
Ten crack detection sensors (CDS) (Vishay CD-23-10A) were bonded to one face of each DCB specimen as an alternative method to optical crack length measurement. Equally-spaced CDS’s were bonded to the first specimen, as shown in Figure 4, whilst unequal distances in monotonic (10 mm) and cyclic (25 mm) regions were respected for the remaining specimens. The sensors were also used for controlling the testing machine in switching between quasi-static and fatigue tests in case when a CDS was broken. A compact electronic interface was designed to process the signals coming out of CDS’s by using a programmable microcontroller of Microchip Company. The device was programmed to send digital signals consistent with the testing machine and also to ensure that the CDS’s are not initially defective.
Fig. 3: Geometry of DCB specimens (All dimensions are given in millimeters).
Fig. 4: Crack detection sensors (CDS) bonded to DCB specimens (Vishay CD-23-10A).
2.5 10.2 14.2 12 1 2 .7 305 28 (Precrack) 2 × Φ 6.35 1 2 .7 Thickness of adherends
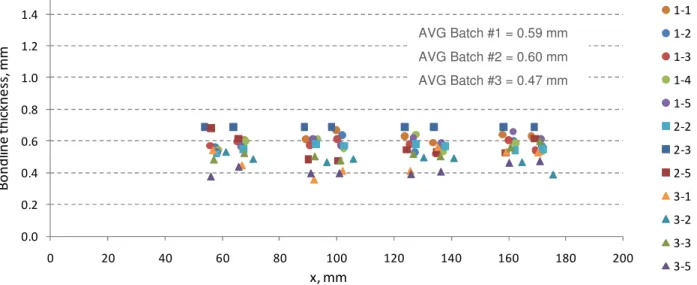
Prior to testing, the bondline thickness and the position of CDS’s bonded to each specimen were carefully measured by using two techniques: (a) micrometer measurements of specimen thickness as well as both substrates, and (b) by using a travelling microscopic equipped with ClemexTM CCD† Camera and measurement software to directly measure the bondline thickness. The first method provided the fairly consistent results as the rounded bar corners could cause some degrees of uncertainty in the microscopic measurements. It can be seen from Figure 5 that the bondline thicknesses were almost constant along the length of DCB specimens (x-coordinate). The average bondline thickness was very close to the nominal value (0.5 mm) for different assembling batches, as shown in Figure 5 and Table 2.
Fig. 5: Variation of bondline thickness for DCB specimens.
Test procedure
A novel testing methodology was developed in this study for simultaneous evaluation of quasi-static and fatigue behaviors of adhesive joints. Monotonic and cyclic loads were alternatively applied to DCB specimens in order to determine the local critical energy release rate ( ) as well as fatigue crack growth rate ( ⁄ ) as a function of applied load.
† Charge-Coupled Device (CCD) 0.0 0.2 0.4 0.6 0.8 1.0 1.2 1.4 0 20 40 60 80 100 120 140 160 180 200 B o n d lin e t h ic k n e ss , m m x, mm 1-1 1-2 1-3 1-4 1-5 2-2 2-3 2-5 3-1 3-2 3-3 3-5 AVG Batch #1 = 0.59 mm AVG Batch #2 = 0.60 mm AVG Batch #3 = 0.47 mm
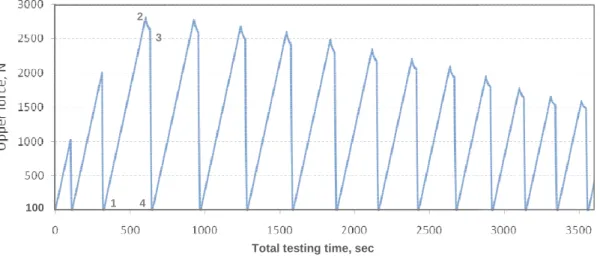
The first specimen (2-3) has tot the variation of fracture forces a then used for determining the m series of similar monotonic load DCB specimen under force-cont ensure that the adhesive layer a stages along the length of the DC rate and adhesive strain rate specimens in [47] through a set automatically detect any sign of shows a typical variation of ⁄ compliance reaches its zero lev system actuator was hold in a p displacement which correspond normally enough for having a fe blunted. During each loading sta compliance was monitored.
Fig. 6: Monotonic load
100 1
2 3
4
totally been tested under monotonic as a function of crack length ( ). The local maximum fatigue force of each cycle ( ). oading stages were applied to upper and lo ontrol mode at a rate of 10 N/s (between Po
approximately experiences the same strain DCB specimen. It should be noted that the re te has already been investigated for alu et of finite element simulations. Testing mach of crack propagation via the variation of joint
⁄ as a function of time leading to the time level (Point 2 on Figures 6 and 7). After ea
period of 30 sec (Point 3, Figure 6) before nds an initial force of 100 N (Point 4, Fi few millimeters of crack propagation witho stage, the history of forces, pin displaceme
ading stages leading to crack propagation for
Total testing time, sec
-I loading for determining al fracture forces ( ) were ). As shown in Figure 6, a lower loading pins of the oint 1 and 2). This was to ain rate at different loading relationship between load luminum and steel DCB achine was programmed to nt compliance ( ). Figure 7 e-to-fracture at which joint each stage of loading, the re retracting back to origin Figure 6). This time was thout causing the crack-tip ents and variation of joint
Fig. 7: Variation of joint compliance and time-to-fracture for specimen 2-3.
Figure 8 and 9 show the variations of fracture forces ( ) and pin displacement at fracture ( ) as a function of crack length. It should be remarked that the discontinuity in measurements shown in figures is due to a temporary system shutdown. The crack propagation and the percentage of load drop were considered as an evaluation index for valid crack detection without any overshooting in the loading stage, Figure 8. Previous experiences [41] showed that a load drop less than 10% normally provides the advancement of crack tip between 1 and 3 mm depending on the type of adhesive and its rigidity.
Fig. 8: Variation of fracture force vs. crack length for specimen 2-3.
-0.05 -0.04 -0.03 -0.02 -0.01 0 0.01 0.02 0.03 0.04 0.05 5 30 55 80 105 130 155 180 205 230 255 280 305 330 d C /d t, m m /k N .s e c Time, sec 0% 5% 10% 15% 20% 25% 30% 0 500 1000 1500 2000 2500 3000 0 20 40 60 80 100 120 140 160 180 L o a d (F ), N
Crack Length (a), mm
Fracture load(2) Load at return(3) Load drop (%)
2
1
Fig. 9: Variation of pin displacement at fracture vs. crack length for specimen 2-3.
As explained above, the test procedure differs in some aspects from ASTM Standard D3433 [46], in which the crosshead speed was varied in a way to keep time-to-fracture around 1 min. According to the standard, crosshead must be kept constant for a long duration after crack initiation to have the propagation relatively fully-stopped.
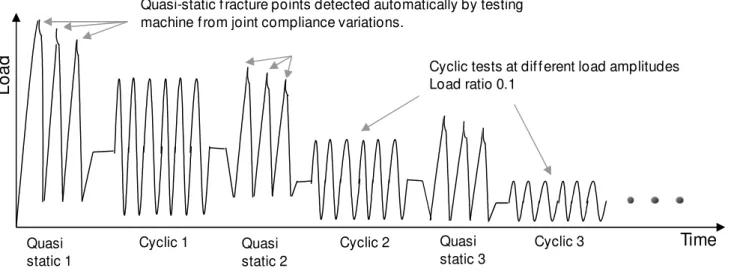
As shown in Figure 10, each further combined mode-I test was started by a series of similar monotonic loading stages (Quasi-static 1, Quasi-static 2, Quasi-static 3, …) which followed a fatigue test at a pre-selected load amplitude (Cyclic 1, Cyclic 2, Cyclic 3,…). The aim of the monotonic tests was to determine the local value as well as sharpening the crack tip for the next fatigue test. The local fracture forces ( ) were then used in the calculation of maximum fatigue force in each cycle ( ) which varied between 76% and 35% of for the first and the last cyclic tests, respectively. In total, five different constant-amplitude cyclic tests were carried out on the same specimen under load control with a load ratio of 0.1. The switch between monotonic and cyclic tests was triggered at a moment when a crack detection sensor was broken by crack propagation. This method was lately modified to apply a percentage of determined from the latest step of monotonic test prior to a fatigue test.
0 0.5 1 1.5 2 2.5 3 3.5 4 4.5 0 20 40 60 80 100 120 140 160 180 P in d is p la ce m en t, m m
Fig. 10: Quasi-static and fatigue test sequences triggered by crack detection sensors.
The advantage of this testing method is that one can determine both the adhesive quasi-static and cyclic performances by using a single specimen. This ensures that the mechanical performances are determined under the same conditions of pretreatment, curing and fabrication. It also eliminates the operator interference and also the need of optical crack length measurements or other sophisticated experimental method for crack length determination.
After each test, the fracture surfaces were carefully examined for any sign of interfacial or semi-interfacial fracture. In general, these can mostly be seen in cyclic zones due to damage accumulation, while cohesive failure is the dominant fracture mode in quasi-static zones [42]. However, this was not the case for the adhesive DP920 where the fracture surfaces were cohesive in both zones, as typically shown in Fig. 11.
Fig. 11: Typical fracture surface for a DCB specimen bonded by the adhesive DP920.
Cyclic tests at dif f erent load amplitudes Load ratio 0.1 Time L o a d Quasi static 1 Cyclic 1 Quasi static 2 Quasi static 3 Cyclic 2 Cyclic 3
Quasi-static f racture points detected automatically by testing machine f rom joint compliance variations.
Cyclic fracture loci: Cohesive
Direction of crack propagation
RESULTS AND DISCUSSION
The mode-I critical energy release rate was preliminary determined by testing the first DCB specimen (2-3) under a series of monotonic loadings at a load rate of 10 N/s. A beam-on-elastic-foundation model was employed in calculations resulting in equation (1). The readers are referred to [48] for the detailed formulations of this model.
(
2 2)
3 212
I c s s Icf
t
E
a
G
=
⋅
Φ
(1)where ΦΦΦΦ can be replaced by following equation.
4 1 3
1
2
2
1
2
1
667
.
0
1
−
+
−
+
=
Φ
a s a a IE
E
h
t
h
t
a
h
(2)The parameters , , , , , and in the equations (1) and (2) represent the crack length, the adherend and adhesive elastic moduli, the adherend and adhesive bondline thicknesses, and the fracture force per unit width of DCB specimen ( ⁄ ℎ), respectively. The parameter refers to half of the thickness of DCB specimen, i.e. = + ⁄ .
Figure 12 shows the measured points along the length of DCB specimen 2-3. These values were averaged for the points lied down on plateau section for being represented as the measured for the tested specimen. For the rest of specimens, five stages of quasi static loadings were considered in order to measure prior to each cyclic test. In total, an average value of = 1328 J/m2 was measured for this adhesive. A summary of measurements is given in Table 2 for the tested specimens categorized in three assembling batches #1, #2 and #3. A standard deviation of 7% was calculated in the measurements. In general, good repeatability was observed, as shown in Figure 13, for the specimens selected from different assembling batches.
Table 2: Measured values for DCB specimens. Test No. Specimen No. Bondline thickness (mm) (J/m2) 1 2-3 0.690 1216 2 2-5 0.559 1383 3 3-3 0.523 1288 4 3-4 0.523 1346 5 3-5 0.416 1154 6 3-2 0.475 1338 7 3-1 0.472 1412 8 1-1 0.616 1289 9 1-2 0.583 1393 10 1-3 0.574 1231 11 1-4 0.576 1530 12 1-5 0.595 1326 13 2-2 0.557 1363 Average Batch #1 0.589 1354 Average Batch #2 0.602 1321 Average Batch #3 0.471 1308 Average all Standard Dev. 0.550 13% 1328 7%
Fig. 12: Measurements of along DCB specimen.
0 200 400 600 800 1000 1200 1400 1600 1800 2000 0 20 40 60 80 100 120 140 160 180 200 220 GI c , J /m 2
Crack Length (a), mm
Fig. 13: Repeatability in measurements for selected specimens among different batches.
The influence of testing frequency on fatigue behavior of the adhesive DP920 was investigated in this study by varying the testing frequency from 4 to 20 Hz. The crack growth rate ( ⁄ ) was determined as a function of energy release rate variation in each cycle (∆ ). Various ratios of ∆ ⁄ ranging from 12 to 58% were taken into account in this study. Five different levels of ∆ were considered for each DCB specimen mainly in a decreasing order except for one specimen. All fatigue stages have been carried out in a short length of crack propagation (≅10 mm) in order to prevent a large difference of ∆ ⁄ between the start and ending stages of cyclic tests. This ratio was furthermore averaged over this length in order to increase the accuracy of measurements. A power law equation (Paris law) was fitted to each set of fatigue data, i.e. the variation of crack speed ⁄ as a function of applied energy release rate ∆ as in equation (3).
( )
mG
C
dN
da
ˆ
ˆ∆
⋅
=
(3)In which Cˆ and mˆ are power-law constants (material parameters). Figure 14 shows typical curves fitted for three specimens tested at 8 Hz. In general, a good repeatability in fatigue results was observed in each testing condition. It should be noted that the specimens of Figure 14 were
0 200 400 600 800 1000 1200 1400 1600 1800 2000 0 20 40 60 80 100 120 140 160 180 200 220 GI c , J /m 2
Crack Length (a), mm
1-5 2-5 3-3
selected from three different assembling batches having different bondline thicknesses. Further to this, specimen 2-2 was tested under reverse order of load levels starting from lower ratios of ∆ ⁄ toward higher levels. No significant differences were observed for the order of load levels or adhesive bondline thickness in the small range of 0.42 to 0.69 mm.
Fig. 14: Repeatability in fatigue results at 8 Hz for selected specimens among different assembling batches.
The variation of energy release rate in each cycle (∆ ) was normalized to (Table 2) in order to decrease the effects of normal scatter in test data, equation (4). This equation was then used in evaluating the influence of testing frequency on fatigue behavior of DP920, as shown in Figure 15 in (a) the normal and (b) semi-logarithmic scales. The coefficient and the exponent were measured and compared at different frequencies, as shown in Figure 15a in the curve fitting equations, in which and represent ⁄ and ∆ ⁄ , respectively.
m Ic
G
G
C
dN
da
∆
⋅
=
(4) 1E-07 1E-06 1E-05 0.0001 0.001 0.01 0.1 1 0 200 400 600 800 1000 d a /d N , m m /c yc le ∆G, J/m2 1-3 No propagation (8 Hz) 3-4 No propagation (8 Hz) 2-2 No propagation (8 Hz) Power (1-3) Power (3-4) Power (2-2)Fig. 15: Effect of testing frequency on fatigue behavior of tested specimens in (a) linear and (b) semi-logarithmic scales.
An alternative form of this equation can also be given as equation (5). It was found that the coefficient can be considered as a quasi-static part and the exponent represents mainly the
y = 0.2049x5.2512 R² = 0.8828 y = 0.1038x4.9984 R² = 0.9506 y = 0.0911x4.8117 R² = 0.9732 y = 0.0513x4.6586 R² = 0.9673 y = 0.0682x4.8134 R² = 0.9535 0.000 0.001 0.002 0.003 0.004 0.005 0.006 0.007 0.008 0.0 0.2 0.4 0.6 0.8 1.0 d a /d N , m m /c yc le ∆G / Gc 4 Hz 8 Hz 12 Hz 16 Hz 20 Hz Power (4 Hz) Power (8 Hz) Power (12 Hz) Power (16 Hz) Power (20 Hz) 1E-07 1E-06 1E-05 0.0001 0.001 0.01 0.1 1 0.0 0.2 0.4 0.6 0.8 1.0 d a /d N , m m /c yc le ∆G / Gc 4 Hz No propagation (4Hz) 8 Hz No propagation (8 Hz) 12 Hz No propagation (12 Hz) 16 Hz No propagation (16 Hz) 20 Hz No propagation (20 Hz) Power (4 Hz) Power (8 Hz) Power (12 Hz) Power (16 Hz) Power (20 Hz) Ic Ic (a) (b) In c re a s e i n t e s ti n g f re q u e n c y
fatigue behavior of material in the power-law region. The material parameters of equations (4) and (5) are given in Table 3 at different frequencies and their frequency dependencies are also shown in Figure 16a and 16b. At lower frequencies, the parameters and tend toward 1.0 and very small values, respectively. This can almost be considered as quasi-static condition as ∆ approaches . f Ic
dN
da
Q
G
G
⋅
=
∆
(5)It is evident from Figure 16a and 16b that there is a frequency dependency in power-law constants determined for the adhesive DP920. The maximum variations of 58% and 24% in material parameters and were observed when testing frequency increased from 4 to 20 Hz.
In general, the fatigue performance of an adhesive can only be determined when its threshold energy release rate is determined. But, one may say that the lower value of power-law exponent represents a smoother fatigue curve and thus a better fatigue resistance. An estimation of can, however, be obtained by using this test method when one of the load levels is selected in a way that causes no evident crack propagation after 106 cycles. The data points laid down on the abscissas of Figure 14 and 15b represent this condition. Hence, one may say that the adhesive fatigue threshold value is somewhere around 200 J/m2 depending on testing frequency, as was shown in Figure 15b.
Table 3: Paris-law coefficients versus testing frequency
Frequency (Hz) Coefficient C x 102 Exponent m Coefficient Q Exponent f 4 20.49 5.25 1.12 0.17 8 10.38 5.00 1.44 0.19 12 9.11 4.81 1.57 0.20 16 5.13 4.66 1.76 0.21 20 6.82 4.81 1.61 0.20 Max. variations Comparing to 4 Hz -75% -11% 58% 24%
Fig. 16: Variation of Paris-law coefficient with testing frequency for (a) Equation (4) and (b) Equation (5).
3 3.5 4 4.5 5 5.5 0 5 10 15 20 25 0 2 4 6 8 10 12 14 16 18 20 22 E xp o n e n t ( m ) C o e ff ic ie n t ( C ) Frequency (Hz) Coef f icient (C) Exponent (m) 0.1 0.15 0.2 0.25 0.3 0 0.5 1 1.5 2 0 2 4 6 8 10 12 14 16 18 20 22 E xp o n e n t ( f) C o e ff ic ie n t ( Q ) Frequency (Hz) Coefficient (Q) Exponent (f) (a) (b)
CONCLUSIONS
A novel experimental technique was developed in this study for simultaneous evaluation of quasi-static and fatigue behaviors of adhesive joints. The method requires a minimum operator influence, thus, lower experimental cost. Due to alternative monotonic and cyclic loadings, different fatigue load levels can be applied to a single adhesively bonded specimen without any interference to other test stages. The influence of testing frequency was also investigated. Thirteen double cantilever beam specimens (DCB) were fabricated with a nominal adhesive thickness of 0.5 mm and tested under cyclic loads at different frequencies between 4 and 20 Hz. The fatigue performance under each condition was represented by a power-law relationship (Paris-law). The experimental results of this study revealed that the power-law constants were affected by testing frequency but not very sensitive to loading history or to small adhesive thickness variations of this study. The following conclusions can be extracted from the test results of this study.
In general, a good repeatability was observed in both critical energy release rate ( ) and crack speed ( ⁄ ) measurements. This can be considered as another validation for the automated test procedure developed in this study. Very consistent crack detection was observed.
An average critical energy release rate ( ) of 1328 J/m2 was measured for this adhesive in both monotonic test and quasi-static loading stages between fatigue tests.
The selected toughened epoxy adhesive had mid-range stiffness (≈1.6 GPa) and demonstrated a good fatigue resistance with a threshold load that varied was between 35% and 39% of the corresponding quasi-static fracture force. It was estimated that the adhesive has a threshold energy release rate around 200 J/m2 that was slightly dependant on testing frequency.
This threshold value is still far from the adhesive critical energy release rate (15% of ). This significant influence of fatigue loading cannot be ignored in adhesive joint design when the presence of cyclic loads is expected.
Significant influences of testing frequency on power-law constants were observed. The reductions of 75% and 11% were determined in power-law coefficient and exponent, respectively,
when the testing frequency increased from 4 to 20 Hz. In the case of reverse power-law constants, 58% and 24% increases were determined within the same range of frequency. This means that the fatigue performance of adhesive joints can be underestimated at higher frequencies. Lower fatigue load limit can be estimated for the adhesive joint tested at higher frequencies that is hence in the safe direction.
The fatigue threshold was not, however, that much sensitive to testing frequency. On the other hand, one may say that the crack speed was dependant on the testing frequency in the power-law region far enough from the threshold value. However, the measured threshold value can still be considered accurate even at higher frequencies. Thus, one may say that the variable-frequency tests can be considered as a solution in precise determination of adhesive fatigue behavior. Lower frequencies can be considered for the regions far from fatigue threshold. Limited number of cycles and hence time is required to propagate the crack up to a certain extent in such a region. On the other hand, higher frequencies can be used around threshold regions. This will cause a significant reduction in testing time as the number of cycles is in the scales of millions around threshold region.
No evident influence of loading scenarios was observed in fatigue tests either in descending or ascending order.
Small dependencies to the adhesive thickness were observed in both and ⁄ measurements for the small range of adhesive thickness variations of this study (0.42 to 0.69 mm).
It was observed that the fatigue failure loci remained totally cohesive and, for this adhesive, less sensitive to loading type.
ACKNOWLEDGMENTS
The authors wish to acknowledge the efforts of technical, administrative, and managing staffs in 3M Innovation Laboratories and the Aluminium Technology Centre (ATC) of the National Research Council Canada especially Maxime Côté and Myriam Poliquin for their technical assistances in specimen preparation and in mechanical tests. Special thanks to François Hamel for his valuable comments on the paper.
REFERENCES
[1] J.P. C-Rodriguez, I.A. Ashcroft and V.V. Silberschmidt, J. of Sounds & Vibration, 308, 467 (2007).
[2] A. Pirondi and F. Moroni, The J. of Adhesion, 86, 501 (2010).
[3] A. Pirondi and F. Moroni, Int. J. of Adhesion & Adhesives, 29, 796 (2009).
[4] G.V. Marannano, L. Mistretta, A. Cirello and S. Pasta, Eng. Fracture Mech., 75, 5122 (2008). [5] Y. Yao, M.E, Fine and L.M. Keer, Int. J. Fracture, 146, 149 (2007).
[6] S. Pommier and R. Hamam, Fatigue Fract. Engng. Mater. Struct., 30, 582 (2007).
[7] B.R.K. Blackman, A.J. Kinloch, M. Paraschi, Eng. Fracture Mechanics, 72 (6), 877 (2005). [8] K.L. Roe and T. Siegmund, Eng. Fracture Mechanics, 70, 209 (2003).
[9] H. Hadavinia, A.J. Kinloch, M.S.G. Little and A.C. Taylor, Int. J. of Adhesion & Adhesives, 23, 463 (2003).
[10] H. Hadavinia, A.J. Kinloch, M.S.G. Little and A.C. Taylor, Int. J. of Adhesion & Adhesives, 23, 449 (2003).
[11] A.J. Kinloch and S.O. Osiyemi, The J. of Adhesion, 43 (1), 79 (1993).
[12] A.J. Curley, J.K. Jethwa, A.J. Kinloch and A.C. Taylor, The J. of Adhesion, 66 (1), 39 (1998). [13] M.M. A-Wahab, I.A. Ashcroft, A.D. Crocombe, D.J. Hughes, S.J. Shaw, J. Composites, Part A (32), 59 (2001).
[14] R.R. Gomatam and E. Sancaktar, J. Adhesion Sci. Technol., 20 (1), 87 (2006).
[15] H. Khoramishad, A.D. Crocombe, K.B. Katnam, I.A. Ashcroft, Int. J. Fatigue, 32 (7), 1146 (2010).
[16] H. Khoramishad, A.D. Crocombe, K.B. Katnam, I.A. Ashcroft, Int. J. Adhesion & Adhesives, 30 (6), 513 (2010).
[17] P.T. Cheuk, L. Tong, A.N. Rider, J. Wang, Int. J. of Adhesion & Adhesives, 25, 181 (2005). [18] X.X. Xu, A.D. Crocrombe and P.A. Smith, J. Fatigue, 16, 469 (1994).
[20] S. Azari, M. Papini, J.K. Spelt, Eng. Fracture Mech., 78, 153 (2011).
[21] R. Branco, F.V. Antunes and R. F. Martins, Fatigue Fract. Engng. Mater. Struct., 31, 452 (2008).
[22] L. Susmel, R. Tovo and D. Benasciutti, Fatigue Fract. Engng. Mater. Struct., 32, 441 (2008). [23] S.Erpolat, I.A.Ashcroft, A.D.Crocombe, M.M. A-Wahab, Int. J. of Fatigue, 26, 1189 (2004). [24] A.J. Kinloch and S.O. Osiyemi, The J. of Adhesion, 43, 79 (1993).
[25] I.A. Ashcroft and S.J. Shaw, Int. J. Adhesion and Adhesives, 22, 151 (2002).
[26] D.L. Erdman and J.M. Starbuck; “Fatigue crack growth in adhesive joints”; Adv. Materials Processing and Measurement Tech., Oak Ridge National Laboratory.
[27] S. Azari, M. Papini, J.A. Schroeder, J.K. Spelt, Eng. Frac. Mech., 77, 395 (2010). [28] I.A. Ashcroft, J.P. C-Rodriguez and V.V. Silberschmidt, The J. of Adhesion, 86 (5), 522 (2010).
[29] K.B. Katnam, A.D. Crocombe, H. Khoramishad, and I.A. Ashcroft, The J. of Adhesion, 86 (3), 257 (2010).
[30] A. Pirondi, G. Nicoletto, Eng. Fracture Mech., 73, 2557 (2006).
[31] M.-L. Abel, A.N.N. Adams, A.J. Kinloch, S.J. Shaw and J.F. Watts, Int. J. of Adhesion & Adhesives, 26, 50 (2006).
[32] P.R. Underhill, D.L. DuQuesnay, Int. J. of Adhesion & Adhesives, 26, 62 (2006).
[33] H.Y. Hwang, B.J. Kim, W.S. Chin, H.S. Kim and D.G. Lee, J. Adhesion Sci. Technol., 19 (12), 1081 (2005).
[34] A.H. Al-Ghamdi, I.A. Ashcroft, A.D. Crocombe and M.M. A-Wahab, The J. of Adhesion, 79 (12), 1161 (2003).
[35] A.G. Solana, A.D. Crocombe, I.A. Ashcroft, Int. J. of Adhesion & Adhesives, 30, 36 (2010). [36] A.D. Crocombe, C.Y. Ong, C.M. Chan, M.M. A-Wahab and I.A. Ashcroft, The J. of Adhesion, 78 (9), 745 (2002).
[37] I.A. Ashcroft, D.J. Hughes, S.J. Shaw, M. A-Wahab and A. Crocombe, The J. of Adhesion, 75 (1), 61 (2001).
[38] J.W. Kwon and D.G. Lee, J. Adhesion Sci. Technol., 14 (8), 1085 (2000). [39] X.X. Xu, A.D. Crocombe and P.A. Smith, The J. of Adhesion, 58, 191 (1996).
[40] X.X. Xu, A.D. Crocombe and P.A. Smith, in: Proceedings of the conference EUR ADH 94 Adhesion, Mulhouse, France; pp. 232–236 (1994).
[41] M. Eskandarian, B. Jennings, M. Côté and B. Arsenault, SAE Int. J. Mater. Manuf., 3, 622-627 (2010).
[42] M. Eskandarian, B. Jennings, M. Côté and B. Arsenault, SAE International, Paper 2010-01-0969 (2010).
[43] Technical data sheet for 3M™ Scotch-Weld™ Epoxy Adhesive DP920, 3M Company (2009). [44] ASTM International Standard D638, American Society for Testing and Materials (2008). [45] ASTM International Standard D2651, American Society for Testing and Materials (2001). [46] ASTM International Standard D3433, American Society for Testing and Materials (2005). [47] M. Eskandarian, J.A. Schroeder, D.L. Faulkner, M. Papini and J.K. Spelt, in: Proceedings of the conference EurAdh 2008, Oxford University, UK (2008).
[48] S. Azari, M. Eskandarian, M. Papini, J.A. Schroeder, J.K. Spelt, Eng. Fracture Mech., 76, 2039 (2010).