Publisher’s version / Version de l'éditeur:
Canadian Geotechnical Journal, 17, 2, pp. 174-184, 1980-05
READ THESE TERMS AND CONDITIONS CAREFULLY BEFORE USING THIS WEBSITE. https://nrc-publications.canada.ca/eng/copyright
Vous avez des questions? Nous pouvons vous aider. Pour communiquer directement avec un auteur, consultez la première page de la revue dans laquelle son article a été publié afin de trouver ses coordonnées. Si vous n’arrivez pas à les repérer, communiquez avec nous à PublicationsArchive-ArchivesPublications@nrc-cnrc.gc.ca.
Questions? Contact the NRC Publications Archive team at
PublicationsArchive-ArchivesPublications@nrc-cnrc.gc.ca. If you wish to email the authors directly, please see the first page of the publication for their contact information.
NRC Publications Archive
Archives des publications du CNRC
This publication could be one of several versions: author’s original, accepted manuscript or the publisher’s version. / La version de cette publication peut être l’une des suivantes : la version prépublication de l’auteur, la version acceptée du manuscrit ou la version de l’éditeur.
Access and use of this website and the material on it are subject to the Terms and Conditions set forth at
Deformations and pore pressures in the vicinity of a precast,
segmented, concrete-lined tunnel in clay
Palmer, J. H. L.; Belshaw, D. J.
https://publications-cnrc.canada.ca/fra/droits
L’accès à ce site Web et l’utilisation de son contenu sont assujettis aux conditions présentées dans le site LISEZ CES CONDITIONS ATTENTIVEMENT AVANT D’UTILISER CE SITE WEB.
NRC Publications Record / Notice d'Archives des publications de CNRC:
https://nrc-publications.canada.ca/eng/view/object/?id=23ebccde-7d27-4527-816c-47dc2d948a3c https://publications-cnrc.canada.ca/fra/voir/objet/?id=23ebccde-7d27-4527-816c-47dc2d948a3c
-
---
National Research Conseil nationalSer
TH1 I Council Canada de recherches Canada
N21d
I I
k;c&#&
i - d
DEFORMATIONS AND PORE PRESSURES IN THE VICINITY OF
A
PRECAST, SEGMENTED, CONCRETE-LINED TUNNEL IN CLAY
by J. H. L. Palmer and D. J. Belshaw
Reprinted from
Canadian Geotechnical Journal
Vol. 17, No. 2, May 1980
p. 174-184
DBR Paper No. 895
Division of Building Research
This publication is being distributed by the Division of Building Research of the National Research Council of Canada. It should not be reproduced in whole or in part without permission of the original publisher. The Division would be glad to be of assistance in obtaining such permission.
Publications of the Division may be obtained by mailing the ap- propriate remittance ( a Bank, Express, or Post Office Money Order, or a cheque, made payable to the Receiver General of Canada, credit NRC) to the National Research Council of Can- ada, Ottawa. KIA OR6. Stamps are not acceptable.
A list of all publications of the Division is available and may be obtained from the Publications Section, Division of Building Re- search, National Research Council of Canada, Ottawa. KIA 0R6.
Deformations and pore pressures in the vicinity of
a precast, segmented,
concrete-lined tunnel
in
clay1
J. H.
L.
PALMER - 5Geotechnical Section, Division of Building Research, National Research Council of Canada, Ottawa, Ont., Canada KIA OR6 AND
+
D.
J.
BELSHAWMorton & Partners Limited, Consulting Geotechnical and Geological Engineering, 50 Galaxy Boulevard, Rexdale, Ont., Canada M9 W 4Y5
Received October 17, 1978 Accepted November 28, 1979
During construction of a 2.16 m diameter tunnel in a soft to firm clay deposit in Thunder Bay, Ontario, an initial array of instrumentation to provide data indicating overall performance and a second array to provide detailed spatial deformation and pore-water pressure distribution were installed. The tunnel lining consisted of unbolted rings composed of four trapezoidal, unreinforced concrete sections assembled within the tailpiece of the tunnel boring machine. This paper presents and discusses detailed observations of soil deformation, pore-water pressure changes, and total pressure on the lining obtained from the second array of instru- mentation. The soil stratigraphy was similar to that at the first array and the data obtained are compared with the earlier data. Monitoring of the instruments is continuing and data from the first year of observations are presented.
Lors de la construction d'un tunnel de 2.16 m de diamktre dans un dCpBt d'argile molle ?i ferme ?i Thunder Bay, Ontario, une premikre sCrie d'instruments a CtC installee pour obtenir des indications sur le comportement gCnkral de l'ouvrage et une deuxikme sCrie a 6th install& pour rnesurer en dCtail la distribution des pressions interstitielles et des dCformations. Le revetement du tunnel Ctait constituC d'anneaux non boulonnCs, form& par quatre sections trapboidales de bkton armC, assembl&s h l'arrikre d'une machine-tunnel.
Cet article prCsente les observations dCtaillCes de dkformations du sol, de variations de pressions interstitielles et de contraintes totales sur le revetement, obtenues I'aide de la deuxikme sCrie d'instruments. La stratigraphie du sol Ctant semblable ?i celle prevalent ?i proximitt de la premikre sCrie; les donn&s obtenues sont comparkes. On continue ?i faire le relev6 des instruments, et les donnCes relatives ?i la premikre annCe d'observation sont prC- senttes.
[Traduit par la revue] Can. Geotech. J., 17, 174-184 (1980)
Introduction tion for a second similar installation planned for a
In March 1976 construction was commenced on a later section of the tunnel. In fact, the initial array of 3.3 km section of a 2.16 diameter sanitary trunk instrumentation was so satisfactory that the second sewer in the city of Thunder Bay, Ontario. The array was redesigned to provide more detailed in- tunnel was constructed through soft clay soil using a formation on the spatial distribution of deformations tunnel boring machine together with a segmented and pore pressure, with less On
precast concrete tunnel lining. This was the first use behaviour.
The field data obtained from the initial set of in-
.
* of such a construction technique in North America,and because the subsoil conditions were known to be strumentation have been presented and difficult for tunnelling an extensive field instrumenta- Palmer (1978). In the present paper the results ob-
tion program was undertaken. tained from the second array of instrumentation are
- I
Owing to the unique nature of the project, an array presented and discussed.of instrumentation was installed close to the start of
construction to provide both an initial overall indica- Tunnelling Procedure tion of the tunnel performance and on-site experience
with the instruments and soil conditions in prepara- A detailed description of the tunnelling procedure has been given by Morton et al. (1977). The system 'Presented at the 31st Canadian Geotechnical Conference, employs a full-face tunnel boring machine together Winnipeg, Alta., 18-20 October 1978. with an unbolted, precast, segmented concrete tunnel
OOO8-3674/80/020174-11 SOl.OO/O
@ 1980 National Research Council of Canada/Conseil national de recherches du Canada
PALMER A N D BELSHAW 175
lining. Each ring of the lining is 1 m long and is com- posed of four trapezoidal-shaped segments of unrein- forced concrete 11 cm thick. The mined diameter of the tunnel is 2.47 m and the outside diameter of the completed lining 2.38 m. The lining is assembled within the protection of the tunnelling machine tail- piece and is designed to serve as both the primary
'
and secondary lining.The tunnelling machine advances by thrusting on the completed lining. During the advance a clay grout is injected into the tailpiece void. A key element in the system is an erector arm specially designed to lift and erect the lining segments. One ring can be assembled in 5-10 min and a maximum progress rate of 29 m of completed tunnel per 8 h shift has been achieved in the soft to firm clay.
Subsoil Conditions
General
The tunnel is constructed within a deltaic plain formed at the confluence of the Neebing, McIntyre, and Kaministikwia Rivers in the City of Thunder Bay, Ontario (Fig. 1). Although arrays 1 and 2 are about 1.25 km apart, the stratigraphy is very similar. Postglacial fluvial deposits of sand and silty sand are underlain by late glacial lacustrine deposits of layered and varved clays that extend to black shale bedrock of the Gunflint Iron Formation of the late Pre- cambrian age.
Site Conditions
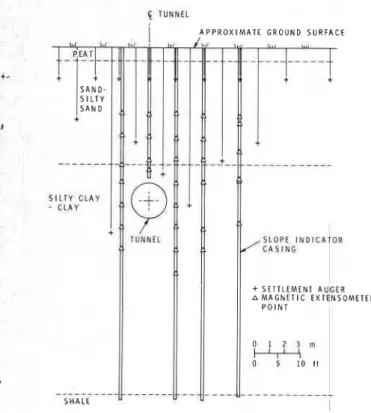
Array 2 is located in an area of mixed bush with moderately difficult access. The stratigraphy (Fig. 2) consists of about 0.9 m of peat underlain by 7 m of sand and silty sand, then 16.6 m of silty clay to clay extending to bedrock. The depth to the centre line of the tunnel is about 10.5 m.
The sand deposit is generally very loose to loose in relative density, wlth standard penetration test N values ranging from 1 to 10 blows. The N values of 20-45 blows (shown in Fig. 2) are not representative of the overall deposit. The grey sand grades to silty
.
.
sand with depth and occasional clay seams are present. The groundwater table was at a depth of about 1.5 m when the instruments were installed..
.
The upper 5 m of the cohesive deposit consists ofgrey silty clay. The remainder is made up of alter- nating grey and reddish brown silty clay to clay layers with occasional layers of silt or fine sand. The shear strength, as indicated by unconfined compres- sion tests, varies from 15 to 32 kPa and, as indicated by Geonor vane tests, varies from 30 to 65 kPa with sensitivities from 5 to 11. The data shown in Fig. 2 were obtained in the course of installing the instru-
ments. Penetration resistance, unconfined compres- sion test samples, and the Geonor test data were obtained from the boreholes for slope indicators A, B, and C, respectively.
Instrumentation
General
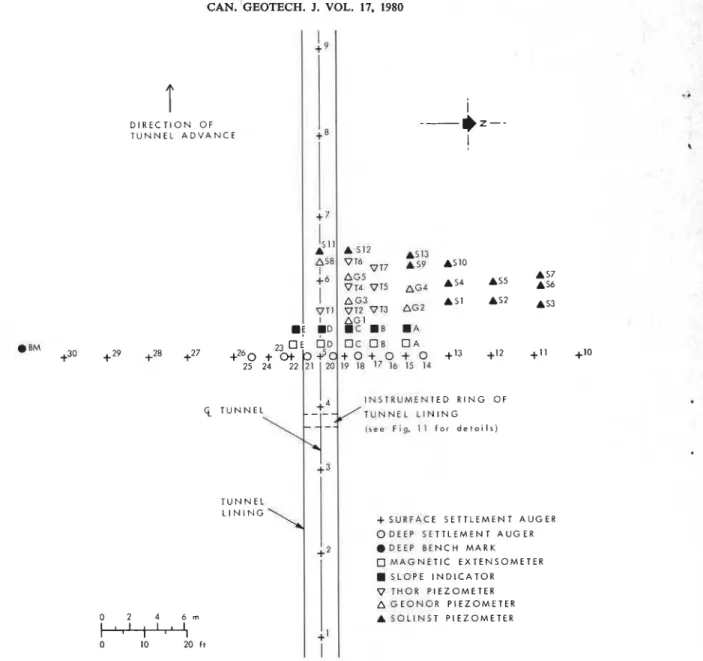
Data previously obtained at array 1 indicated that the surface settlement trough was symmetrical with respect to a vertical plane through the axis of the tunnel and very similar from section to section along the tunnel centre line (Belshaw and Palmer 1978). Almost all vertical deformation instruments and piezometers of array 2 were installed as much as possible within one cross section, the piezometers only on one side of the tunnel centre line (Fig. 3). To verify that the instrumented area represented average tunnel behaviour in the vicinity of array 2 surface settlement over the tunnel centre line was monitored at about 6 m intervals for a distance of 24 m on either side of the principal cross section. In addition, total pressure cells, stressmeters, and piezometers were mounted in one ring of the tunnel lining approxi- mately beneath the location of settlement auger No. 4 (Fig. 3). The tunnel lining instrumentation will be discussed separately.
Soil Deformation
Thirty settlement augers and five lines of magnetic extensometers were installed to monitor vertical de- formation. The surface settlement augers were in- stalled at a depth of 1.5 m, which was below the anticipated depth of frost penetration. The deep settlement augers and magnetic extensometer points were located at various depths, as shown in a com- posite section (Fig. 4). The reference for all settlement measurements was a deep benchmark seated on bed- rock (Fig. 3). Standard surveying techniques with an accuracy of
+
2 mm were employed.To monitor lateral deformation, five slope indi- cator casings were installed, as indicated in Fig. 4. The four deep casings were seated in bedrock. The position of the top of each casing was periodically surveyed. In addition, any settlement of the casings was observed as part of the settlement auger ob- servations.
Pore-water Pressure Changes
Thirty piezometers were installed, located in plan as shown in Fig. 3 and in composite section as indi- cated in Fig. 5. In the immediate vicinity of the tunnel, seven pneumatic piezometers (Tl-T7) were used to monitor rapid changes in pore pressure. Three Geonor piezometers (GI, G3, G5) were in-
CAN. GEOTECH. J. VOL. 17. 1980
D " I " + h
d p j
S a u l t S t e M o r
.
Chicago
SAND - SILTY SAND LOOSE TO DENSE
SILTY CLAY - CLAY
FIRM TO STIFF GREY A N D RED BROWN LAYERS OCCASIONAL LAYERS O F SILT OR F I N D SAND
PALMER AND BELSHAW SHEAR STRENGTH, kPa
PENETRATION RESISTANCE, BLOWS
FIG. 2. Soil section and summary of test results.
stalled to provide a duplication of three of the
- -
pneumatic piezometers and two others were locatedabout 5 m from the tunnel for the purpose of in situ
hydraulic fracturing tests. The remaining piezometers
- -
were of the standpipe type and were installed to monitor only the long-term pore-water pressures. A standpipe piezometer was installed as a reference about 50 m north of the array. Vibrating wire type piezometers (121-124, Fig. 5) were installed in the centre of each segment in the instrumented ring. These provided a rapid response during tunnel con- struction and could be monitored remotely without difficulty.Tunnel Instrumentation
The ring of tunnel lining (i.e., four segments) was also instrumented to monitor total pressure acting on the lining, longitudinal stress caused by thrust of the tunnelling machine as it was advanced, and hoop compression in the segments. Although this instru- mentation is not all of primary importance t o the topic of this paper it is included to complete the record of the field observations. Similar pressure cells and stressmeters were used in array 1 and are de- scribed in more detail by Belshaw and Palmer (1978). Except for the four piezometers, the other 20 instruments were installed in the segments at the
CAN. GEOTECH. J. VOL. 17. 1980
T
D I R E C T I O N O F T U N N E L A D V A N C E t 8+
7 AS8 V T b 1 V T 7 A As1O +6 AG5 V T d V T 5 A G ~1
AG3 VTI ~ 7vn ~ 2 A G 2.!
iFc1.B I A 23 O E O D a cae
U A +28 +27 I N S T R U M E N I E D R I N G OF T U N N E L T U N N E L L I N I N G l r e e F i g . 1 1 f o r d e t a ~ l r ) T U N N E L L I N I N GI i l
+ S U R F A C E S E T T L E M E N T A U G E R O D E E P S E T T L E M E N T A U G E R .DEEP B E N C H M A R K M A G N E T I C E X T E N S O M E T E R SLOPE I N D I C A T O R V THOU P I E Z O M E T E R A G E O N O R P I E Z O M E T E R A S O L I N S T P I E Z O M E T E RFIG. 3. Plan of instrumentation.
casting plant (about 1440 km from the site). Subse- quently, the segments were shipped to the site by truck as part of a regular shipment. Ideally, this ring of lining should have been installed directly beneath the surface instrumentation, but it was considered important to have a completely normal, continuous tunnelling operation through the instrumented area. The ring was installed, therefore, as the last unit on the last night shift before the instrumented area was reached. As a consequence of cooperation on the part of the contractor and his men, plus some luck, the ring was installed within 7 m of the fully instru- mented area. The instrumentation was designed so
that all wiring, checking, and protection could be
completed in the available 7 h before the commence- ' 1
ment of the day shift. The readout terminal was installed at the top of the nearest shaft, which was
located about 135 m east of the instrumented ring.
. .
Field Observations
All instruments were installed more than 3 weeks prior to construction through the array. Monitoring of the instrumentation intensified as the tunnelling machine approached the site. The face of the machine was about 15 m east of the centre of the array at 19:30 h on 19 August 1976, at which time an ob-
PALMER AND BELSHAW 179 E TUNNEL E S I L T Y C L A Y - C L A Y S L O P E I N D I C A T O R C A S I N G + SETTLEMENT AUIGER A M A G N E T I C E X T O N S O M E T E R P O I N T 0 1 2 3 m 0 5 10 I t S H A L E I
FIG. 4. Composite section of soil deformation instpmenta- tion.
server was stationed in the tunnelling machine to record progress and mining procedure.
All subsequent surface observations were coordi-
nated with the tunnelling operation. At 01 :QO h on
Friday, 20 August, when the night shift ended, the face of the machine was 4.1 m east of tde cross section of settlement augers (settlement abger 5, Fig. 3). Tunnelling recommenced at 07:55 h the same day and by 15:40 h the face of the machine was 15 m west of settlement auger 5. There was some delay in the mining at this time and no night observations were taken. No mining was carried out during the weekend; but by 10:30 h on Monday morning the face of the tunnel had been advanced to 30 m west of auger 5. The rate of change of all observations was so small that the next full set of readings was delayed until 20 days after tunnelling (i.e., after 20 August). A further full set of readings was taken 23 July 1977, or almost 1 year after construction. All instruments have been protected and monitoring will be con- tinued for a 5 year period if possible.
Fig. 6. A settlement of 54 mm over the centre line of the tunnel was the maximum movement recorded throughout the instrumented section after 20 days. The remaining centre line augers 1-9 (Fig. 3) indi- cated deformations of 37-47 mm, with an average of 44 mm. Centre line settlements were minimum at augers 1 and 9 (i.e., on entering and leaving the
array) and increased to a maximum at auger 5. This
may be an indication of the disturbance caused by the instrument installation or may be coincidental (similar behaviour was not evident at array 1). Nevertheless, the detailed section shows the maxi- mum surface settlement recorded. In comparison, centre line surface settlements of 47-76 mm were recorded at array 1 (Belshaw and Palmer 1978).
The volume of settlement represented by the area
of the trough shown in Fig. 6, times a unit length, is
the maximum measured within the instrumented zone. It is about 7.5% of the corresponding total excavated volume of the tunnel and approximately equal to the volume of the tailpiece void. The mini- mum size trough may be estimated on the basis of a centre line deformation of 37 mm and would be about 5y0 of the total excavated volume. The ob- served trough is similar in size to troughs for tunnels in stiff clays reported by Peck (1969). Peck et al. (1969) show an average relation for trough width and subsidence, expressed as
where i = trough width (Schmidt 1969); a = radius
of tunnel; and zo = depth of axis of tunnel. For the
settlement trough shown (Fig. 6), i / a = 2.5 measured
versus 3.5 calculated, indicating a trough width ratio appreciably less than that experienced on the average. The sequence and distribution of vertical deforma- tion is illustrated in Fig. 7, where the observed move- ment of the magnetic extensometers over the centre line of the tunnel is combined with the obse~vations at auger 5 and plotted relative to the position of the face of the tunnelling machine. As the tunnelling machine approached any point a slight heave was observed. At the ground surface, settlement com- menced before the machine face reached the plane of
the point. At greater depths, such as 6 m, settlement
did not commence until after the face of the machine had reached the point. This indicates that a bowl or trough of settlement precedes the tunnelling opera- tion. After the tailpiece of the machine had passed any point, settlement progressed rapidly and was
Results and Discussion practically complete within 6 h (or within about 15 m
Soil Deformation of aavance). Approximately 60-70% of the settlement
The vertical soil deformation as indicated by was observed after passage of the machine tailpiece.
CAN. GEOTECH. J. VOL. 17, 1980
I
A P P R O X I M A T E GROUND S U R F A C E . ELEV 1 8 5 . 3 2w r I O . ~ !I,{ I,,! 1#,1 ill( i n , <
P E A T - 2 - - - -
- - - - --
--- --- S A N D - S I L T Y S A N D AG3 (183.61ll'k.
271u
VT4 VT5 aG6'183'371 A ~ ~ A (52 (183.89) ~ ~ ~ 5 6 ~ (183.98, . ~ ~ ~ 1183.06) (183. 731 459 V T 7 1183.731 AG5 1183.521 A SlO(183.92) S I L T Y v ~ 6 1183.461 C L A Y C L A Y v THOR P I E Z O M E T E R A GEONOR P I E Z O M E T E R A S O L I N S T P I E Z O M E T E R I R A D P I E Z O M E T E R ( 1 8 3 . 8 9 1 P I E Z O M E T R I C H E A D ( r n )FIG. 5. Composite section showing piezometers and piezometric heads after 1 year. S O U T H - N O R T H
D I S T A N C E FROM 6 OF TUNNEL. m
::
1
'AFTER 20 D A Y S 100FIG. 6 . Surface settlement along line through settlement auger 5.
increased less than 15%, whereas at array 1 the settlement after 1 year increased almost 100% (Belshaw and Palmer 1978). There were two major differences between arrays 1 and 2. The first was the thickness of the clay cover, which was 1.2 m at array 2 versus about 3.5 m at array 1. There was, therefore, appreciably more clay to be remoulded and recon- solidated at array 1. The second difference was that
the mining of the tunnel commenced 90 m from
array 1. Consequently the contractor had very little tunnelling experience with the new machine and lining technique when the machine entered the in- strumented area. Alignment difficulty and grouting problems were noted by the engineer observing the tunnelling operation as the machine passed through array 1. These factors probably combined to remould the clay significantly in the vicinity of the tunnel at array 1, leading to increased long-term settlement.
The magnitude and distribution of lateral deforma-
tions are shown in Fig. 8, where observations from
-
:
the slope indicator installations are combined with vertical deformation data and plotted as apparent
displacement vectors. Very little deformation oc-
- -
curred beneath the depth of the tunnel invert and all major deformation took place very close to the tunnel alignment.
Pore-water Pressure Changes
The change in pore-water pressure as tunnelling proceeded is illustrated in Fig. 9. As the machine approached the plane of the piezometer, the pore-
PALMER AND BELSHAW
D I S T A N C E T O T U N N E L F A C E , rn
211,
-7
a 5 1 0 1 5 2 o 23 30I ! I I I 1
SETTLEMENT AUGER NO. 5
o MAGNETIC EXTENSOMETER D AT 4.5 rn a MAGNETIC EXTENSOMETER D AT 6.0 m o MAGNETIC EXTENSOMETER D A T 7.6 rn h0
-
a MAGNETIC EXTENSOMETER D A T 8 . 2 m-
6 3 0 3 ".."
RELATIVE MI\CHIN€ LOCATIONFIG. 7. Vertical soil displacement over centre line of tunnel.
6 T U N N E L of the machine was about 9-10 m bevond the loca-
I
A P P R O X I M A T E G R O U N D S U R F A C E I , , / l l , i 11, / / P E A T S A N D - S l L T Y S A N D S I L T Y C L A Y - C L A Y 0 4 0 8 0 rnm D I S P L A C E M E N T )I+\ 0 1 2 3 i n H O R I Z O N T A L & O V E R T I C A L 0urn
5 10 ItFIG. 8. Displacement vectors in vertical plane perpendicular to tunnel axis (after 20 days).
water pressure within 1 m of the tunnel increased by about 40 kPa or about 10%. As the machine passed the piezometer, the pressure rapidly decreased by as much as 40% and reached a minimum when the face
tion. Subsequently, the pore-water pressures gradu- ally increased, but indicated a small net decrease after 10 months.
It was anticipated that the tunnel might act as a drain and that a long-term flow net could be deter- mined from the measurements of the piezometer array. Net changes were very small. The measured hydrostatic head at each piezometer after approxi- mately 1 year is shown in Fig. 5. The head shown for piezometer T1 is based on the change in pressure rather than on the measured head because the zero reading of the piezometer shifted during installation and recalibration was not possible. Piezometer S9 was destroyed by vandals (physically pulled out), and several of the other piezometers were damaged, but readings still appeared to be reliable. A crack that developed in the tunnel lining at piezometer I23 was never completely sealed, so that the-water pressure measured there should be regarded as low. Piezom- eters I21 and I22 are more reliable. Piezometer I24 was loosened and the wires were cut off during tunnel cleanup; it was removed and returned to the labora- tory for a calibration check and observation of long- term zero drift. The data in Fig. 5 indicate a minor drawdown in the tunnel vicinity, although substanti- ally less than would be predicted for a clay having an isotropic permeability.
It is considered that permeability in the tunnel vicinity may have been affected by the construction procedure. As tunnelling proceeded, a clay grout was injected into the tailpiece void. At the same time, the soil immediately adjacent to the tunnel must have
CAN. GEOTECH. J. VOL. 17, 1980
D I S T A N C E F R O M P I E Z O M E T E R TO F A C E .OF T U N N E L , m
$ T U N N E L
PIEZOMETER LOCATION RELATIVE TO TUNNEL
FIG. 9. Change in pore pressure during tunnelling operation.
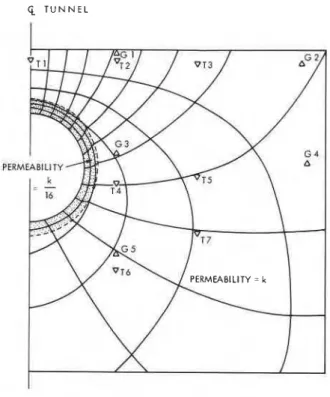
FIG. 10. Hypothetical flow net in clay.
been disturbed and partially remoulded. If it is arbitrarily assumed that the net effect of the two operations is to create a zone 0.3 m thick with a permeability reduced by a factor of 16, then the flow net in the clay would be distorted as shown in Fig. 10. The pore-water pressure drops determined for each piezometer on the basis of Fig. 10 are close to but still
greater than those actually measured in the field. This suggests that either a thicker or a more impermeable layer must exist adjacent to the tunnel.
Tunnel Lining Instrumentation
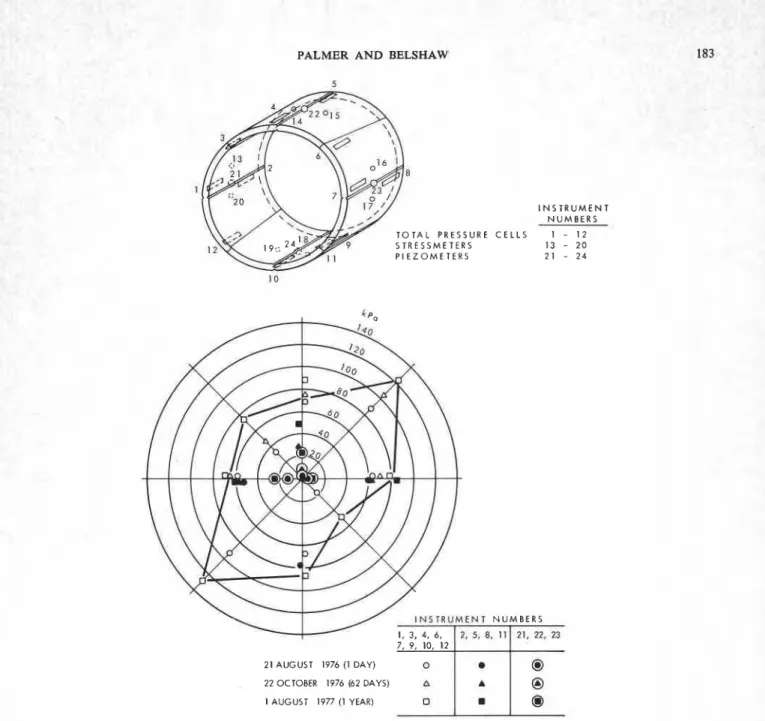
The location of all transducers in the instrumented ring of lining is shown in Fig. 11. In general, the pressure cells performed very well, except for zero stability. A prototype pressure cell and two of the piezometers used to construct the pressure cells are being monitored in the laboratory. Observations have shown that the zero reading of the piezometers gradually changes with time. The shift is of the order of 0.02 kPa apparent pressure increase per day. Piezometer I24 when recovered after 1 year had a zero shift of about 0.01 kPa per day, The pressure readings shown in Fig. 11 have not been corrected for zero shift and should be regarded as the maximum probable pressure at each cell. Although the lead wires to all instruments in the tunnel invert were cut during tunnel cleanup, cells 9, 10, and 12 were rewired successfully.
After a year's observation the total pressure on the
-
-
lining was approaching uniformity, except on the diagonal through cells 6 and 12. These will be ob-served in the long term to see whether pressure redis- .
.
tribution does occur. Although the pore-water pres- sure tended to increase with time, the total pressure on the lining was still very low after 1 year. In gen- eral, the total pressure distribution on the lining at array 2 was more uniform than that recorded at array 1 (Belshaw and Palmer 1978), but the average pressure measured was about the same at each array. The stressmeter installations were unsuccessful,
PALMER AND BELSHAW' 5 a 1 T O T A L PRESSURE STRESSMETERS P I E Z O M E T E R S CELLS I N S T R U M E N T N U M B E R S 1 - 12 13 - 2 0 21 - 2 4 7; 9;
:,
i 2 i ':.
':'
21 AUGUST 1976 (1 DAY) 22 OCTOBER 1976 (62 DAYS) I AUGUST 1977 (1 YEAR) 0FIG. 11. Instrumentation in lining and pressure data.
-
-
because it was impossible to achieve positive seating of the instruments in the concrete lining. Although the magnitude of stress could not be determined the-.
stressmeters did indicate that during thrusting on the instrumented ring the stress in the lining was approxi- mately uniform, of the order of 1.4 MPa. This is equivalent to a total thrust of about 1.2 MN applied to the lining to advance the tunnelling machine.Conclusions
Detailed observations of soil deformation, pore-
water pressure changes, and total pressure on the tunnel lining indicate the following:
(1) Use of a tunnel boring machine together with a precast segmented concrete lining, which acts as both primary and secondary support, has been con- firmed as a successful tunnelling procedure in soft to firm clay.
(2) The magnitude and extent of the surface settle- ment trough in the instrumented area were less than those normally observed for tunnels in similar soils. The volume of the surface trough was about 5-73% of the excavated volume of the tunnel.
184 CAN. GEO TECH. J. VOL. 17, 1980
(3) Approximately 85% of the measured settle-
ment occurred within 6 h after the face of the tunnelling machine passed the plane of the measuring point. During this time the tunnel was advanced about 15 m ; 60-70% of the deformation occurred after the tailpiece of the tunnelling machine passed the point.
(4) Vertical deformation over the centre line of the
tunnel increased by less than 15% during the first year following construction. It is suggested that this small amount of additional settlement, in contrast with the nearly 100% increase observed for an earlier array of instrumentation, is a result of a combination of reduced thickness of clay above the tunnel and of more experience with the construction- technique.
(5) Pore-water pressures near the tunnel increased as the tunnelling machine approached, decreased as it passed, and then gradually increased again. Readings taken after 10 months indicated a small net decrease in pressure compared with the original values.
(6) The observed piezometric heads in the vicinity of the tunnel after construction indicated that drain- age was toward the tunnel. The extent of the draw- down indicated that there was a zone of soil around the tunnel in which permeability must have been much less than that in the undisturbed soil.
(7) Total pressures (as measured) acting on the
tunnel lining were not uniform, but tended toward uniformity in the first year of observations. The aver- age pressure was about the same as that reported for
a previous array of instrumentation, i.'e., about one
half of the overburden pressure.
Acknowledgements
The instrumentation program was funded in part by the Corporation of the City of Thunder Bay through R. V. Anderson Associates, Ltd., consulting engineers for the project, in part through a contract between the Department of Supply and Services of
Canada (DSS) and Morton & Partners Limited, and
in part by the Division of Building Research of the National Research Council of Canada.
Morton & Partners Limited were contract man-
agers for the project and the Division of Building Research was the scientific authority for the DSS
contract. R. V. Anderson Associates, Ltd. supplied ,*
personnel for some of the field work and provided the necessary project liaison.
This project could not have been undertaken with-
out the permission and cooperation of the Corpora- t
tion of the City of Thunder Bay, the general con- sultant, R. V. Anderson Associates Ltd., and the general contractor, Mole Construction Co. of Cleve- land, Ohio and Thunder Bay. In addition, the cooperation of the tunnel boring machine manufac- turer, Lovat Tunnel Equipment Inc., Toronto, On- tario, and the segment fabricators, Pre-Con Ltd., Brampton, Ontario, is gratefully acknowledged.
This paper is published with the approval of (a) the Director of the Division of Building Research, National Research Council of Canada, (b) the City of Thunder Bay, (c) R. V. Anderson Associates, Limited, and (d) Mole Construction Company.
BELSHAW, D. J., and PALMER, J. H. L. 1978. Results of a program of instrumentation involving a precast segmented concrete-lined tunnel in clay. Canadian Geotechnical Journal, 15, pp. 573-583. (Also available from the National Research Council of Canada, Division of Building Research, NRCC 1701 1.)
MORTON, J. D., DUNBAR, D. D., and PALMER, J. H. L. 1977. Use of a precast segmented concrete lining for a tunnel in soft clay. Geotechnical aspects of soft clays. Proceedings, International Symposium on Soft Clay, Bangkok, pp. 587-598. (Also available from the National Research Coun- cil of Canada, Division of Building Research, NRCC 16360.)
PECK, R. B. 1969. Deep excavations and tunnelling in soft ground. Proceedings, 7th International Conference on Soil Mechanics and Foundation Engineering, State of the Art Volume, Mexico City, Mexico, pp. 225-290.
PECK, R. B., DEERE, D. U., MONSEES, J. E., PARKER, H. W.,
and SCHMIDT, B. 1969. Some design considerations in the selection of underground support systems. U.S. Department of Transportation, Contract 3-0152. Published by the National Technical Information Service, Springfield, VA. SCHMIDT, B. 1969. Settlements and ground movements associated with tunnelling in soil. Ph.D. thesis, University