Publisher’s version / Version de l'éditeur:
Canadian Acoustics, 29, September 3, pp. 102-103, 2001-09-01
READ THESE TERMS AND CONDITIONS CAREFULLY BEFORE USING THIS WEBSITE.
https://nrc-publications.canada.ca/eng/copyright
Vous avez des questions? Nous pouvons vous aider. Pour communiquer directement avec un auteur, consultez la
première page de la revue dans laquelle son article a été publié afin de trouver ses coordonnées. Si vous n’arrivez pas à les repérer, communiquez avec nous à PublicationsArchive-ArchivesPublications@nrc-cnrc.gc.ca.
Questions? Contact the NRC Publications Archive team at
PublicationsArchive-ArchivesPublications@nrc-cnrc.gc.ca. If you wish to email the authors directly, please see the first page of the publication for their contact information.
NRC Publications Archive
Archives des publications du CNRC
This publication could be one of several versions: author’s original, accepted manuscript or the publisher’s version. / La version de cette publication peut être l’une des suivantes : la version prépublication de l’auteur, la version acceptée du manuscrit ou la version de l’éditeur.
Access and use of this website and the material on it are subject to the Terms and Conditions set forth at
Measurement of structural intensity on plate structures
Schoenwald, S.; Nightingale, T. R. T.
https://publications-cnrc.canada.ca/fra/droits
L’accès à ce site Web et l’utilisation de son contenu sont assujettis aux conditions présentées dans le site LISEZ CES CONDITIONS ATTENTIVEMENT AVANT D’UTILISER CE SITE WEB.
NRC Publications Record / Notice d'Archives des publications de CNRC:
https://nrc-publications.canada.ca/eng/view/object/?id=89268943-12f7-4b5c-8beb-df04e7e03b9f
https://publications-cnrc.canada.ca/fra/voir/objet/?id=89268943-12f7-4b5c-8beb-df04e7e03b9f
Measurement of structural intensity on plate
structures
Schoenwald, S.; Nightingale, T.R.T.
NRCC-45021
A version of this document is published in / Une version de ce document se trouve dans :
Canadian Acoustics, v. 29, no. 3, Sept. 2001, pp. 102-103
MEASUREMENT OF STRUCTURAL INTENSITY ON PLATE STRUCTURES
Stefan Schoenwalda, Trevor RT Nightingaleb
a) Fachhochschule Stuttgart, Hochschule Fur Technik, Schellingstrasse 24, D-70174 Stuttgart, Germany b) Institute for Research in Construction, National Research Council, Ottawa, Ontario, Canada K1A OR6
INTRODUCTION
This paper provides a summary report of a recent project where a scanning laser vibrometer and specially developed analysis software were used to investigate structural intensity as a tool to study power flow in plate structures. In this paper the method will be used to examine the power flow in a rib-stiffened plate system where the rib is attached using a series of local connections formed by bolts. The number of equally spaced fasteners is changed from sixteen to four to determine if structural intensity can be used to identify line and point connected regimes of the junction.
MEASUREMENT SET-UP
The plate, rib and attachment method are the same as those used in an earlier NRC study1 to model plate/rib junctions. The plate and rib were fabricated from Plexiglas (density, 1191.3 kg/m3, Young’s modulus 4.59x10⁹ N/m2, and Poisson’s ratio 0.289) which approximates a homogeneous and isotropic medium. The plate had dimensions 2.41 x 1.25 x 0.0115 m, while those of the rib were 1.225 x 0.235 x 0.0187 m. The face of the rib that attached to the plate was machined flat and fastened so that it divided the plate into two 1.2 x 1.25 m sections using four or sixteen equally spaced fasteners.
The system was excited by an electrodynamic shaker located one of two positions. First, the rib was excited normal to its surface at a location 0.535 m from the bottom of the rib and 0.165 m from the plate. For this position the junction can be viewed as being a source for both portions of the plate. Second, The lower left portion of the plate was excited approximately 0.75m from the rib and 0.35 m from the bottom of the plate. For this excitation position, the junction can be viewed as a discontinuity blocking transmission to the other portion of the plate.
MEASUREMENT METHOD
The plate surface velocity was sampled using a scanning laser vibrometer (Polytec PSV 300) using a uniform grid of approximately 8000 points. Proprietary software developed at the NRC was used to compute the structural intensity vectors using both the two-point and thirteen-point methods. Since the location of sources can be identified by the direction of the intensity vectors, this paper is primarily concerned with resolving the direction. A comparison of the vector plots obtained from the two-point method (which measures only the moment component) and the thirteen-point method (which measures both the force and moment components) is excellent, and will not be presented here due to limited space. The nearfield may potentially affect estimates of the absolute intensity for distances less than 100 mm from a source or sink. However, it should not affect estimates of direction as only the ratio of the magnitudes in the x and y directions are needed.
Only a 600 mm section of the plate centred on the junction is shown in Figures 1 though 4. The vector plots and contour plots at 1000 Hz for the two-point method are shown on the left and right of the figures, respectively. The plate and rib can be considered as being thin since the transition to thick plate theory is well above 1000 Hz. Fastener locations are shown by solid dots.
MEASUREMENT RESULTS – RIB EXCITATION
Figure 1 shows the measured structural intensity of the plate when the rib is excited and attached to the plate using sixteen fasteners spaced 0.078 m on centre, which is less than one-half of the wavelength at 1000 Hz. The radiation pattern is quite symmetric
about the junction and at a distance of about 100 mm almost all
vectors are oriented normal to the junction axis. This behaviour is typical of a line source, indicating the junction is line-connected. It is also consistent with the generally accepted rule that discretely fastened junctions behave as if they were line-connected if the fastener spacing is less than one-half of a wavelength.
60 63 63 60 60 63 66 66 63 63 63 60 63 63 57 60 60 57 63 66 69 1.0 1.2 1.4 0.2 0.4 0.6 0.8 1.0 1.2 Y Coor di na te [m ] X - Coordinate [m] 1.0 1.2 1.4
Figure 1: Measured intensity vectors (left) and contour plot (right, magnitude in dB) of the Plexiglas plate due to excitation by a rib attached with sixteen bolts shown by the dots.
63 60 60 60 57 57 57 60 63 60 63 63 57 57 54 60 54 57 63 1.0 1.2 1.4 0.2 0.4 0.6 0.8 1.0 1.2 Y Co or di n a te [ m ] X - Coordinate [m] 1.0 1.2 1.4
Figure 2: Measured intensity vectors (left) and contour plot (right, intensity magnitude in dB) of the Plexiglas plate due to excitation by a rib attached with four bolts shown by the dots.
Near the mid-point of the junction the vectors tend to point toward the top the plate at an angle of 45 degrees. Examining the contour plot it can be seen that the vectors are flowing from a region of high intensity to low intensity centred around the seventh and eighth fastener from the top. This is likely due to differences in the degree of mechanical contact or modal properties of the rib that is exciting the junction. A detailed discussion is beyond the scope of this summary paper.
The contour plot indicates that there is significant variation in the intensity in the direction parallel to the junction while there is much less change in the direction normal to the junction. This may be caused by the modes of the rib.
Figure 2 shows the results when there are only four fasteners connecting the plate and rib. In this situation the spacing between the points is 0.390 m, which is approximately twice the wavelength in the plate. The radiation pattern is quite different from that exhibited when there are sixteen fasteners, as now each fastening point appears to be independent and can be clearly identified. Midway between the fastening points the vector field is somewhat random. Here the field is a superposition of fields of approximately equal intensity from the adjacent points and they will tend to sum to near zero in the y direction. The contour plot clearly indicates high intensity near the fasteners with considerably reduced intensity between them. Also the contours tend to be closed indicating that there is attenuation with distance in the x direction, something that was not readily evident when the junction was line connected with sixteen fasteners (Figure 1).
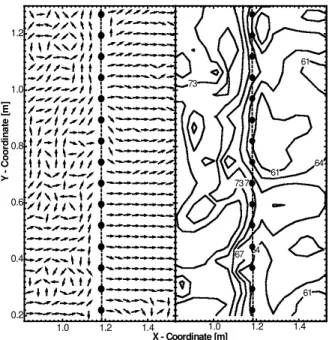
MEASUREMENT RESULTS – PLATE EXCITATION
Figure 3 shows the measured intensity when the left portion of the plate is excited and the rib is attached using sixteen fasteners. On this portion of the plate vector orientation changes with location and the resulting vector field is somewhat regular indicating the presence of modes. On the source side, near the junction, the vectors tend to be oriented parallel to the junction axis, indicating a significant portion of the incident intensity is reflected producing a near-zero intensity flow normal to the junction, the x direction.
On the opposite side of the junction the vectors tend to be oriented normal to the junction axis as they were when the rib was the source. The discontinuity in the intensity caused by the junction can be clearly seen in the corresponding contour plot.
Figure 4 shows the measured intensity when there are only four fasteners. Midway between the fastening points, the vector fields tend to be reasonably continuous across the junction. Close to a fastening point, the vectors tend to be disordered and on the left portion of the plate (containing the source) the vectors tend to point toward the fasteners indicating that they are sinks that take energy out of the system. Also, the vectors on the left side of the plate tend to be more ordered, indicating that the effective damping for this portion of the plate has increased so the direct field from the source is more dominant. This is consistent with more energy being transmitted across the junction. The contour plots clearly indicate the fastening points are in regions of low intensity, with regions of high intensity between them.
CONCLUSIONS
The results show that the orientation of structural intensity vectors can be a useful tool when studying the behaviour of junctions in homogenous and isotropic systems. However, energy sources are much easier to identify than sinks. Structural intensity vectors also showed that a plate rib junction with discrete fastening points will exhibit two types of behaviour - point or line-connected.
An investigation of the behaviour of the junction near the transition frequency is beyond the scope of this summary paper.
REFERENCES
1 Ivan Bosmans, and Trevor Nightingale, “Modeling vibrational energy transmission at bolted junctions between a plate and a stiffening rib,” JASA, Vol. 109, 2001, pp. 999-1009.
7370 67 64 64 73 61 61 61 1.0 1.2 1.4 0.2 0.4 0.6 0.8 1.0 1.2 Y Coor di na te [m ] X - Coordinate [m] 1.0 1.2 1.4
Figure 3: Measured intensity vectors (left) and contour plot (right, intensity magnitude in dB) when the Plexiglas plate is excited by a point source to the left of the junction.
67 70 73 73 70 73 67 64 73 70 70 67 70 61 61 67 70 1.0 1.2 1.4 0.2 0.4 0.6 0.8 1.0 1.2 Y Coor di na te [ m ] X - Coordinate [m] 1.0 1.2 1.4
Figure 4: Measured intensity vectors (left) and contour plot (right, intensity magnitude in dB) when the Plexiglas plate is excited by a point source to the left of the junction.