Publisher’s version / Version de l'éditeur:
Journal of the Acoustical Society of America, 77, 6, pp. 2094-2103, 1985-06
READ THESE TERMS AND CONDITIONS CAREFULLY BEFORE USING THIS WEBSITE.
https://nrc-publications.canada.ca/eng/copyright
Vous avez des questions? Nous pouvons vous aider. Pour communiquer directement avec un auteur, consultez la première page de la revue dans laquelle son article a été publié afin de trouver ses coordonnées. Si vous n’arrivez pas à les repérer, communiquez avec nous à [email protected].
Questions? Contact the NRC Publications Archive team at
[email protected]. If you wish to email the authors directly, please see the first page of the publication for their contact information.
NRC Publications Archive
Archives des publications du CNRC
This publication could be one of several versions: author’s original, accepted manuscript or the publisher’s version. / La version de cette publication peut être l’une des suivantes : la version prépublication de l’auteur, la version acceptée du manuscrit ou la version de l’éditeur.
Access and use of this website and the material on it are subject to the Terms and Conditions set forth at
Sound transmission loss: comparison conventional techniques with
sound intensity techniques
Halliwell, R. E.; Warnock, A. C. C.
https://publications-cnrc.canada.ca/fra/droits
L’accès à ce site Web et l’utilisation de son contenu sont assujettis aux conditions présentées dans le site LISEZ CES CONDITIONS ATTENTIVEMENT AVANT D’UTILISER CE SITE WEB.
NRC Publications Record / Notice d'Archives des publications de CNRC:
https://nrc-publications.canada.ca/eng/view/object/?id=ffe2af1c-9936-4032-a404-7f7e000668fe https://publications-cnrc.canada.ca/fra/voir/objet/?id=ffe2af1c-9936-4032-a404-7f7e000668fe--
Ser .-
. .
.-T M
-
N21d
National Research
Conseil national
f l @ o1299
1
$
Council Canada
da recherche. Canada
c. 2
l3TJ?3G Division of Division des
Building Research recherches en bgtiment
Sound Transmission Loss:
Comparison of Conventional Techniques
with Sound Intensity Techniques
by R.E. Halliwell and A.C.C. Warnock
Reprinted from
Journal of Acoustical Society of America Volume 77, No. 6, June 1985
p.
2094
-
21 03
ANALYZED
DBR Paper No.1299
Price $1.OO
NRCC 24689L I B R A R Y
4
lU?slJME
Les pertes de transmission du son dans un mur
Bsimple paroi
ont St6 mesurees dans une chambre reverberante, au moyen de
methodes conventionnelles
(ASTM
E90)et de la methode b a d e sur
l1intensitC sonore, introduife recemment.
L'echantillon est
place dans cinq positions differentes
Bl'interieur d'un tunnel
reliant les deux chambres reverberantes et des mesures sont
effectuees dans la plus petite des salles pour quatre
conditions d'absorption differentes.
Des differences
importantes ont 'et6 enregistrees entre les deux methodes,
Bbasses et
Bhautes frequences.
Les differences constatees 21
basses frequences sont attribuables
Bl'augmentation de
l'energie acoustique
3proximite des surfaces de la chambre de
reception (effet Waterhouse) et au fait que les methodes
d'essai normalisdes ne tiennent pas compte de ce phenornsne.
Lorsque l'effet
Waterhouse est integre
Bla formule
conventionnelle de perte de transmission, on en arrive
3une
meilleure concordance,
3basses frequences, des resoltats
obtenus par la technique de mesure conventionnelle avec ceux
obtenus par la technique bas6e sur llintensitC sonore.
Les
differences constatees
Bhautes frequences ne sont pas
expliqubes.
~
- - - - , . 9 --
- .- -Sound transmission loss: Comparison of conventional techniques
th sound intensity techniques
R. E. Halliwell and A.
C.
C.
WarnockNational Research Council of Canada, Division of Building Research, Montreal Road, Ottawa, Onti Canada K I A OR6
(Received 19 December 1984; accepted for public&ion 20 February 1985)
eneri cons conv the s note PAC zrio,
Sound transmission losses for a single layer wall are measured in a reverberation room facility using conventional methods (ASTM E90) and the more recently introduced sound intensity method. The specimen is placed in five positions in the tunnel between the two reverberation rooms and measurements are made for four different absorptive conditions in the smaller room. Significant differences between the two measurement techniques are found at low frequencies and at high frequencies. Low-frequency differences are attributed partly to the increase in sound
gy close to the surfaces of the receiving room (the Waterhouse effect) and the lack of any ideration of this in standard test methods. Inclusion of the Waterhouse term in the
entional transmission loss formula improves the agreement between the conventional and ound intensity mer t technique at low frequencies. High-frequency differences are :xplained.
:S numbers: 43.55.:
INTRODUCT IWIV
This paper compares transmission loss (TL) data for different room conditions and two measurement techniques: the conventional level difference method (CTL)1.2 and the newer technique based on measurements of sound intensity on the receiving room side of the partition (ITL).3 It is now comparatively simple to measure sound intensity thanks to advances in instrumentation and technology. Superficially the advantages of a direct measurement of sound intensity are many. In laboratories one can, in principle, measure sound transmission loss of complete partitions or only parts of them. The receiving room need only be a small nonrever- berant space instead of a large reverberant room with specif- ic acoustical properties. In buildings, the effects of different methods of construction might be studied with ease by mea- suring sound transmission through the various parts of a partition or the surfaces of a room. Before these benefits can be enjoyed, however, it is important to be aware of any disad- vantages of the sound intensity technique or of any differ- ences that might exist between the results it provides and those of the conventional method.
11. REVERBERATION ROOM DESCRIPTION
For wall TL measurements the two rooms used at the National Research Council of Canada have volumes of 65 and 250 m3. Both rooms are rectangular parallelepipeds with perturbations for test openings and have surface areas of about 100 and 245 m2, respectively. Volumes and surface areas vary with specimen thickness and position. Four loud- speaker systems mounted in corners of each room have inde- pendent random noise generators and power amplifiers. Nine GenRad 25-mm electret condenser microphones in each room are connected through a multiplexer to an ampli- fier controlled by computer. The larger room is equipped with rotating as well as fixed diffusers with panels measuring 2.4
x
1.2 m. Although the small room is similarly fitted, its rotating diffuser was not operated during these experiments. (Previous experiments in this laboratory have shown that having the rotating diffuser stationary during a transmission loss measurement increases the variance of the measured sound pressure levels but does not change the mean.) (Un- published data.) The test specimen normally sits on a wheeled frame in a fairly pronounced tunnel between the rooms (Fig. 1) and does not form a complete wall of eitherI. TEST SPECIMEN 2
Comparison measurements were made on a wall test
specimen constructed from 3-mm hardboard weighing 3.7 m3 FIG. 1. Cross section through
kg/m.2 Two 2.44 X 1.22-m panels and one 2.44 X0.61-m the wall specimen test opening
showing the five test positions in
panel were attached using self-tapping screws to a the tunnel. The specimen mount-
lightweight steel stud frame around the periphery of the test ing frame in the middle of the
opening, which measures 2.44 X 3.05 m, and the edges of 2.44m opening is not rigidly connected
the panels were connected together using screws. The whole to either test chamber.
assembly rested on 6-mm foam tape to reduce the solid con- tact between the specimen and the walls of the rooms; it was caulked and taped around the edges and at the joints to pre-
vent leaks. Damping for the panel was not measured. 4- - -1.22m-
-,
reverberation room. For these measurements, the test speci-
men was placed in five different positions, W1- W 5, in the
tunnel between the two rooms. For each position the small room absorption was changed using glass fiber batts to give four different absorptive conditions, A &A 3. The A 0 condi- tion corresponded to the room in its normal condition; i.e., reverberation times around 2 s, while the other three condi- tions had gradually increasing amounts of absorption added until the reverberation times were below 0.5 s in almost all bands. Table I gives some representative reverberation times for one wall position and four absorptive conditions. In each absorptive condition the TL was measured using the sound intensity technique as well as the conventional method.
Ill. MICROPHONE CALIBRATION
The use of multiple microphones in reverberation rooms enforces their calibration to eliminate errors due to differences in microphone sensitivity. For this the micro- phone response curves supplied by the manufacturer (Gen- Rad) were digitized and stored in the computer as levels rela- tive to the 1-kHz level. The response of each channel of the multiplexer amplifier was then obtained by measuring its response to several constant amplitude sine waves in each of the third octave bands. This step was necessary because high-pass filters, only nominally identical, had been inserted in some channels of the multiplexer. These responses were combined with the microphone response curves to provide an overall frequency response for each channel. System cali- bration for absolute level at all frequencies could then be
obtained by applying a Bruel and Kjaer (B & K) 4340 calibra-
tor to each microphone in turn and reading the 1-kHz level on the real-time analyzer described in the next section.
TABLE I. Reverberation times in a small room.
Absorption condition: A 0 A 1 A 2 A 3
Frequency (Hz) Reverberation time (s) in 65-m3 room
IV. CTL
.
MEASUI REMENT!CTL measurements were made using a Ger GR1921 real-time analyzer (RTA) and a computer trolled system. This instrumentation has a minimum
gration time of 0.1 s and a maximum sample rate of 10 HZ.
For very absorptive rooms this is too slow to measure rapid decays accurately. To circumvent this difficulty the 1/3-oct
band multifilter section of the GR1921 was (
bank of analog rms detectors with RC time c ms. An analog-digital converter sampled the
puts at 128 Hz and samples were added togetner to give an effective integration time of 1/32 s. This system was fast enough to follow the decay rates produced in the rooms. It was used to measure only decay rates in those inst?--. where the commercial instrumentation was too slow. SI pressure levels or decay rates were measured in the t octave frequency bands from 63 to 6300 Hz. The spectn
the source room was app with som
creased levels at high frec me difficl
met during sound intensity I ~ C I L L ~ pw Appendi
The CTL measurements were made in both directions, that is, with each room serving in turn as the source room. Nor- mally the 65-m3 room is the source room and this is called
the "forward" CTL. The "reverse" CTL measuremen
-
the 250-m3 room as the source room and the 65-m3 roo the receiving room. The measurement procedures we
accord with ASTM E901 except that the smaller of the L w u
rooms does not meet the current minimum volume require- ments of that standard. Appendix B discusses the origins of the room volume criterion in ASTM E90 and shows that it is somewhat arbitrary. The conventional measurement tech- niques used in these rooms appear to give reasonable results down to 125 Hz, the lowest frequency required by ASTM E90, and perhaps even below that.
roximatel luencies 1 measurer ly white , :O overco ---*..I..--
V. SOUND INTENSITY PROCEDURES
onstants I : detector r . . ..
.
iRad con- inte-.
- w I to a of 10 out- a A I - 0 ~ u n d hird- lm in e in- llties x A). t has Im as re in.
+-,AFor the ITL measurements, the larger room was used as the source room to give a better approximation to a diffuse incident sound field throughout the frequency range. Sound
intensity measurements were made with a B & K 3360 sound
intensity analyzing system. Each of the two microphones
were pressure calibrated with the B & K 4340 calibrator.
Two probe spacings were used to cover the frequency range of the measurements, 12 mm spacing for 63400 Hz and 50 mm for 500-6300 Hz, with the midpoint of the probe kept at 5 cm from the wall surface. Both sound pressure and intensi- ty were measured on the receiving side of the wall. Because of microphone phase mismatch and instrument noise, a limit must be placed on the permissible difference between sound pressure and intensity to ensure that sound intensity mea- surements are reliable. This limit, which depends on fre- quency, sets the usable range of the instrument. The nominal minimum range of the instrument is given in Ref. 4 and it was decreased for this work by 8 dB to ensure reliable mea- surements. If the difference between pressure and intensity exceeded this limit, then the measurement was flagged as unreliable. Initially 100 uniformly distributed probe posi- tions were used to sample the intensity at the surface of the 2095 J. Acoust. Soc. Am., Vol. 77, No. 6, June 1985 R. E. Halliwell and A. C. C. Warnock: Transmission loss comparison 2095
wall but com showed that 25 positions gave practi- cally identical resulcs with a negligible decrease in precision. This was not surprising since the specimen was an essentially uniform sheet of material. Even at the lowest frequencies measured, the intensity variations on the receiving room side were rather small. Spectra from the B & K 3360 were trans- ferred to a larger computer for processing.
It has been reported that sweeping the intensity probe manually over the surface of the specimen is equivalent to making measurements at fixed positions. Nevertheless, for this study it was decided to use the fixed point sampling method rather than thc :chnique to ensure the high- est repeatability.
VI. THEORETICAL BACKGROUND TO TRANSMISSION LOSS MEASUREMENTS
A. Conventional measurements
The equations for the conventional method of measur- ing transmission loss originate with workers such as Davis5 and B~ckingham.~ The analysis that follows is similar to that of Buckingham but has been changed slightly to empha- size certain points. If we begin with the assumption that the sound field in the room containing the source is perfectly diffuse, then the intensity per unit area incident on the parti- tion I, = (p2)
,
/4 poco, wherep, and c, are the density of air and sound speed in air, respectively, and (p2), is the mean square sound pressure level in the source room. Thus the rate of transfer of sound energy through the partition separating the two rooms is rS (p2) ,/4poc0, where r is the transmission coefficient of the partition of area S. r is defined as the ratio of transmitted to incident intensity. The rate of energy loss in the receiving room is given by (d /dt ) Jv2 p2 dV, where p2 is the energy density in the receiving room with volume V,, and is a function of position in the room. In the steady state these two rates will be equal giving rise to the equationIf we assume an exponential decay of energy in the receiving room with a time constant b, then the right-hand side of Eq. (1) becomes b Jv2 p 2 dV. With the further assumption that the integral can be replaced by V2(p2), /,o,,c; one has
Setting:
A = 4b V2/co
avera e of the
-1 1 1 - 1 1 rge sound pressure level there is a good measun mean energy in the room. It is not likely that the sounu uelu in a reverberation room will be approximately diffuse at all frequencies, especially at low frequencies where the speci- men dimensions become comparable to the wavelength of sound. Note however that in laboratory measurements of transmission loss, one actually measures sound decay rate in the receiving room, not room absorption. Measurements show that the spatial variance of decay rate in rooms is rela- tively small7 and, since any uncertainty in the magnitude of the mean decay rate is further reduced by taking the loga- rithm, it is unlikely that this term causes any serious error because of spatial variance. On the other hand, one obvious indicator of nonideal conditions is the observation of nonlin- ear decays, which occur most often at low frequencies. In such cases it is better to estimate decay rate from the early part of the curve, since it includes the effects of short lived modes that would not be significant later in the decay. This measure would be more consistent with the energy loss rate during the steady-state excitation when the noise reduction is measured.
Valid CTL measurements thus require that both the receiving room and the source room be diffuse, a condition which does not hold true at all frequencies in the smaller of the two rooms used in this work, especially for absorption conditions A 1-A 3.
B. Intensity measurements
If the sound field in the source room is diffuse, then the intensity incident on the partition is again I, = (p2) 1/4poco as for CTL measurements. Thus by measuring the mean sound pressure level in the central part of the source room, exactly as for conventional measurements, one can calculate the level of intensity incident on the partition. The direct measurement of sound intensity on the receiving side of the partition then provides enough information to calculate transmission loss without any consideration of the proper- ties of the receiving room, other than the requirement that the reverberant field level there does not invalidate the mea- surement. Thus, valid ITL measurements require that only the source room, the 250-m3 room, be "diffuse," a condition that is more likely to be satisfied over most of the frequency range because of the room size the diffusing elements, and the multiple loudspeakers.
(3) VII. RESULTS
and taking logarithms, one gets the familiar equation TL = L, - L2
+
10 log(S/A ), (4)where TL = transmission loss = 10 log,, (l/r); L
,
= mean sound pressure level in the source room; L,
= mean sound pressure level in the receiving room. A is identified as the room absorption and represents energy loss at all room sur- faces and throughout its volume.Note that for Eq. (4) to be valid, the sound field in the source room should be diffuse so that the expression used to calculate the energy incident on the partition is correct. The sound field in the receiving room must also be such that the
A. Intensity measurements
Possible errors associated with sound intensity mea- surements have been studied by several authors and can be found easily in recent literature.' In this application, one must ensure that errors due to the reverberant sound field in the receiving room are negligible. This can be achieved by using an anechoic chamber as the receiving room or by add- ing sound absorbing material to the room to reduce the level of the reactive field. Since the absorptive material was added in four stages in this work it is of interest to see what effects there are, if any, on the ITL values. Figure 2 shows, for wall position W3, the four ITL curves obtained for the different 2096 J. Acoust. SOC. Am., Vol. 77, No. 6, June 1985 R. E. Halliwell and A. C. C. Warnock: Transmission loss comparison 2096
rn
-
W3 A0 '--' W3 A1 +----+ W3 A2 40 m D cn' 30 1 Z El In=
20 =E Ln Z 4 E C 10 0 63 125 250 500 l k 2k 4k THIRD OCTAVE BAND CENTER FREQUENCY. HzF I G . 2. Sound transmission loss data obtained using the intensity technique for four absorptive conditions in the 65-m3 room and for wall position W 3 .
absorption conditions. In this figure, the results appear to agree very well with each other. The range in measured ITL values was about 45 dB and, since the main reason for this work was to compare CTL and ITL measurements, a refer- ence contour was created to reduce the range of the data displayed on plots and to facilitate comparisons. This refer- ence contour has a TL of 10 dB at 250 Hz and an ideal mass- law slope of 6 dB/oct up to 6.3 kHz. Above 6.3 kHz the effects of coincidence begin to appear. All subsequent plots, unless otherwise noted, are shown relative to this reference mass-law contour. Figure 3 shows the same data as Fig. 2 but drawn relative to the reference contour. It is now clear that there are differences between measurements in the A 0 condi- tion and in theA 1, A 2, andA 3 conditions, but they are small. Similar plots were obtained for each of the other four wall positions and one can conclude in general that any of the three conditions A 2 to A 3 are adequate for making ITL mea- surements. Under the A 0 condition the ITL values varied randomly with respect to the other conditions and the mea-
-4
c
63 125 250 500 l k 2k 4k THIRD OCTAVE BAND CENTER FREQUENCY. Hz
Ins were ly less a c ~ ceptable. For surement conditic apparent1
theA 0 condition where the receiving room is fairly reverber- ant, it was expected that ITL would be in error since reactive part of the field would contaminate the meas ments. However, since the measurement is made close tc wall surface the nearfield dominates and the errors are nc large as might have been expected. The difference beta sound pressure level and intensity level was larger than other three conditions by about 1 to 2 dB, but the differ( was still within the acceptable range. Nevertheless, meas ments made in condition A 0 are considered to be less able. From a practical point of view, it is encouraging to I
that one does not have to convert a reverberant receil room into an anechoic chamber to make ITL measureme
6. Comparison between ITL and C'
the ; ure- .I C I 1 b :nce
l
ure-1
reli- 1 note J ving :nts.The above results confirmed wnat nas alreaay t,
found by other
author^^*^"^:
the ITL technique gives apy ently reasonable results and good repeatability. The n point to consider is how well the results it gives for sol transmission loss agree with those from CTL measureme] Figures 4-6 compare ITL with forward and reverse C measurements for three of the five wall positions. For th ._.comparisons the "best" measurement conditions have been shown; i.e., ITL measured in condition A 3, the most absorp- tive receiving room, and CTL in condition A 0, the most re- verberant condition in the 65-m3 room.
These figures represent some of the more interesting data from this work. Recalling that the reference contour would be a horizontal straight line through zero on these plots, it can be seen that in general the ITL results are closer to this ideal case, particularly in wall position W3. It is only in the lowest two bands that there are significant departures from the reference contour. In contrast, CTL measurements show a different slope from the ideal 6 dB/oct case, approxi- mately 5 dB/oct. Alternatively, the ITL technique gives lower transmission loss values at low frequencies and higher values at high frequencies than does the conventional level
-
W1 I T L--
W1 FOR + - - - - + W1 REV + -8 I I I I 1 l l t l l l ' I 1 l J ~ l l , r 63 125 250 500 1k 2k 4kTHIRD OCTAVE BAN0 CENTER FREQUENCY. Hz
een )ar- lext *"A A 1 1 U nts. !TL lese
F I G . 3. Same sound transmission loss data as in Fig. 2 but drawn relative to FIG. 4. Comparison of CTL and ITL data for wall position W 1. The curve
an ideal contour with a slope of 6 dB/oct. Differences between theA 0 condi- labeled ITL is with absorptive condition A 3. The FORward and REVerse
tion and the more absorptive conditions, A 2 to A 3, are more apparent. CTL were obtained with absorptive condition A 0.
- 8 1 1 1 1 ~ L 1 1 r r l ' l l l l I l * l l r l
63 125 250 500 l k 2k 4k
THIRD OCTAVE BAND CENTER FREQUENCY, Hz
FIG. 5. Comparison of CTL and ITL data for wall position W 3 . The curve
labeled ITL is with absorptive condition A 3. The FORward and REVerse
CTL were obtained with absorptive condition A 0.
difference technique. This behavior is quite consistent for all sets of measurements and for both directions for CTL. The same kind of result can be seen in the work of Cops9 and others. 10.l'
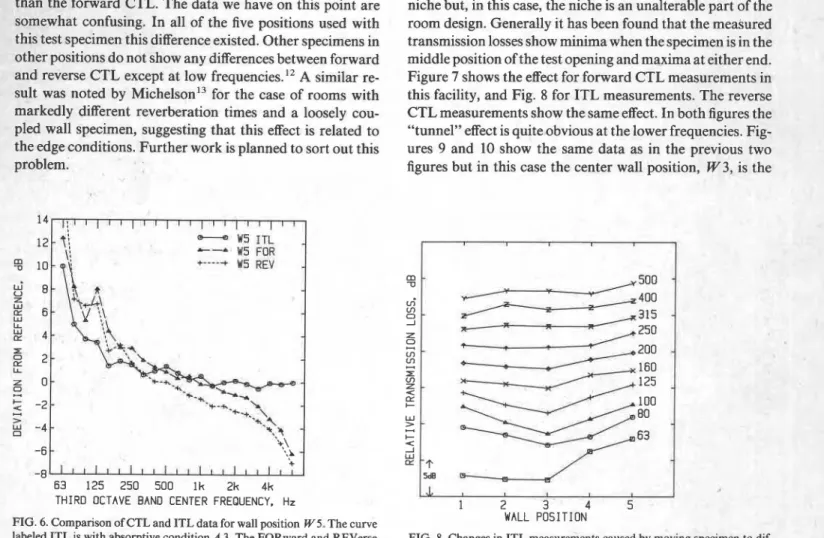
The other effect that is clear in these three figures is that the reverse CTL is consistently about 1 dB less in all bands than the forward CTL. The data we have on this point are somewhat confusing. In all of the five positions used with this test specimen this difference existed. Other specimens in other positions do not show any differences between forward and reverse CTL except at low frequencies.12 A similar re- sult was noted by Michelson13 for the case of rooms with markedly different reverberation times and a loosely cou- pled wall specimen, suggesting that this effect is related to the edge conditions. Further work is planned to sort out this problem.
-
-5 ITL '--* W5 FOR +----+ W5 REV - 63 125 250 500 l k 2k 4kTHIRD OCTAVE BAND CENTER FREQUENCY. Hz
FIG. 6. Comparison of CTL and ITL data for wall position W 5 . The curve labeled ITL is with absorptive condition A 3. The FORward and REVerse CTL were obtained with absorptive condition A 0.
1 2 3 4 5
WALL POSITION
FIG. 7. Changes in forward CTL measurements caused by moving speci- men to different positions. Low frequencies only.
C. Tunnel effect
Changing the position of the specimen in the test open- ing of a reverberation room suite such as this has been re- ported to cause changes in the measured CTL. l4 This effect
has been studied experimentally and is attributed to the pres- ence of a niche or tunnel on one or both sides of the specimen. Some studies investigated the effects of an artificially created niche but, in this case, the niche is an unalterable part of the room design. Generally it has been found that the measured transmission losses show minima when the specimen is in the middle position of the test opening and maxima at either end. Figure 7 shows the effect for forward CTL measurements in this facility, and Fig. 8 for ITL measurements. The reverse CTL measurements show the same effect. In both figures the "tunnel" effect is quite obvious at the lower frequencies. Fig- ures 9 and 10 show the same data as in the previous two figures but in this case the center wall position, W3, is the
u
L I1 2 3 4 5
WALL POSITION
FIG. 8. Changes in ITL measurements caused by moving specimen to dif- ferent positions. Low frequencies only.
63 125 250 5 0 0 l k 2 k 4 k THIRD OCTAVE BAND CENTER FREQUENCY. Hz
FIG. 9. Changes in forward CTL measurements caused by moving speci- men to different positions. Reference transmission loss curve is CTL data for wall position W3, the center position.
reference contour and high-frequency data are shown. These figures show that, as well as low-frequency differences, there are also differences in the transmission losses at the high frequencies. In particular, as the specimen moves deeper into the niche, the ITL values become significantly higher. In conventional transmission loss measurements one is actually measuring the properties of the combination of the specimen and the two niches on either side. The modal properties of the niches and the coupling through the specimen influence the results. In ITL measurements, the effect of the niche on the source room side will still be the same so it is to be expect- ed that there will still be some tunnel effect. As measure- ments on the receiving room side are to some extent free of the influence of the tunnel on that side, it is not surprising that the tunnel effects are somewhat different for the two measurement techniques. During measurements the tunnel surfaces were never covered with sound absorbing materials so that any resonance effects in the tunnel were not dis- turbed.
-4 1 1 1
63 125 2 5 0 5 0 0 l k 2 k 4 k THIRD OCTAVE BAND CENTER FREQUENCY. Hz
FIG. 10. Changes in ITL measurements caused by moving specimen to dif- ferent positions. Reference transmission loss curve is ITL data for wall posi- tion W 3, the center position.
eems littl other lab1 Dwer tran e doubt fi oratories smission nt a ure- and VIII. UISGUS3lVI
The differences between ITL and
CTL
results preseproblem for laboratories wishing to make standard meas ments on a commercial basis for comparison of systems for standard writing groups. There s
the results presented here and seen in in general ITL measurements give 1(
values at low frequencies and higher ITL values at the higher frequencies. In this case it results in a transmission loss curve that has a slope closer to the ideal predicted by the mass law. In cases where the sound transmission class (STC)15 is gov- erned by the transmission loss at low frequencies it is quite probable that an ITL measurement would give an STC value significantly lower than the conventional technique, espe- cially if the 8-dB rule applied in the lowest test bands.
In considering explanations for the difference between
the ~ T L and the CTL technique, it is worth noting that one
has to make fewer assumptions when using the intensity technique. The incident sound field is assumed to be approx- imately diffuse in both techniques and, for these measure- ments, is the same field. No assumptions need be made about the sound field in the receiving room; one must only ensure that the residual reverberant part of the field does not invali- date the measurement of intensity. The measurements show that this apparently was not a serious problem even in the most reverberant condition of the 65-m3 room, A 0. If the specimen transmission loss is very small and the receiving room is too reverberant, then the intensity measured at the specimen surface will be reduced because of the fraction of the reverberant sound energy being transmitted back into the source room. This results in a small error component in the measured intensity which will be approximately
(TL
-
10log S / A )dB below that being transmitted from thesource room directly. When this term is about 6 dB, then the error in the measurement of TL will be about 1 dB. Obvious- ly this effect is part of the low-frequency discrepancy but it is not the major cause. In the A 3 condition the error in the measured TL is about 1 dB in only the bottom few bands. Some calculated correction for this effect might have been introduced but this was not done because there are too many underlying assumptions about the sound field in the receiv- ing room for it to be accurate, especially in the cases where the room is very absorptive.
On further examination, Sec. VI A provides some in- sight into the reasons for the discrepancies among ITL and CTL measurements in both directions. The fundamental principle for the analysis presented there is that, in the steady state, the energy flow through the partition is balanced by the energy loss in the receiving room. Waterhouse16 pointed out that in a reverberation room there is an increase in the energy density at the surfaces, at the junction of surfaces, and in the corners because of the interference between the incident and reflected waves. Thus, estimates of total room sound energy based on measurements of sound pressure lev- el in the central portions of the room will be too low. As a result of his work, sound power measurement standards now
include a correction for this effect. ",18 The mean sound level
in the room is corrected by the addition of a term
10 log,, (1
+
SA /8V), where2 is the wavelength of sound atrom that loss
r of the ba nd. In the : case of cc
t frequencj
sound transmission loss measurements one is also interested
in measuring the total energy in the receiving room, so the Waterhouse correction should be applied to the sound pres- sure level measurements made there. It is not correct to ap- ply the correction to the measurements in the source room for in that case one wants to know the incident sound intensi- ty or incident sound power. The normal derivation of the analytical expression for sound transmission loss includes both incident and reflected waves in the analysis so that the increased sound energy due to interference at the surface is
utomatically accounted for.
In principle, the Waterhouse correction can account for ome of the differences between forward and reverse CTL measurements at low frequencies in these rooms as well as the difference between ITL and CTL results. When the cor- rection term is applied in the receiving room to each of the CTL measurements, the data presented in Figs. 4-6 become altered to those in Figs. 11-13. The agreement between the three types of measurement has been improved significantly ~t low frequencies, although there are still differences between them probably partly due to intensity transmitted back into the source room. Present sound transmission loss tandardsl.' do not include any correction term to be applied o sound pressure levels in the receiving room. If a correction
s applied in sound transmission loss standards, then it fol-
ows that it should also be applied in other standards such as
ASTM E492,19 I S 0 140/VI,20 and the field versions of these
standards. While it seems evident that some kind of correc- tion for increased energy close to the room surfaces should be included in the standard formula, Eq. (4), it is not certain that the Waterhouse correction will be adequate in all cases. At those low frequencies where the correction becomes sig- nificant, many reverberation rooms will not have a uniform sound field in their central portions because of interference between room modes and possible influence of the nearfield of the specimen. Calculations for the ideal case of a point source in a rectangular parallelepiped are straightforward
-
W1 ITL--.
w1 FOR m 0 10 W 1 REV + -81 1 1 1 1 1 1 1 1 1 1 ' 1 1 1 1 1 1 1 1 ' 1
63 125 250 500 l k 2k 4k THIRD OCTAVE BAND CENTER FREQUENCY. Hz-
W3 ITL--
W3 FOR +----+ W3 REV-8
63 125 250 500 l k 2k 4k THIRD OCTAVE BAND CENTER FREQUENCY. Hz
FIG. 12. Comparison of CTL and ITL data for wall position W 3. The curve labeled ITL is with absorptive condition A 3. The FORward and REVerse CTL were obtained with absorptive condition A 0 and are corrected in each case for the Waterhouse effect.
and interesting but will probably not apply to real rooms with their large specimens, tunnels, rotating and fixed diffus- ers, nonparallel walls, and other geometrical perturbations. More research is needed to find out how best to sample the sound field in a room to estimate the total sound energy in it. Present reverberation room standards require users to avoid the room surfaces and corners. It might ultimately prove better to include such regions in a complete survey of the room so that the total energy is known more precisely. On the other hand, until such research is done, the Waterhouse correction is better than no correction at all.
Considering only the practical aspects of making stan- dardized sound transmission loss measurements in a labora- tory, ITL procedures offer no advantage over CTL proce- dures where a fully automated system is in operation. In the latter case almost no operator intervention is necessary once the test has been initiated. In contrast with this, the ITL
12
--
W5 FORm +---*+ W5 REV
- ~
THIRD OCTAVE BAND CENTER FREQUENCY. Hz
FIG. 1 1. Comparison of CTL and ITL data for wall position W 1, The curve FIG. 13. Comparison of CTL and ITL data for wall position W5. The curve
labeled ITL is with absorptive condition A 3. The FORward and REVerse labeled ITL is with absorptive condition A 3. The FORward and REVerse CTL were obtained with absorptive condition A 0 and are corrected in each CTL were obtained with absorptive condition A 0 and are corrected in each
case for the Waterhouse effect. case for the Waterhouse effect.
procedures require an operator to place me microphone in many positions or sweep it over the surface of the specimen. Although the sweep could be automated, it would still usual- ly be done for at least two microphone separations to ensure accurate measurements over the entire frequency range. Sampling the surface of a test specimen can obviously be a valuable diagnostic procedure but in a laboratory situation where the transmission loss for a system is required for com- parison with other systems, one has to be sure that the entire surface has been sampled uniformly and that no weak spots or leaks have been overlooked. It is conceivable that an out- wardly uniform specimen could have areas that transmit much more strongly than others and that these areas could be sampled incorrectly leading to an erroneous transmission loss value. A carefully written standard measurement proce- dure could perhaps deal with this problem. However, the reverberant receiving room in conventional test procedures automatically performs integration of the sound energy coming from the test partition so that many of these prob- lems disappear. In addition, the calibration procedures in ITL measurements are more difficult than in CTL measure- ments.
The situation is different when one considers the design and construction of a new reverberation room facility for making sound transmission loss and other acoustical mea- surements. Conceptually, instead of a three room suite to deal with wall and floor specimens, one needs only a single large reverberant room with two or more openings for the insertion of wall or floor specimens. The room could be large enough to be used for sound power and sound absorption measurements and the vertical walls could provide at least two or three wall test openings. The ceiling could provide enough space for perhaps two floor test openings. Because the ITL procedures do not require large, reverberant receiv- ing rooms but only a relatively absorbent and quiet space, the receiving spaces could be quite small. This work shows, how- ever, the importance of the depth of the specimen mounting fixture even when transmission loss measurements are made using sound intensity techniques, because ITL is still mar- kedly influenced by wall position. A comparison of the eco- nomics of such a scheme with those for a traditional three room suite may be interesting but is beyond the subject area of this paper.
Note added in prooj No explanation was given for the
discrepancy between the ITL and CTL at high frequencies. It was realized in retrospect that much of this difference could be due to the finite difference error which results when the microphone spacing used for ITL is large compared to the wavelength. The expected error at 6.3 kHz would be 1.6 dB for the case of a plane wave. This is a reasonable estimate for the A 3 case when the receiving room is essentially ane- choic but would not be true for a more general case. This additional source of error serves to highlight the difficulties encountered when trying to use Sound Intensity Techniques for Transmission Loss measurements. To adequately cover the frequency range used here, keeping the errors below 0.5 dB, requires that three different microphone spacings be used. If the B & K 3360 sound intensity analyzing system is used, it also means that the highest frequency bands must be
Thus, at
measured I using I/ the frequ cies where the signal is weakest because of a high transn sion loss, it is necessary to use microphones which red1 sensitivity. This can hardly be considered to be an optimi solution.
ACKNOV YLEDGM ENTS
We are grateful to J. Kopec, Riverbank Acoustica~ Lab- oratories, and T. J. Schultz who supplied the references for the material in Appendix B. Discussion of the results of this work with J. Roland, CSTB,
reminded us of the importan thank also our colleagues in 1
for numerous stimulating arguments. 1 m s paper is a con bution from the Division of Building Research, National I search Council Canada and is published with the approva the Director of the Division.
France, v ce of the the Noise L - rere very 1 Waterhou and Vibri mL:- lseful and Ise effect. ' ition Sect . - - - - .. en-
APPENDIX A: SOURCE SPECTRUM EFFECTS ON TRANSMISSION LOSS
Ihe ,
We ion
Some practical difficulties were encountered with instrumentation when measuring sound intensity on the ceiving room side of the wall. The combination of sou room spectrum, approximately white, and the wall tranr function produced an intensity spectrum that decreased pidly as frequency increased. This, together with the fun mental limitations of the digital processing in the B &
3360, meant that it was not possible to measure all bai simultaneously since some of the high-frequency intenr levels fell below the measuring range of the instrument. C simple remedy for this is to shape the spectrum in the SOU room so that the received intensity spectrum is approxima ly flat or at least does not exceed the limits of the instrument. For this specimen it was only necessary to increase the high- frequency levels in the source room, but more shaping would be necessary for a test specimen with a more complicated transmission loss spectrum. An alternative procedure that is perhaps more convenient, since two microphone separations would often be used, is to excite the source room with sound that is limited to the bands being measured. Even with this limitation, however, there still exists a possibility of exceed- ing the limits of the instrumentation and it is necessary to consider the possible bias introduced by using source spectra that are "whiter than white."
The use of l/f or pink noise as a source signal is com- mon in acoustics when a system response is to be obtained in 1/3-oct bands. It can be argued however that it is incorrect to use pink noise as the source spectrum in transmission loss because this will introduce some bias in the measurements. The definitions given in ASTM C63421 for sound transmis- sion coefficient and sound transmission loss make no men- tion of the bandwidth of the signal being considered and, in practice, TL is obtained for different bandwidths. It is rea- sonable to assume that the definitions apply at single fre- quencies and that single frequency values should be integrat- ed over the required bandwidth to get the final value. Thus at a given frequency f the transmission coefficient may be de- fined as the re- .- - .rce rfer ra- a%
....
; K nds city )ne rce lte-where I,, and Ii, are transmitted and incident intensity, respectively, and r is the transmission coefficient. It follows
that:
wl ~d f 2 are the lower and upper passband frequen-
c i h IUL t ~lilter. In practice with 1/3-oct band instrumenta- ;
tion one usually measures JI,, df and JIin,
df
and calls theratio of these two quantities the transmission coefficient for the band. This is only strictly correct if IinC (f) is constant for allf, i.e., white noise. The difference between a white noise source and pink noise source might be expected to be negligi- ble for 1/3-oct bands since the difference in level at the two extremes of the filter bandwidth is only 1 dB in theory, and in practice the convolution of source spectrum with speaker and room response would make it difficult to distinguish between them. If it becomes necessary to use source spectra that increase in level with frequency, however, then possible bias errors introduced by the different noise source spectra, wall transmission loss spectra, and the non-negligible energy transmission outside the passband of a real filter should be investigated. These possible errors are most easily investigat- ed numerically.
Three types of 1/3-oct band filters were simulated nu- merically: a perfect filter with infinite attenuation outside of the passband, a minimum ANSI class I11 filter, and a mini- mum ANSI class I1 filter. To model the transmission loss of the wall the TL characteristic was assumed to vary as f
'.
The spectrum of the source was assumed to vary as f".
(A source exponent of - 1 corresponds to pink noise, 0 to white noise, and the higher values of s to spectra that increase in energy with frequency. Similarly, a wall exponent of - 2 corre- sponds to an ideal mass-law characteristic.) A center fre- quency of 100 Hz was chosen for the filter for convenience and the wall was assumed to have a TL of 30 dB at the band center. Integration was carried out from three octaves below the band center to three octaves above the band center. Al- though specific values were chosen to simplify the calcula- tions, because of the functions chosen and the fact that one is dealing with a logarithmic frequency scale, the results will have general application.The data showed that for filters with performance equal to Class I11 or better there were no differences from the ideal
P case greater than
+
0.6 dB. For the class I1 filter, the errorbecame greater than 1 dB when t
+
s < - 7. The same calcu- lations applied to walls with transmission coefficients that increased with frequency (t positive) showed errors greater than 1 dB when t+
s>6 with class I11 filters, and when1
t+
s>4 with class I1 filters. Positive values o f t correspond to wall transmission loss characteristics that decrease very rapidly with frequency, a most unusual occurrence except in the region of resonant dips in the curve. Thus, for most prac- tical purposes the use of spectra with enhanced high-fre- quency content is not likely to introduce any serious bias errors to the measurements.APPENDIX B: MINIMUM ROOM VOLUME REQUIREMENTS
Current versions of ASTM standards dealing with re- verberation room measurements require that the minimum room volume be greater than 4A 3, whereA is the wavelength of sound at the center of the lowest third-octave band, where measurements are to be made. It is instructive to examine the source of this criterion, especially considering the fact that comparable I S 0 standards2p20 do not make use of this crite- rion and allow lower room volumes.
The 4A criterion is a development of the requirement that the reverberation room should be large enough to con- tain at least 20 eigenmodes in the lowest measurement band. This statement appears in Chap. 8 of Ref. 22. An expression for the approximate number of modes in a frequency band A
f
wide is quoted that is essentially the same as those given in other
reference^.^^
An approximate expression for an octave band is then derived and attributed in a footnote to R. J. Wells. Because the bandwidth is one octave, the criterion becomes V>4A 3/3 rather than V>4A 3.The same criterion was then published in ANSI S1.2 - 196224 in virtually the same form. Again the require- ment was stated for an octave band and no reference was given to justify the choice of 20 modes and not some other number. A footnote says, however, that for narrower band- widths, larger room volumes are required. Thus for 1/3-oct bands the requirement becomes V>4A '. The idea that the minimum required room volume depends on measurement bandwidth was actually used in ASTM E336 - 7725 which
allowed measurements in smaller rooms if the analysis band- width was one octave wide instead of one-third of an octave. For example, a room could have 20 modes in the 100-Hz-oct band and would thus be acceptable for measurements in oc- tave bands down to this frequency. The same room would not be acceptable for measurements in 1/3-oct bands. Obvi- ously three 1/3-oct band measurements could be added to- gether to form the same octave band result, so the criterion suggests that three unsatisfactory measurements can be combined to form a single satisfactory one, yet nothing phys- ical has changed.
The application of the 20-mode requirement gives smaller minimum room volumes than the approach used by S ~ h r o e d e r ~ ~ and Schroeder and Kuttruff7 which considered the statistical separation between modes and the modal over- lap due to room absorption to arrive at a criterion for a rever- beration room to which statistical theories could be applied, in other words a good approximation to a diffuse sound field. It should also be noted that ANSI S 1.2 is now obsolete, and ANSI S 1.3 1 1 l7 simply provides a table of preferred mini-
mum room volumes. A volume of 200 m3 is recommended for measurements down to 100 or 125 Hz.
The 20-mode criterion is more stringent in the low-fre- quency bands than it is in the higher bands because the band- width of 1/3-oct band filters decreases with decreasing fre- quency. Thus at low frequencies the criterion imposes a smaller mean separation between modes and the room re- sponse is required to be smoother at low frequencies than at high frequencies-an inconsistency.
Low-frequency measurements in rooms are difficult to 21 02 J. Acoust. Soc. Am., Vol. 77, No. 6, June 1985 R. E. Halliwell and A. C. C. Warnock: Transmission loss comparison 2102
t and havc : doubtful I validity. It is not cl lear, howc interpre
just what the acceptable minimum volume for a particular type of measurement should be. The equations used to derive the 4A requirement are derived from eigenmode theory for a rectangular room. In real rooms the situation is complicated by the use of such devices as rotating diffusers which mean that the simple eigenrnode theory does not apply provided the rotating diffuser is large enough and heavy enough to perturb the sound field. M is needed to settle this point.
-
ore work1
f Air- 1
'ASTM E90-81, "Standard Method for Laboratory Measurement o_ -
borne Sound Transmission Loss of Building Partitions," ASTM, Philadel- phia, PA (1981).
'IS0 140AII-1978, "Laboratory Measurements of Airborne Sound Insu- lation of Buildings Elements," IS0 Standards Handbook 4, 201-205 (1980).
3M. J. Crocker, P. K. Raju, and V. Forssen, "Measurements of Transrnis- sion Loss of Panels by Direct Determination of Transmitted Acoustic In- tensity," Noise Cont. Eng. 17 (I), 6 (1981).
4S. Gade, K. B. Ginn, 0. Roth, and M. Brock, "Sound Power Deterrnina- tion of Highly Reactive Environments Using Sound Intensity Measure- ments," Inter-Noise 83 Proc. 11, 1047-1050 (1983).
'A. H. Davis, "Reverberation Equations for Two Adjacent Rooms Con- nected by an Incompletely Soundproof Partition," Phil. Mag. 6 (50), 75- 80 (1925), or see Acoustics, edited by A.D. Pierce (McGraw-Hill, New York, 1981), p. 282.
6E. Buckingham, "Theory and Interpretation of Experiments on the Transmission of Sound Through Partition Walls," Natl. Bur. Stand. Sci. Pap. 20 (506), 193-219 (1925).
7A. C. C. Warnock, "Some Practical Aspects of Absorption Measurements in Reverberation Rooms," J. Acoust. Soc. Am. 74, 1422-1432 (1983). 'M. P. Waser and M. J. Crocker, "Introduction to the Two-Microphone
Cross-Spectral Method of Determining Sound Intensity," Noise Cont. Eng. 22 (3), 7 6 8 5 (May-June 1984).
9A. Cops and M. Minten, "Comparative Study Between the Sound Intensi- ty Method and the Conventional Two-Room Method to Calculate the Sound Transmission Loss of Wall Constructions," Noise Cont. Eng. 22 (3), 1011.1 11 (May-June 1984).
wo- 76,
9. Roland, M. Villenave, and C. Martin, "Intensimhtrie Awustique: I
plication la Recherche des Chemins de Transmission du Son," CS
Etudes et Recherche, Livraison 250, juin 1984, Cahier 1931. ' K . W. Walker, "Measurements of Sound Transmission Loss With a TI
Microphone Sound Intensity Analyzer," J. Acoust. Soc. Am. Suppl. 1 S50 (1984).
''A. C. C. Warnock, "Multiple Speakers in Reverberation Room Meas1 ments," Division of Building Research, National Research Counci Canada, Building Research Note 187 (May 1982).
13N. Michelson, "The Effects of Laboratory Design on the Measured SOL, Reduction Index," Lydteknisk Laboratorium, Rep. 18 (1979). 14R. W. Guy and P. Sauer, "The Influence of Sills and Reveals on Sol
Transmission Loss," Appl. Awust. 17,453476 (1984).
I5ASTM E413-73, "Standard Classification for Determination of Sol Transmission Class," ASTM, Philadelphia (1973).
6R. V. Waterhouse, "Interference Patterns in Reverberant Sound Fielc
J. Acoust. Soc. Am. 27,247-258 (1955).
7ANSI S1.31-1980, "Precision Methods for the Deterinination of Sol Power Levels of Broad-Band Noise Sources in Reverberation Roon ASA Catalog No. 11 (American National Standards Institute, New Yc 1980).
"IS0 3741-1975(E), "Acoustics-Determination of Sound Power Level Noise Sources-Precision Methods for Broad-Band Sources in Reverl ation Rooms," IS0 Standards Handbook 4 , 2 9 4 1 (1980).
I9ASTM E492-77, "Standard Method of Laboratory Measurement of pact Sound Transmission Through Floor-Ceiling Assemblies Using Tapping Machine," ASTM, Philadelphia, PA (1977).
''IS0 140/VI-1978(E), "Laboratory Measurements of Impact Sound Ir lation of Floors," IS0 Standards Handbook 4,221-225 (1980). "ASTM C634-81% "Standard Definitions of Terms Relating to Envir
mental Acoustics" ASTM, Philadelphia, PA (1981).
"L. Beranek, Noise Reduction (McGraw-Hill, New York, 1960), pp. 1 176.
23H. Kuttruff, Room Acoustics (Wiley, New York, 1973).
Z4ANSI S1.2-1962, "American Standard Method for the Physical Measi ment of Sound," American National Standards Institute, New Yc 1962.
"ASTM E336-77, "Standard Method for Measurement of Airborne Sol Insulation in Buildings," ASTM, Philadelphia, PA (1977). 26M. Schroder, "Die statistischen Parameter der Frequenzkurven von @
sen Raumen," Acustica 4, 594-600 (1954).
"M. R. Schroeder and K. H. Kuttruff, "On Frequency Response Curve Rooms: Comparison of Experimental, Theoretical, and Monte Carlo sults for the Average Frequency Spacing Between Maxima," J. Aco Soc. Am. 34,7680 (1962). [m- the ISU- 'on- und ros- s in Re-
~
ust. IT h i s p a p e r , w h i l e b e i n g d i s t r i b u t e d i n r e p r i n t form by t h e D i v i s i o n of B u i l d i n g R e s e a r c h , remains t h e c o p y r i g h t of t h e o r i g i n a l p u b l i s h e r . I t s h o u l d n o t be r e p r o d u c e d i n whole o r i n p a r t w i t h o u t t h e p e r m i s s i o n of t h e p u b l i s h e r . A l i s t of a l l p u b l i c a t i o n s a v a i l a b l e from t h e D i v i s i o n may be o b t a i n e d by w r i t i n g t o t h e , P u b l i c a t i o n s S e c t i o n , D i v i s i o n of B u i l d i n g R e s e a r c h , N a t i o n a l R e s e a r c h C o u n c i l of C a n a d a , O t t a w a , O n t a r i o ,