PFC/JA-90-36
CARM Amplifier Theory and Simulation
Chen, C.; Danly, B.G.; Davies, J.A.t; Menninger, W.L.; Wurtele, J.S.; Zhang, G.t
Plasma Fusion Center
Massachusetts Institute of Technology
- -Cambridge, MA 02139
September 1990
t Permanent Address: Department of Physics, Clark University, Worcester, MA
Submitted to: Nuclear Instruments & Methods (special issue).
ABSTRACT
The theory and simulation of cyclotron autoresonance maser (CARM) amplifiers are presented, including studies of amplifier phase stability, multimode phenomena, and sus-ceptibility to absolute instabilities. Recent results include particle-in-cell simulations of the onset of absolute instabilities and numerical modeling of multimode effects. Phase stability studies indicate that the output phase of CARM amplifiers may be relatively insensitive to fluctuations in beam energy, pitch, and current, for optimized designs; simulations show a phase sensitivity of ~ 2* per percent beam energy variation. An experimental design for a long-pulse 17 GHz CARM amplifier is presented.
1.
INTRODUCTION
Future linear colliders will require high frequency rf sources together with high gradi-ent accelerating structures in order to be economically feasible. The cyclotron autores-onance maser (CARM) is a promising source for application as an rf accelerator driver, and a program to develop CARM amplifiers at 17 GHz for this application is presently underway at the MIT Plasma Fusion Center [1].
Experiments at a 17 GHz will be performed using two different technologies for gener-ation of the high voltage electron beam required by the CARM. A long-pulse (2.5 ps, 1 ps flattop), 700 kV pulse modulator and a short-pulse (50 ns), 1.2 MeV induction accelerator will be employed for generation of the electron beam. This will allow a comparison of two alternate methods for producing the ~ 50 ns rf pulses required by the high gradient structures. A long-pulse, modulator-driven CARM together with pulse compression tech-niques, or an induction-linac-driven CARM are both capable in principle of delivering the required rf pulses to the structure.
In this paper, several theoretical issues are discussed, including the behavior of the CARM amplifier with the presence of multiple modes, particle-in-cell simulations of am-plifier stability, and an analysis of phase stability in the CARM amam-plifier. Finally, an experimental design for a long-pulse CARM amplifier is presented.
2.
MULTIMODE CARM AMPLIFIER THEORY
Many planned CARM amplifier experiments will operate in overmoded waveguide. Until now, CARM amplifiers have been analyzed under a priori assumption that only a single waveguide mode interacts with the electron beam. The goal of this section to develop a formalism which can treat overmoded systems with an arbitrary number of transverse-electric (TE) and transverse-magnetic (TM) modes. The present analysis consists of two approaches: (kinetic) linear theory and three-dimensional, self-consistent computer simulations. For simplicity, we present here the analysis of TE1j modes
cou-pling to an azimuthally symmetric electron beam at the fundamental cyclotron frequency, while maintaining the general features of multimode CARM interactions.
It can be shown that a complete set of nonlinear equations describing an over-moded CARM amplifier with multiple TEIn modes can be expressed in the dimensionless form [2,3] =- - 1 X.(rL,)AcosPn , (1) d! pZ dp A 1 d6 dAn s - -Xn(rA,r,) -+-) A cosn+- si , (2) di fix n n di IdI
d4,' 1 + + + V
di
TO
6
AA.
d
2 1+ -A- W,(rL, r,)
V
2- + -')A., sini~ p- dA 1 cs (3)PP.,Pi #ii, d+PzC~~i
+
Tn )An (i) exp{
i_ 2in \n + (id I
=ig X (rL, r,) e-ln- expf i -z+ n(i) , (4)
where the normalized coupling constant gn is defined by
= 4(026 - 1) . (5)
- 1)[J1 (Vn)]2 \A (5)
Equations (1)-(3) describe the dynamics of each individual particle, and Eq. (4) describes the slowly varying wave amplitude An(i) and phase shift 6(i) for the TE1j mode. In Eqs. (1)-(5), i = wz/c is the normalized interaction length; w = 27rf is the angular frequency of the input signal;
n
=/w
= eBo/mct is the normalized nonrelativistic cyclotron frequency;P.
= p,/mc = -yo,, Pj = pj/mc =-yfLj,
and -y = (1+P+3I)1/2 are, respectively, the normalized axial and transverse momentum components, and relativistic mass factor of the beam electron; Ib is the beam current; IA = mc3/e 2 17 kA is theAlfv~n current; Xn(rL,r,) = Jo(knrg)JI(knrL) and Wn(rL,rg) = Jo(knrg)JI(knrL)/knrL
are geometric factors; Jo(x) is the zeroth-order Bessel function; JI(x) = dJ1(x)/dx is the derivative of the first-order Bessel function; vn is the nth zero of Jj(x); kn = vl'/r, is the transverse wavenumber associated with the T E1, mode; 0, = w/ck,, =k -is the normalized phase velocity of the vacuum TEIn waveguide mode; rTL = p±/mil, is
the electron Larmor radius; r, is the electron guiding-center radius which is assumed to be constant. In Eq. (4), < ... > denotes the ensemble average over the particle distribution, and typically more than 1024 particles are used in the simulations. The rf power flow over the cross section of the waveguide for the TEin mode, Pn(z), is related to the normalized wave amplitude An by the expression
Pn(i)= - + - ) (6)
2gn e2 IA di n
By performing the Laplace transform of the linearized Maxwell-Vlasov equations, a dispersion relation and amplitude equations can be derived for the cyclotron resonance maser interaction with multiple TEIn modes coupling to a cold, thin (knr, < 1), az-imuthally symmetric electron beam. To leading order in c2k'/(w - 1c/y - kv,)2, it
can be shown that the Laplace transform of the equations for the amplitudes En(z) ~
An(z) exp[ik2,z + 6b(z)] can be expressed approximately in the matrix form [3]
2 N ,(W2 + c2S2)
52 _ k2 + - E( + nn kn a'
n(2 + , (L -l/_y + i_ n)
= sEn(O) +
E
W ,kIvt Ej,(0) (7),= (w -
£c/i
+ i~s)2where use has been made of initial condition dEn(O)/dz = 0, and the dimensionless coupling constants Inn, are defined by
40 2 I1 Xn(rL , r,)X.,(rL , r,)
Inn' _L ,(8)
(J)[(V2 - 1)(V2, - 1)]1/2j,(Vn)j,(Vn,).()
In Eqs. (7) and (8), s = ik, is the argument in the Laplace transform; 3, = vIc and #_ = v./c are, respectively, the normalized axial and transverse velocities of the equilibrium beam electrons; and ckN is the largest cut-off frequency below the operating frequency w. Therefore, the amplitudes and dispersion relation can be obtained by solving Eq. (7) and performing the inverse Laplace transform of En(s).
For two coupled modes, TE1, and TEIn,, it is readily shown from Eq. (7) that the
dispersion relation is
k + kn - (kZ + kn,- k,
=[Innk (k,2 + k -n+ + + k - ](w2 -c2k) . (9)
When the two modes are well separated, and Ennki (k + k2, - w2/c2)
>
,(k2 + k - w2/c2), corresponding to the electron beam mode, w = kvz + Oc/y, in resonancewith the TE1n mode, w = c(kj
+
k2)1/2, the coupled-mode dispersion relation in Eq. (9)becomes the usual single-mode dispersion relation [2,4]
kZ+ k2_),esiw 2 (10)
for the TEI, mode.
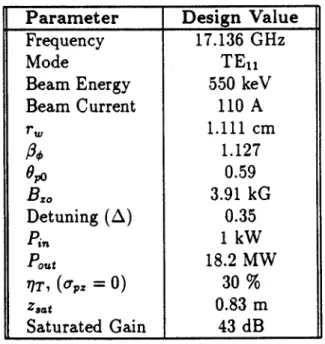
Typical results from the computer simulations and kinetic theory are summarized in Figs. 1-3. Figure 1 shows the dependence of rf power in the TE11 and TE12 modes
on the interaction length, for (a) single-mode CARM interactions and (b) the CARM interaction with the two modes coupling to the beam. The system parameters in Fig. 1 correspond to the TE11 mode in resonance, and the TE12 mode off resonance, with
the electron beam. The solid curves are the simulation results obtained by integrating numerically Eqs. (1)-(4), and the dashed curves are obtained analytically from Eq. (7). The inclusion of the coupling of the TE11 and TE12 modes results in instability for the TE12 mode in Fig. 1(b), while the single-mode theory predicts complete stability for the TE12 mode in Fig. 1(a). In fact, in Fig. 1(b), the TE12 mode grows parasitically with
the dominant unstable TE11 mode and the two coupled modes have the same spatial
growth rate -ImAk, > 0, corresponding to the most unstable solution of the dispersion
relation in Eq. (9). Because the TE11 mode is in resonance with the beam mode and the TE12 mode is detuned from the corresponding resonance, the TE12 mode suffers greater
launching losses than the TE11 mode in the interaction. This is one of the general features
of the multimode CARM interaction, namely, all of the coupled modes have the same small-signal growth rate but suffer different launching losses depending upon detuning characteristics.
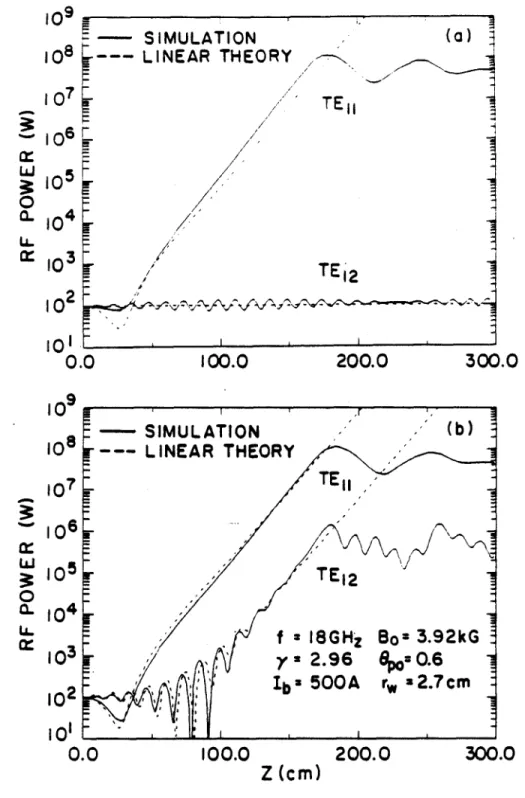
Another interesting feature of the multimode CARM interaction is that the rf power distribution among the coupled modes at saturation is insensitive to the power distribu-tion at z = 0 but is sensitive to detuning. Figure 2 shows the results of the simulations
for the coupling of the TE11 and TE12 modes with two different distributions of input rf
power. Here, only the TE12 mode is plotted because the TE11 mode remains virtually
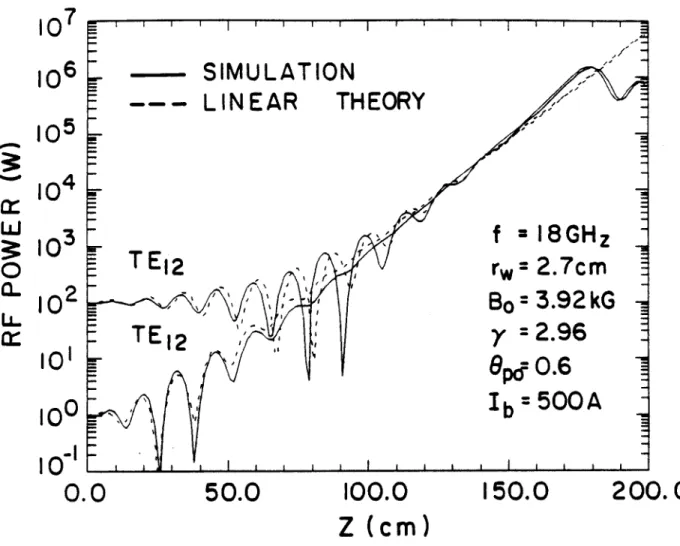
unchanged for the two cases. Figure 3 depicts the detuning characteristics of saturation rf power distribution over four coupled TEln modes (n = 1,2,3, 4), as obtained from the
simulations with an input power of 100 W per mode. By increasing the axial magnetic field B0 in Fig. 3, the beam mode is tuned through the resonances with the TE11, TE1 2, TE13, and TE14 modes at B0 = 3.74, 4.29, 5.33, and 6.98 kG, respectively. The fractional rf power for a given mode reaches a maximum at its resonant magnetic field, while the rf power decreases rapidly for off-resonance modes. In the transition from one resonance to another, however, two adjacent competing modes close to the resonance can have comparable rf power levels at saturation.
3.
SIMULATIONS OF CARM ABSOLUTE INSTABILITY
Most designs of CARM amplifiers, including our design in Sec. 5, rely on linear theory to determine parameter regimes where the absolute instability [5,6] is below threshold. The theoretcial models used in the calculation of the threshold current assume thatthere is no input signal at the drive frequency and that the system in infinite in the axial direction. Both these conditions are, obviously, violated in any amplifier experiment. In order to investigate the possibility of suppressing the absolute instability by injecting a large input signal, the MAGIC particle-in-cell code (7] is being used simulate a CARM amplifier. Parameters have been choosen so that, in the absence of an injected signal, the absolute instability will experience strong growth. At present, the cylindrically symmetric version of the program is being employed, limiting this preliminary analysis to TEon waveguide modes.
The growth of the TEO, mode downshifted convective instability and absolute in-stability from numerical noise (with no driver) is illustrated in Figs. 4(a) and 4(b). System parameters are waveguide radius = 1.5 cm, hollow beam radius = 0.75 cm,
gamma = 2.967, beam current = 50A, applied longitudinal magnetic field = 13.75 kG,
and 01 = 1.0. Figure 4(a) shows E9 vs. z at t = 3.6 nsec. The long-wavelength oscillation of Eq corresponds to the convective downshifted guide wavelength of 28 cm predicted by linear theory. Figure 4(b) shows the same field at t = 8.1 nsec. The long
wavelength is now consistent with the absolute instability guide wavelength of 18cm pre-dicted by linear theory. Apparently, the growth of the downshifted convective instability has been suppressed by that of the slower growing absolute instability.
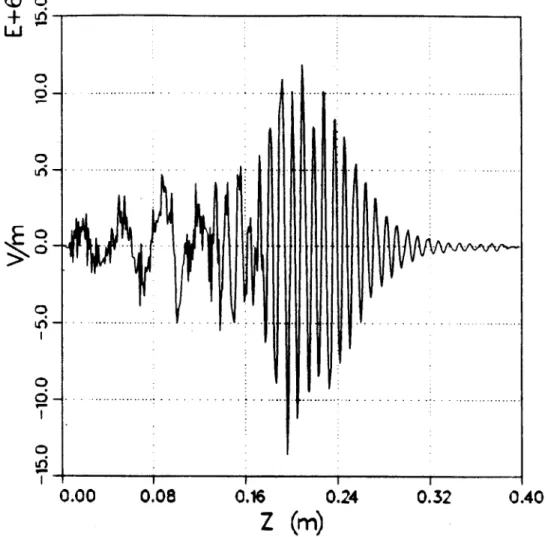
To illustrate the effects of an input signal, we apply a driver of 25 kW to a highly unstable system with the same waveguide dimensions and beam energy as in Fig. 4, but with 0L/011 = 1.6, beam current = 500 A, and an applied longitudinal magnetic field
of 19.43 kG. The frequency of the driver is 34.272 GHz (equal to that of the upshifted intersection of the uncoupled beam and TEO, waveguide dispersion relations). At early times growth is predominately in the upshifted TEO, mode. It is evident from Fig. 5, where E9 vs. z is plotted at a time of t = 1.4 nsec, that an instability of a longer wavelength, equal to that of either the TEO, downshifted (A. = 3.9 cm) or absolute instabilities (Ag = 3.8 cm), has developed in the region z < 0.16 m. If the power of the
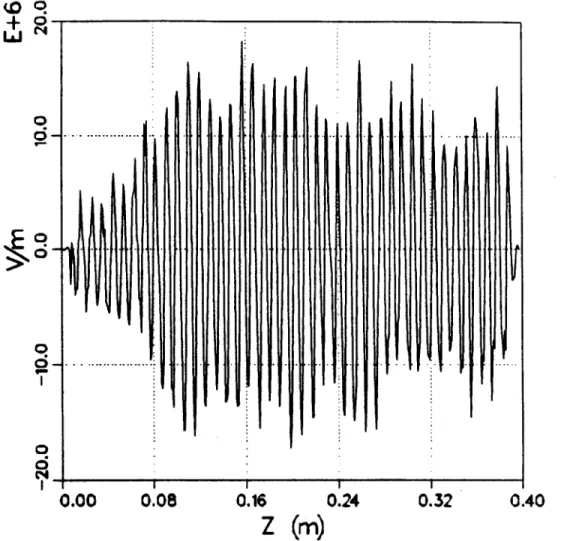
driver is increased to 2.5 MW, then, as is evident from Fig. 6, no significant longer-wavelength growth has appeared within 3.6 nsec. Further theoretical and numerical studies will be needed to quantitatively understand this phenomena and to determine if it is advantageous for CARM amplifiers to operate in this regime.
4.
CARM AMPLIFIER PHASE STABILITY
An analysis of the phase stability of CARM amplifiers to perturbations in electron beam parameters has been performed [8]. For a high peak power rf source to be attractive for use in powering the next generation linear collider, the source must produce rf with a stable, non-varying phase. Both the phase stability during the single 50 ns - 1 As rf pulse,
particular design of the linear collider. Failure of the source to deliver phase stable rf output usually results in an unacceptable variation of the energy of the electron beam in the linear collider. The rf phase in a high gain amplifier will be sensitive to the variations of the electron beam energy and current during the pulse. The typical phase stability of conventional klystrons is approximately 8* per percent beam energy variation.
In the cyclotron autoresonance maser, the question of phase stability is complicated
by the fact that the beam transverse momentum pi. (or, correspondingly, the transverse velocity fj_) is independently variable from the beam energy. For a free-electron laser, the
beam transverse motion is set by the wiggler, such that O. = a./ y. The phase stability of the CARM amplifier must therefore be investigated with respect to potential variation in at least three beam parameters, energy 7, transverse momentum pj, and current I.
These parameters are interrelated. For example, the current is correlated to the voltage fluctuations for space-charge limited emission from the cathode, and the beam pi will be correlated with fluctuations in the beam energy through the wiggler which is employed to produce the pi (assuming that a wiggler is used to spin up the beam).
Phase stability studies for several CARM amplifier designs have been carried out. For the parameters outlined in Table 1, the net rf phase variation with fluctuations in both beam voltage and .# is shown in Fig. 7 for energy E = mC2 (t - 1) and 13L, when Y
and O_ are assumed to be independently variable parameters. The contours are straight lines. In these figures, the phase shift between the amplifier input phase and the amplifier output phase has been taken to be zero for the mean values of the design parameters.
In a real CARM amplifier which utilizes a Pierce-Wiggler for the helical beam for-mation, the wiggler produces a correlation between the beam 0j. and the instantaneous beam energy in the wiggler. This correlation depends on how close the device is op-erating to resonance between the guide field and the wiggler field, exact resonance at the entrance of the wiggler occurring when -y Ok .c = eBo/m. By a careful choice of the
wiggler and guide field parameters, this wiggler induced correlation between fluctuations in y and fluctuations in # can be chosen in such a way as to significantly reduce the rf phase fluctuation for variations in the electron beam energy. An example follows. For the parameters in Table 1, for a wiggler designed with A, = 15 cm, Bo, = 1.964kG, a
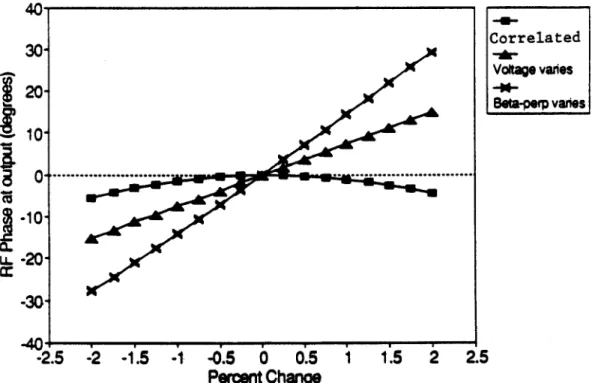
wiggler field strength of B,, = 35.8 G, and a length of L, = 45 cm, the wiggler induced correlation between changes in beam voltage and the resulting change in O1 is shown in Fig. 7 as the arc intersecting the mean value zero phase shift point of the contour plot. As is apparent from this figure, by careful choice of the wiggler induced correlation between
- and #., the rf phase stability of the CARM amplifier can be greatly enhanced. Fig. 8 presents a summary of the phase variability for independent voltage and O.# variation, and for beam voltage when the beam is intentionally correlated (corrected) by proper design of the wiggler system. Uncorrellated variations are ±8* per percent energy vari-ation, ±15* per percent variation in 0j, but only ~ ±2* per percent variation in beam
energy, over a narrow range of energy change (- 2.5%), for the properly designed cor-relation between & and y. For large variations in the beam energy, the wiggler induced correlation should result in the expected large variations in amplifier output phase; the wiggler induced correlation will only correct the phase for small changes about the design energy.
This technique for local reduction of the CARM amplifier phase sensitivity to beam energy variations could significantly improve the prospects for a high-gain CARM am-plifier with a high degree of phase stability.
5.
EXPERIMENTAL DESIGN
Experimental designs for both a long-pulse and short-pulse CARM amplifier have been carried out. The long-pulse experiment will utilize a 0.27 pP, 700 kV electron gun, and the MIT 2.5ps (1 ps flat-top), 700 kV pulse modulator. For operation with pulse lengths of 1 ps, the design of the CARM amplifier must optimize the device efficiency within the constraints imposed by the requirement that the amplifier not be susceptible to absolute instabilities [5,6]. Because the 1 ps pulse length is significantly longer than the typical e-folding times of the absolute instability, the design parameters of the device must be well within the calculated stability limits.
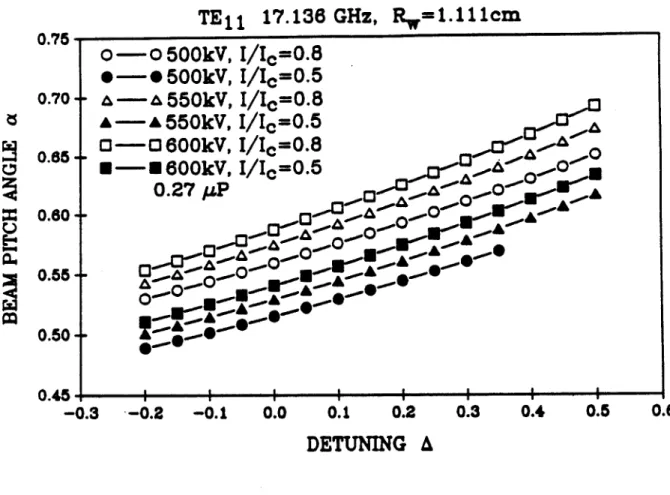
The beam pitch angle a =_ po which corresponds to 50% and 80% of the critical coupling for instability is shown in Fig. 9 as a function of the normalized detuning from resonance A for three different beam voltages. This detuning is defined by
2 (1 - 01jo/,30) 2 _3; 2 01 :)
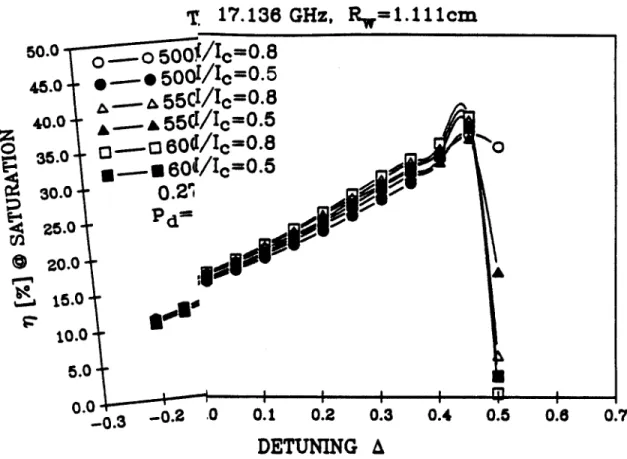
The total efficiency as a function of detuning, with beam a = 6,o determined as a function of A from Fig. 9, is shown in Fig. 10 for the case of a cold beam. The drive power was Pd = 1 kW, and the guide radius r. = 1.11 cm for these simulations. Results were obtained from a code which integrates a single mode version of Eqns. (1)-(4). The device efficiency is seen to increase markedly for magnetic fields below resonance; this is primarily because the allowable beam Opo increases substantially as the magnetic field is lowered. For fixed Opo the device efficiency does not vary with field as dramatically as in Fig. 10. Amplifier efficiency enhancement has been shown possible with magnetic field tapering [9,10]. The design parameters for a choice of 550 kV as the beam voltage are shown in Table 2.
6.
CONCLUSIONS
CARM theory and simulation have been used to study amplifier performance in over-moded systems. A multimode theory, which can predict the transverse mode excitation,
including launching losses, is in good agreement with multiparticle simulations. It was shown analytically, and confirmed in the simulations, that all of the coupled modes grow at the same growth rate as the dominant unstable mode, but suffer different launching losses, which depend upon detuning. The saturated rf power in each mode was found to be insensitive to input rf power distribution, but sensitive to detuning.
The absolute instability can be suppressed with sufficiently large input rf power for beam parameters which would otherwise be absolutely unstable. Further studies of this phenomena are required to determine if high gain and suppression of the absolute insta-bilty can be achieved simultaneously.
The sensitivity of the CARM induced phase shift in the rf signal to variations in the beam volatage and O.L has been examined in detail. When a Pierce wiggler is used to spin-up the beam, the correlations between errors in energy and perpindicular velocity can be made to cancel (to first order) near the operating point. For the design presented
in Sec. 4, sensitivities are, assuming no correlations between energy and 6
.L, ±8* per
percent energy variation and ±15* per percent variation in #1., but only ±2* per
percent variation in beam energy, over a narrow range of energy change (~ ±2.5%),
when the errors are correlated by the Pierce wiggler. Experimental design has been presented, and the experiments are underway.
ACKNOWLEDGEMENT
Supported by the U.S. Department of Energy, Office of Basic Energy Sciences, Contract DE-FG02-89ER14052.
References
[1] B.G. Danly, J.S. Wurtele, K.D. Pendergast, and R.J. Temkin. CARM driver for
high frequency RF accelerators. In F. Bennett and J. Kopta, editors, Proceedings of
the 1989 Particle Accelerator Conference, pages 223-225, I.E.E.E., 1989.
[2] A.W. Fliflet. Linear and nonlinear theory of the Doppler shifted cyclotron resonance maser based in TE and TM waveguide modes. Int. J. Electron., 61:1049, 1986.
[3] C. Chen and J.S. Wurtele. Multimode interactions in cyclotron autoresonance maser
amplifiers. Phys. Rev. Lett., 1990. Submitted for Publication.
[4] K.R. Chu and A.T. Lin. Gain and bandwidth of the gyro-TWT and CARM ampli-fiers. IEEE Trans. Plasma Sci., PS-16:90-104, 1988.
[5] Y.Y. Lau, K.R. Chu, L.R. Barnett, and V.L. Granatstein. Gyrotron traveling wave
amplifier: I. analysis of oscillations. Int. J. Infrared and Millimeter Waves,
2:373-393, 1981.
[6] J.A. Davies. Conditions for absolute instability in cyclotron resonance maser. Phys. Fluids, B1:663-669, 1989.
[7] B. Goplin and et al. MAGIC Particle-in-Cell Code Manual. Mission Research
Corporation, Newington, VA.
[8] W.L. Menninger, et. al, Phase Stability of CARM Amplifiers, In Preparation, 1990.
[9] K.D. Pendergast, B.G. Danly, R.J. Temkin, and J.S. Wurtele. Self-consistent sim-ulation of cyclotron autoresonance maser amplifiers. IEEE Trans. Plasma Sci.,
PS-16:122-128, 1988.
[10] C. Chen and J.S. Wurtele. Efficiency enhancement in cyclotron autoresonance maser
Table 1: Average Beam Parameters for Phase Stability Study
550 kV CARM Amplifier Design
Table 2: Long-Pulse CARM Amplifier Design Parameters Parameter Value Energy, -y mc2 1 MeV Current, I 3.7 kA 9
PO=
P.IPIl 0.6 Mode TE11 Frequency 17.136 GHz r, 1.4 cm Detuning, A 0Parameter Design Value Frequency 17.136 GHz
Mode TEI1
Beam Energy 550 keV
Beam Current 110 A rw, 1.111 cm 34 1.127 OPO 0.59 BZ0 3.91 kG Detuning (A) 0.35 P;. 1 kW Pet 18.2 MW 77T, (oap = 0) 30
%
Z.at 0.83 m Saturated Gain 43 dB1 07 3106 0 CL10 4 U-102 101 0. 10
W
a- W-105 102 101 0 0.0 100.0 100.0 200.0 Z (cm) 200.0 (a) I 30( 30CFigure 1: The rf power in the TE11 and TE12 modes if plotted as a function of the
inter-action length z for (a) single-mode CARM interactions and (b) the CARM interaction with the two coupled modes. Note in (b) that the TE12 mode grows parasitically with
the dominant unstable TE11 mode at the same spatial growth rate due to mode coupling,
despite the differences in launching losses.
SIMULATION --- LINEAR THEORY 7 TE11 TE12 sr - SIMULATION (b)
r---
LINEAR THEORY TEI TE12 f a 18GHg Boa 3.92kGy2.
9 69= 0.6
1b 50 0 A r, a2.7cm ~ S I ~I _ 0.0 .0107
10
5 10403
102
10100
10
10.
0
50.0
100.0
Z
(cm)
150.0
200.0
Figure 2: The TE12 rf power is plotted as a function of the interaction length for a
CARM with the TE11 and TE12 modes. Here, the two solid curves depict the linear and
nonlinear evolution of rf power for the TE12 mode obtained from the simulations with
two input rf power distributions: (a) Po(TE11) = 1.0 kW and PO(TE12) = 1.0 kW, and
(b) Po(TE11) = 1.0 kW and PO(TE12) = 1.0 W, while the two dashed curves are the
corresponding analytical results from Eq. (7).
W
3:
0- U----SIMULATION
---LINEAR
THEORY
~-f
=
18GHZ
E
12rw
=
2.7cm
B
0=
3.92kG
TE
12
y=
2.
9 6 e- 0.6-Ib500A
i i i I1.00
0
LU. 0.10 -Jz
0.10.01
3.0
I I t ~ I ' I --- S --.-- ..- -- -- = - \I--T -V-
TE
- \/
/\
---TE
12
-
j----T IE
-
I\\
/
--
TE
-
\
f =
18GHz
I
=
5
cm
y=2.96
Ib=500A
ePO--0.6
.I
I . I Iii
-
12-13
14-4.0
5.0
6.0
7.0
8.0
BO(kG)
Figure 3: The (fractional) saturated rf power in four coupled TE, modes is plotted as a function of detuning. Here, the values of the resonating magnetic field for the TEN, TE1 2, TE13, and TE14 modes correspond to BO = 3.74, 4.29, 5.33, and 6.98 kG, respectively.
I', ~ Li 0 0 N £0 >0 0 6-N 0.. 0 0 (0 Li 0.O 0.2 0.4 0.6 0.8 1.0 1 Z(m) 0.0 0.2 0.4 0.6 Z (m) 0.8 1.0 £0 2 1.2
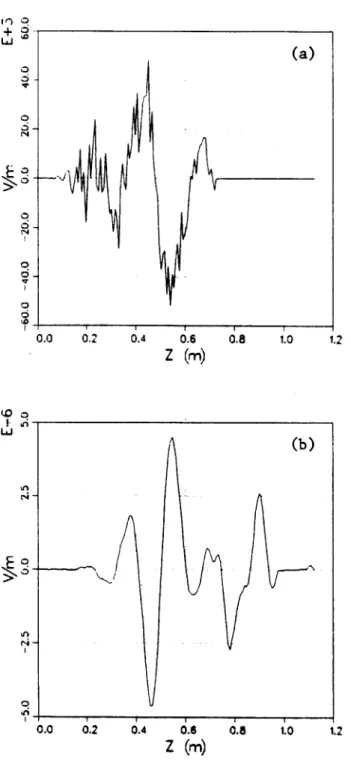
Figure 4: (a) Plot of Eq vs. z for a CARM with parameters r, = 1.5 cm, Rb = 0.75 cm,
i±/011l
= 1, y = 2.967, Ib = 50 A, and an applied field of Bo = 1.375 T. This signal hasdeveloped from numerical noise and is shown at time 3.6 ns, (b) plot of Eq vs. z for the same parameters as in (a), but at time 8.1 ns.
(a)
LLJ 0 0 >0 6-0.00 0.08 0.16 0.24 0.32 0.40
Z(m)
Figure 5: Plot of Ea vs. z for a CARM with parameters r, = 1.5 cm, Rb = 0.75 cm, A11 = 1.6, y = 2.967, Ib = 500 A, and an applied field of Bo = 1.943 T. The driver power is 25 kW. The wavelength to the right of z = 0.16 m is that of the driver, the wavelength in the launching loss region (to the left) is either that of the downshifted convective wave or of the absolute instability.
I
(O q +0 6 0;-7I
I
A
0.16 0.24 z(m)
Figure 6: Plot of Eq vs. z for the same parameters as in Fig. 5, except that the driver power is now 2.5 MW. .0 I
0.00
0.08 0.32 0.40I
II
I-3 -2
2-E
0'i-2
3Figure 7: RF Phase Variation Contours in Energy - O. Plane. Straight line contours
are phase variations for uncorrelated .L and voltage V; the curved line represents the
correlation between O. and V introduced by the wiggler.
-1 -0.5 0 0.5 Percent Change -U-Correlated -Ar Votage varies Beta-perp varies 1 1.5 2 2.5
Figure 8: CARM Amplifier Phase Stability for Uncorrelated Energy and #.3 Variation
and for Wiggler-Correlated Beam
-1 0 1
Percent Change in Beta-perp
4U, 30- 20- 10- -10--20 -30--2.5 LL u. -2 -1.5 40 deg 20 deg 0 deg --- --- .. -. --... ---. ... .... -20 deg -40 deg I
TE
11
17.136 GHz, Rw=1.111cm
0.76
0-0500kV, I/IC=0.
8*-
*500kV, I/IC=0.5
0.70--
& -- &55kV, I/IC=0.
8A-A 550kV, I/IC=0.5
0.865
O--
600kV, I/c=0.8
0
S-U
600kV, I/Ic=0.5
0..A
-. *
0.27 .. ...
0.6 - 0
0.45 -0
-0.3 -0.2 -0.1 0.0 0.1 0.2 0.3 0.4 0.5 0.6
DETUNING A
Figure 9: Plot of amplifier beam pitch Opo, corresponding to 50% and 80% of critical coupling as a function of magnetic field, and parametrized by beam voltage, for fixed
T 17.136 GHz, Rw=1.111cm
50.0 O--O500f/Ic=0.8
45.0-.---
o5001/Ic=0.5
40A.-
55CI/Ic=0.8
40.0A..A55C/Ic=0.5
35.0C.-
1 o60d/Ic=0.8. -
60[/1c=0.5
30.0 0.21 25.0 20.0 15.0 10.0 5.0 0.0 -0.3 .-0.2 0 0.1E-rn
A 0.2 0.3 0.4 0.5 0.6 0.?DETUNING A
Figure 10: Plot of effi; detuning for different beam voltages and for OPO values corresponding to 504/ critical coupling.