HAL Id: hal-00806025
https://hal.archives-ouvertes.fr/hal-00806025
Submitted on 29 Mar 2013
HAL is a multi-disciplinary open access
archive for the deposit and dissemination of
sci-entific research documents, whether they are
pub-lished or not. The documents may come from
teaching and research institutions in France or
abroad, or from public or private research centers.
L’archive ouverte pluridisciplinaire HAL, est
destinée au dépôt et à la diffusion de documents
scientifiques de niveau recherche, publiés ou non,
émanant des établissements d’enseignement et de
recherche français ou étrangers, des laboratoires
publics ou privés.
Statistical Study of the Corrosion Behavior of Al2CuMg
Intermetallics in AA2024-T351 by SKPFM
Loïc Lacroix, Laurence Ressier, Christine Blanc, Georges Mankowski
To cite this version:
Loïc Lacroix, Laurence Ressier, Christine Blanc, Georges Mankowski. Statistical Study of the
Corro-sion Behavior of Al2CuMg Intermetallics in AA2024-T351 by SKPFM. Journal of The Electrochemical
Society, Electrochemical Society, 2008, vol. 155, pp.C8-C15. �10.1149/1.2799089�. �hal-00806025�
O
pen
A
rchive
T
oulouse
A
rchive
O
uverte (
OATAO
)
OATAO is an open access repository that collects the work of Toulouse researchers and
makes it freely available over the web where possible.
This is an author-deposited version published in:
http://oatao.univ-toulouse.fr/
Eprints ID : 2410
To link to this article :
URL : http://dx.doi.org/10.1149/1.2799089
To cite this version :
Lacroix, Loïc and Ressier, Laurence and Blanc, Christine
and Mankowski, Georges ( 2008)
Statistical Study of the Corrosion Behavior of
Al2CuMg Intermetallics in AA2024-T351 by SKPFM.
Journal of The
Electrochemical Society (JES), vol. 155 (n° 1). C8-C15. ISSN 0013-4651
Any correspondence concerning this service should be sent to the repository
Statistical Study of the Corrosion Behavior of Al
2CuMg
Intermetallics in AA2024-T351 by SKPFM
Loïc Lacroix,aLaurence Ressier,bChristine Blanc,a,
*
,zand Georges Mankowskia
a
Centre Interuniversitaire de Recherche et d’Ingénierie des Matériaux, UMR CNRS 5085,
Ecole Nationale Supérieure des Ingénieurs en Arts Chimiques et Technologiques, 31077 Toulouse Cendex 04, France
b
Laboratoire de Physique et Chimie des Nano-Objets, UMR CNRS 5215, Institut National des Sciences Appliquées, 31077 Toulouse Cedex 04, France
A statistical study combining atomic force microscopy, scanning Kelvin probe force microscopy共SKPFM兲, and energy-dispersive spectroscopy was carried out on more than 300 Al2CuMg intermetallic particles of AA2024 alloy to determine their corrosion behavior in chloride-containing solutions. The combination of these three techniques allowed the correlation of the dissolution depth of the S-phase particles to their SKPFM potential and their chemical composition. This study also revealed that SKPFM measurements must be carried out with many precautions, but it is a powerful tool for the study of localized corrosion.
关DOI: 10.1149/1.2799089兴
Aluminum alloys such as the 2XXX series are widely used in the aircraft industry due to their high strength-to-weight ratio. But, these alloys are extremely susceptible to localized corrosion in chloride-containing media and different kinds of corrosion are observed such as pitting corrosion,1,2intergranular corrosion共IGC兲,3,4exfoliation,5 and stress corrosion cracking.6,7
Corrosion susceptibility of 2XXX series Al alloys has long been studied.3,8-12It is mainly caused by their heterogeneous microstruc-ture, which is intentionally introduced in order to improve the me-chanical properties. Among the different types of intermetallic par-ticles present in AA2024 alloy, Al2CuMg particles共called S-phase兲 are widely studied because they are very reactive and are present both in the grain boundary and in the grains and they constitute a large proportion of the particles present in 2XXX alloys.13,14 Corro-sion damage is localized at the S-phase particles, resulting in selec-tive dissolution or pitting in the matrix adjacent to the particle.15-19 This phenomenon has often been studied by electrochemical mea-surements in combination with scanning electron microscopy共SEM兲 and energy-dispersive spectroscopy共EDS兲. However, common elec-trochemical methods lack micrometer-scale lateral resolution, which is critical for understanding the role of intermetallic particles in localized corrosion.
For about 10 years, the combination of topographical analysis by atomic force microscopy共AFM兲 in air or in solution 共in situ兲 with potential mapping in air by scanning Kelvin probe force microscopy 共SKPFM兲 has appeared to be a powerful tool to study the localized corrosion of AA2024 alloy.20-24In fact, the potential measured by SKPFM shows a clear chemical contrast allowing various metallur-gical phases or materials down to 100 nm in size to be differentiated with potential noise smaller than 1 mV.24,25Even though measure-ments are performed in air, Schmutz et al. have shown that the SKPFM potential gives a good measure of the practical nobility of intermetallics in AA2024 because this potential and the corrosion potential measured in solution seem to be correlated.20But, SKPFM measurements and analyzes have to be performed with many pre-cautions because the relationship between SKPFM potentials and local electrochemistry is relevant but not trivial.26In fact, SKPFM measurements are highly influenced by the structure, composition, and thickness of the oxide film covering the surface, surface charge distribution, and adsorbed species at the surface.22,24As recently mentioned by Rohwerder et al., the correlation between the SKPFM potential and the corrosion potential is not of general validity, which makes systematic studies necessary.27Furthermore, previous AFM/ SKPFM studies on AA2024 reported in the literature have always been performed on a small number of intermetallics, making any
quantitative extrapolation on the macroscopic corrosion behavior of this alloy quite difficult. Therefore, statistical studies on the extent of correlation between corrosion behavior and SKPFM potentials are important.
In this study, AFM and SKPFM measurements were performed on more than 300 S-phase particles of the 2024 T351 alloy before and after immersion in chloride-containing sulfate solutions to study their dissolution mechanism using a statistical approach. These ana-lyzes by scanning probe microscopy were then related to the chemi-cal composition of the S-phase particles as determined by EDS.
Experimental
Material.— An AA2024 T351 rolled plate共wt %: Cu 4.50, Mg
1.44, Mn 0.60, Si 0.06, Fe 0.13, Zn 0.02, and Ti 0.03兲 with a thick-ness of 50 mm was used for this study. The T351 temper corre-sponds to a solution heat-treatment at 495°C共⫾ 5°C兲, water quench-ing, strainquench-ing, then tempering at room temperature for 4 days.
Microstructure and chemical composition of the S-phase par-ticles.— Samples were observed before and after immersion in
chloride-containing sulfate solutions by SEM using a Leo 435VP apparatus. The compositional analysis of the intermetallic particles was determined with EDS by averaging the results obtained over a large number of particles. An accelerating voltage of 15 kV was used for both secondary electron imaging and EDS analyses.
AFM and SKPFM measurements.— AFM and SKPFM
mea-surements were performed on a Nanoscope IIIa multimode atomic force microscope from Digital Instruments equipped with a Basic Extender electronic module.
The probes selected were conductive Pt/Ir-coated silicon tips 共re-sistivity 0.01–0.025⍀ cm兲 on a cantilever whose resonant fre-quency was 75 kHz. These long and slender tips with an apex radius of about 25 nm on a cantilever of small width and surface area have optimum geometric characteristics to obtain a good resolution in potential maps.28
To minimize cross-talk, topography and potential scans were col-lected using the “lift” technique, which involves a two-pass rastering of the surface. On the first pass, the surface topography of a single line scan is acquired by standard tapping mode. On the second pass, at a set lift height from the sample surface, the drive piezo that normally vibrates the cantilever in tapping mode is turned off and an oscillating voltage VACsint 共with /2 near the resonant fre-quency of the cantilever兲 is directly applied to the cantilever tip to measure the surface potential. Any dc voltage difference between the tip and the sample generates an oscillating electric force on the cantilever which causes the cantilever to vibrate. The local SKPFM potential is thus determined by adjusting the dc voltage on the tip until the oscillation amplitude of the cantilever becomes zero. At *Electrochemical Society Active Member.
z
this point the tip voltage is the same as the local surface potential. Images are obtained by repeating this procedure for each line along the slow-scan axis. The voltage applied to the cantilever tip is re-corded to construct a potential map of the sample with respect to the tip used.
In this study, all AFM and SKPFM measurements were made in air at room temperature and an ambient relative humidity of about 40%. Potential mapping by SKPFM was carried out at a lift height of 50 nm, which was found to be the optimal value to limit cross-talk with topography and obtain a lateral resolution better than 100 nm with a good signal-to-noise ratio of the potential data. A drive amplitude VACof 6 V was chosen to make sensitive potential measurements, taking into account parametric amplification.29The feedback electronics was finely tuned to give the highest sensitivity.30A scan rate of 0.5 Hz was used for all the measure-ments on samples before immersion. On highly corroded S-phase particles, scan rates as low as 0.1 Hz were sometimes required to accurately map the topography, which is a crucial prerequisite to get nonerroneous SKPFM potential mapping.24
Contrary to some authors who invert the SKPFM potential data in order to obtain the same polarity as the electrochemical potentials,20 here all the potential maps presented used raw data. Because we often checked that the tip used was stable in potential and we were only interested in potential differences between the S-phase particles and the matrix, we did not need to calibrate the potential measurements by comparison to the potential measured on pure Ni or Pt.20,21,24By assuming that, far from the particles, there is no significant variation of the matrix potential, we defined the tential of an S-phase particle by the difference of the SKPFM po-tential between the S-phase particle and the matrix remote from the particle. The potential of S-phase particles is thus denoted in the following as “SKPFM potential.” Measurements performed on a Ag–Al couple showed that the difference of SKPFM potential be-tween Ag and Al was negative, so a potential lower for an interme-tallic than that of the matrix means that the intermeinterme-tallic is nobler than the matrix.
The samples used for AFM and SKPFM measurements were 4⫻ 2 ⫻ 2 mm parallelepipeds embedded in epoxy resin with an 8 mm2area exposed to the electrolyte. Special care was taken for sample preparation, which is crucial for obtaining reliable results.31 The samples were mechanically polished with up to 4000 grit SiC paper, then with 3m diamond paste, down to 1/4 m diamond paste using ethanol as lubricant. The samples were finally
ultrasoni-cally cleaned in ethanol and dried in air. Ethanol was chosen as lubricant instead of water or petroleum ether because it was found to lead to a smooth surface 共mean roughness Ra= 4.7 ± 0.5 nm on 1000m2 areas兲 with no dissolution of S-phase particles during polishing.
Corrosion tests consisted of immersion at the open-circuit poten-tial in a 0.1 M Na2SO4solution with 0.001 M NaCl at room tem-perature. All chemicals used were analytical reagent grade and water was deionized. For each sample, AFM and SKPFM measurements were performed before and after immersion in several areas共where the only particles present were S-phase particles兲, leading to a sta-tistical analysis on more than 300 particles. The sample surface was always prepared just before AFM and SKPFM measurements. Spe-cial care was taken for corroded samples; before any drying, the samples were ultrasonically cleaned in water to dissolve the corro-sion products and to avoid any precipitation of sulfate and chloride crystals from drying solution. The samples were finally ultrasoni-cally cleaned in ethanol and air dried to limit any effect of the adsorbed layer on the potentials.
Results and Discussion
Study of S-phase particle dissolution by combining AFM, SEM, and optical microscopy.— Figure 1 shows typical observations of
an as-polished AA2024 sample. In the optical micrograph共Fig. 1a兲, eight Al2CuMg particles 共numbered from 1 to 8兲 can be distin-guished due to their round shape compared to the irregular shape of the Al–Cu–Mn–Fe particles. In agreement with previous studies, the AFM observations共Fig. 1b and c兲 reveal that these Al2CuMg par-ticles protrude slightly from the surface because of their greater hardness and lower rate of polishing relative to the matrix.20AFM measurements on about 300 S-phase particles of six different samples revealed that their mean height relative to the matrix was 60 ± 26 nm and their mean area 46 ± 38m2.
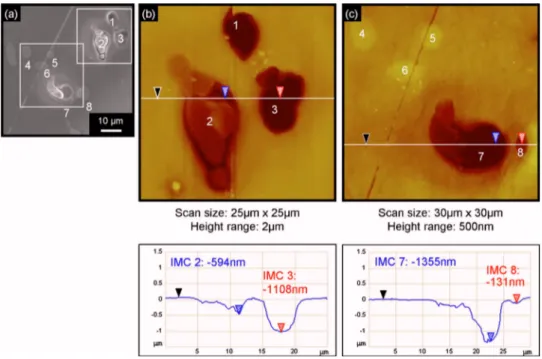
Figure 2 presents typical observations of the same sample area after an immersion of 60 min in a 0.1 M Na2SO4+ 0.001 M NaCl solution. Comparison of Fig. 1 and 2 clearly reveals that there is a great dispersion in the kinetics of corrosion initiation or/and propa-gation from one Al2CuMg particle to another; intermetallics 1, 2, 3, 7, and 8 are corroded, while particles 4, 5, and 6 appear uncorroded. Furthermore, among the corroded particles, some共particles 2 and 7兲 are partially dissolved over their whole surface. This dissolution can be explained by the aluminum and magnesium dealloying as often
Figure 1. 共Color online兲 Observations of
an as-polished AA2024 sample:共a兲 optical micrograph with eight S-phase intermetal-lic particles,共b兲 AFM top view of particles 1–3 as in共a兲 and sections of intermetallics 共IMCs兲 2 and 3, 共c兲 AFM top view of in-termetallics 4–8 as in共a兲 and sections of particles 7 and 8. In the sections, both measurements were made with reference to the black cursor.
referenced in the literature.14It can also be observed that a groove was formed around the whole perimeter of the particle as seen on both the SEM micrograph共Fig. 2a兲 and the topographical AFM map 共Fig. 2b and c兲. Assuming that there was no dissolution of the matrix beyond some micrometers, the dissolution of the S-phase particles reached 639 nm 共594 + 45 nm兲 and 1431 nm 共1355 + 76 nm兲 for particles 2 and 7, respectively. Due to the great dispersion in the kinetics of corrosion initiation or/and propagation, other particles 共particles 1 and 3兲 are more corroded; they are completely dissolved or maybe removed due to the growth of the groove around the perimeter of the particles. These observations confirm previous studies;11,17when AA2024 alloy is immersed in chloride-containing solutions, dissolution of both S-phase particles and the surrounding matrix is observed.
In summary, these observations reveal a small dispersion of the S-phase particle height on as-polished samples but a great heteroge-neity in the reactivity of the S-phase particles. A statistical analysis is thus absolutely necessary for any accurate study of the dissolution of the S-phase particles and to explain the macroscopic corrosion behavior of 2024 aluminum alloy.
About 150 S-phase particles on three AA2024 samples were thus analyzed by AFM in tapping mode before and after immersion for 2 h共samples A, B, and C兲 in a 0.1 M Na2SO4+ 0.001 M NaCl so-lution. The mean dissolution depth of each particle共calculated as the ratio of its dissolved volume to its area before immersion兲 was plot-ted vs its area共exposed to the electrolyte during immersion兲 in Fig. 3 for the three different samples. This graph exhibits:共i兲 a huge dispersion of the S-phase particle reactivity on any single sample: the mean dissolution depth of an S-phase particle exposed to the same corrosive conditions varies from 30 to 530 nm 关mean 200 ± 130 nm standard deviation共SD兲兴, from 40 to 460 nm 共mean 200 ± 120 nm SD兲, and from 233 to 614 nm 共mean 436 ± 157 nm SD兲 for samples A, B, and C, respectively. This heterogeneity of the corrosion behavior from one S-phase particle to another could be related to differences in the chemical composition of the oxide film at its surface共protecting it from dissolution for a given time兲 or to defects in the oxide film; 共ii兲 a reproducible dispersion of the S-phase particle reactivity from one sample to another共SD of the mean dissolution depth: 130, 120, and 157 nm for samples A, B, and C, respectively兲; and 共iii兲 no influence of the particle area exposed to the electrolyte on its reactivity.
Furthermore, Fig. 2 shows the great dispersion of reactivity from one particle to another on the same sample, but it also proves that
the dissolution of an S-phase particle can be heterogeneous. Figures 2a and c show, for example, that only a small part of particle 8 is dissolved while the other part remains uncorroded. Besides, the dis-solution depth of particles 2 and 7 varies from one point on the particle to another. Thus, the description of S-phase particle disso-lution has to be considered carefully. In Fig. 3, the mean dissodisso-lution depth of each S-phase particle was calculated as the ratio of its dissolved volume to its area. A finer approach consisting of a local study of the dissolution phenomenon was necessary to accurately relate the dissolution of the S-phase particles to SKPFM and EDS measurements. The local dissolution depth was then measured at a particular point on a particle and can be related to its local chemical composition and its local SKPFM potential at the same point.
Correlation between AFM, SKPFM, and EDS measurements.—
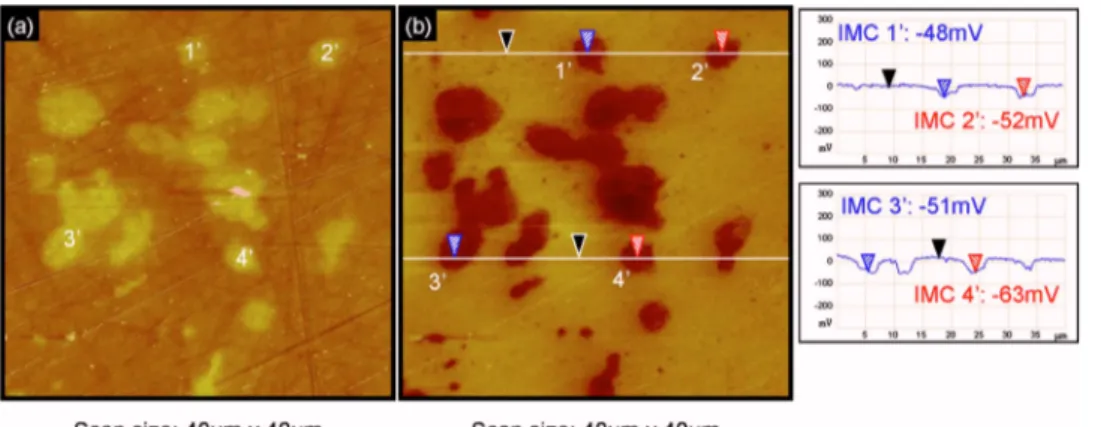
Figure 4 shows an AFM topographical map共Fig. 4a兲 and the corre-sponding SKPFM potential map共Fig. 4b兲 of an as-polished AA2024 sample. Four Al2CuMg particles 共numbered from 1
⬘
to 4⬘
兲 were marked in particular. Comparison of Fig. 4a and b reveals that the high contrast on the SKPFM potential map between the S-phase particles and the aluminum matrix allows the intermetallics to be clearly located and identified, in agreement with previous studies.20,22Sections of the potential maps revealed a difference ofFigure 2. 共Color online兲 Observations of
the same AA2024 area as in Fig. 1 after immersion in a 0.1 M Na2SO4+ 0.001 M
NaCl solution for 60 min at the open-circuit potential:共a兲 SEM micrograph, 共b兲 AFM top view of S-phase particles 1–3 as in 共a兲 and sections of intermetallics 共IMCs兲 2 and 3, 共c兲 AFM top view of par-ticles 4–8 as in共a兲 and sections of inter-metallics 7 and 8. In the sections, both measurements were made with reference to the black cursor.
Figure 3. Mean dissolution depth vs particle area共exposed to the electrolyte
during immersion兲 for Al2CuMg intermetallics on an AA2024 alloy
im-mersed for 2 h in a 0.1 M Na2SO4+ 0.001 M NaCl solution at open-circuit
potentials with respect to the matrix of −52 and −51 mV for par-ticles 2
⬘
and 3⬘
, respectively. In agreement with previous studies, S-phase particles appear less active than the matrix共the displayed potential data are raw data, not inverted兲.20,22,23The same measure-ments were performed on the same sample in the same zone after immersion in a 0.1 M Na2SO4+ 0.001 M NaCl solution at open-circuit potential for 1 h共Fig. 5兲. Both SEM and AFM observations 共Fig. 5a and b兲 show that particle 1⬘
is not corroded while particles 2⬘
and 3⬘
are highly dissolved共dissolution of the surrounding matrix is also observed兲. Particle 4⬘
was removed from the surface certainly due to the strong dissolution of the surrounding matrix. The corre-sponding SKPFM potential map共Fig. 5c兲 shows that for particles 2⬘
and 3⬘
, the contrast is stronger than before immersion; particles 2⬘
and 3⬘
present a difference of SKPFM potential with respect to the matrix of about −143 and −293 mV, respectively. This shows that the dissolution of S-phase particles leads to an increase共in absolute value兲 of the difference in potential with respect to the matrix. For particle 4⬘
, which is completely dissolved, there is no longer a po-tential difference with respect to the matrix, which is easily under-standable because, the particle having being removed, the potential measured is that of the matrix. Figure 5c also shows that for particle1
⬘
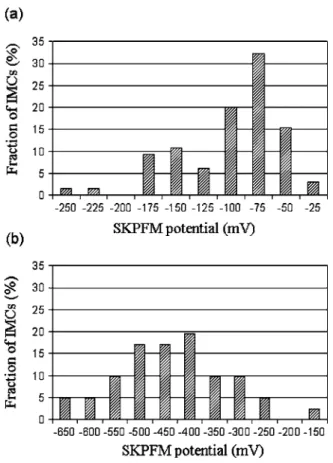
, there is no contrast in SKPFM potential after immersion even though the particle is still present and intact, probably due to the formation of a thick oxide layer over the top.Statistical analysis of the SKPFM potential of S-phase particles confirms and quantifies the tendencies observed in Fig. 5. As said previously, we defined the potential of an S-phase particle by the difference of the SKPFM potential between the S-phase particle and the matrix remote from the particle. Figure 6a shows the distribution of this potential measured for about 300 S-phase particles on an as-polished AA2024 alloy. A similar distribution was plotted for the corroded particles after immersion for 60 min in a 0.1 M Na2SO4 + 0.001 M NaCl solution共Fig. 6b兲.
Figure 6a shows that the SKPFM potential values for the par-ticles before immersion were significantly scattered with values varying from −20 to −240 mV共mean value −90 mV with a SD of 45 mV兲. Taking account of the fact that these values are raw nonin-verted data for all the particles present, they are in quite good agree-ment with values reported in the literature for just one or only a few particles共+280,20+200,23and +150 mV24兲.
After immersion in the aggressive solution, the SKPFM poten-tials measured with respect to the matrix are more scattered; they
Figure 4. 共Color online兲 Observations of
four S-phase intermetallics共IMCs 1⬘–4⬘兲 on an as-polished AA2024 sample: 共a兲 AFM and共b兲 SKPFM potential maps with two associated sections. In the sections, both measurements were made with refer-ence to the black cursor.
Figure 5. 共Color online兲 Observations of
the same area as in Fig. 4共IMCs 1⬘–4⬘兲 after immersion for 60 min in a 0.1 M Na2SO4+ 0.001 M NaCl solution at open-circuit potential:共a兲 SEM observa-tion and共b兲 AFM and 共c兲 SKPFM poten-tial maps with two associated sections. In the sections, both measurements were made with reference to the black cursor.
decrease down to a value varying from −130 to −650 mV共mean −410 ± 110 mV SD兲 共Fig. 6b兲. This increase 共in absolute value兲 of the potential difference has already been reported in the literature but has only been quantified on a few particles.23
It can be assumed that the SKPFM potential is related to the chemical composition of the first monolayers of the sample.22When the particles are dissolved, the increase of the contrast in potential strongly suggests that the chemical composition of the particles also changes. Local EDS analysis was thus performed on all particles for which potential measurements were carried out. The results reveal that all the S-phase particles 共EDS analysis performed on 20 par-ticles using standard samples for calibration兲 have the same chemi-cal composition before immersion: 52.6 ± 0.5 atom % Al, 22.1 ± 0.2 atom % Cu, 25.1 ± 0.3 atom % Mg. This shows that the scattering on the SKPFM potentials for the as-polished sample can-not be attributed to variations in the chemical composition of the intermetallics detectable with EDS. However, EDS analysis is not a surface-sensitive technique and cannot be used to detect low varia-tions of the chemical composition of the extreme surface of the intermetallics. Furthermore, other parameters, some of them being invisible to standard surface analysis, have to be considered, such as the chemical composition, the thickness and defect structure of the oxide film covering the particle, the environmental parameters during the formation and age of the oxide film, the surface preparation, and maybe the crystallographic orientation of the particles.23-25,28,30-32Comparison of Fig. 4 and 5 previously showed that the SKPFM potential of an uncorroded particle becomes quite similar to that of the matrix after a long immersion time due to thickening of the oxide film during immersion in the electrolyte. This result is in perfect agreement with observations made by Schmutz et al.,21Leblanc et al.,23and Muster et al.24Because the SKPFM potential characterizes a thin layer at the surface of the material, there is no significant influence on the potential
measure-ments of the material under the oxide film. Furthermore, the oxide layers formed on the matrix and on Al2CuMg particles obviously differ in their chemical composition16,33but the SKPFM potential measurements are not sensitive enough to reveal such differences with high contrast.
In brief, the dispersion of the SKPFM potentials for the S-phase particles before immersion could be related to different parameters, such as some differences in the thickness of the oxide films共not to some differences in the chemical composition兲 formed on the S-phase particles corroborating the high dispersion in reactivity. The increased scattering of the SKPFM potentials for the corroded S-phase particles could be related to their differences in reactivity, leading to different alterations of the chemical composition of the particles after immersion.
Because of the great dispersion of SKPFM potential data before and after immersion from one particle to another, it is necessary to consider, for each particle, the difference between its potential after immersion Vtand that on the as-polished sample V0 to accurately represent the phenomenon. Figure 7 reveals that a good correlation exists between the variation ⌬V = 共Vparticle− Vmatrix兲t−共Vparticle
⬘
− Vmatrix⬘
兲0 of the local SKPFM potential of the S-phase particles relative to the matrix with immersion and their local dissolution depth at the same point. When a particle is dissolved, its potential becomes more and more different from that of the matrix until it reaches a critical value for a dissolution depth of about 250 nm. Figure 8 shows the local chemical composition of the S-phase par-ticles共expressed as Cu, Al, and Mg contents兲 vs their local dissolu-tion depth. These graphs show that the dissoludissolu-tion of an S-phase particle parallels a significant decrease of its magnesium content from 25 to nearly 0 atom % and a strong copper enrichment from 25 to 70 atom %. These results are in good agreement with literature because it has often been shown that copper enrichment occurs dur-ing the dissolution of S-phase particles.13,14,17,18,23The copper en-richment of the particles is well correlated with the increase of the potential difference between the S-phase particles and the matrix ⌬V = 共Vparticle− Vmatrix兲t−共Vparticle⬘
− Vmatrix⬘
兲0. Due to an alteration of its chemical composition with copper enrichment, the S-phase particle becomes nobler during immersion, explaining partially the dissolution of the surrounding matrix with the formation of a groove around the perimeter of the particles. This mechanism can be fol-lowed by the measurement of the variation of the SKPFM potential of the particle after immersion.As previously demonstrated, there is a great dispersion both in the reactivity of the S-phase particles共some are not corroded while others strongly dissolve兲 and in the SKPFM potentials of the S-phase particles before immersion. One could wonder if SKPFM could be used as a predictive tool for the corrosion behavior of the
Figure 6. Distribution of the SKPFM potential of S-phase particles relative
to the matrix共a兲 on an as-polished AA2024 sample and 共b兲 after immersion for 60 min in a 0.1 M Na2SO4+ 0.001 M NaCl solution.
Figure 7. Variation of the local SKPFM potential of the S-phase particles
relative to the matrix with immersion ⌬V = 共Vparticle− Vmatrix兲t−共Vparticle⬘
− Vmatrix⬘ 兲0 vs the local dissolution depth after immersion in a
0.1 M Na2SO4+ 0.001 M NaCl solution共samples A–C兲.
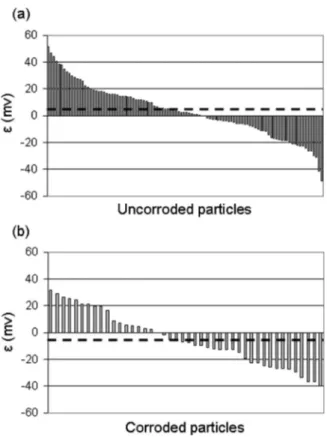
S-phase particles. It would be interesting to check this assumption. Therefore, a statistical analysis of the potentials measured for 300 S-particles before immersion was performed. A correlation between the potential values and the corrosion behavior of the intermetallics was made. Figure 9 shows the deviation, noted as, of the SKPFM potential measured for each particle before immersion from the mean value of the SKPFM potential before immersion obtained with the potentials of all the particles. The parameter was thus defined as = 共Vparticle− Vmatrix兲0−兺n共Vparticle− Vmatrix兲0/n, where n is the
total number of particles. Two cases were taken into account: par-ticles which were found to be uncorroded after immersion in the electrolyte共Fig. 9a兲 and those which were corroded after immersion 共Fig. 9b兲. The mean value of was calculated for both uncorroded particles and corroded particles; these two values are represented by the dashed lines on the graph. The mean value of for the uncor-roded particles is positive共and equal to 4 mV兲, while that for the corroded particles is negative共and equal to −5 mV兲. Therefore, it
could be concluded that the lower the SKPFM potential of an inter-metallic before immersion, the stronger its reactivity during immer-sion. However, it is necessary to point out that the difference be-tween the two mean values 共for uncorroded and for corroded particles兲 is not significant in comparison to potential resolution. Thus, it seems difficult to give a clear answer about the predictive aspect of SKPFM measurements which is in good agreement with the precautions recommended by Rohwerder et al. when conclusions are given from SKPFM measurements performed on as-polished samples.27
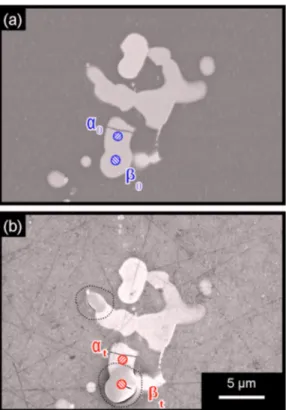
Figures 10 and 11 show, as previously mentioned in Fig. 2, that the dissolution kinetics of an S-phase particle can vary significantly inside the particle. Figures 10a and b correspond to SEM observa-tions of an AA2024 sample before and after a 30 min immersion in chloride-containing sulfate solutions. Figure 10b shows two areas surrounded by a dotted line which appear darker than the other parts of the particles. These two areas were dissolved while no corrosion was observed elsewhere. Particular attention was paid to two parts of the same Al2CuMg particle with different reactivities. The first part,␣, was not corroded, while the other, , dissolved. Figure 11 shows the EDS analyses performed on these two parts before共␣0 and0兲 and after immersion 共␣tandt兲; for ␣ 共Fig. 11a兲 no varia-tion of the chemical composivaria-tion is observed, while for 共Fig. 11b兲 a strong copper enrichment with magnesium dissolution can be no-ticed. For quantitative EDS analysis, calibration was performed us-ing standard samples. The results also show the presence of oxygen; the composition of the oxide covering the corroded particle is about 30 atom % oxygen and 60 atom % copper. Of course, this analysis is not very accurate due to the size of the interaction area between
Figure 8. Local chemical composition of the S-phase particles expressed as
共a兲 Cu content, 共b兲 Al content, and 共c兲 Mg content vs their local dissolution depth after immersion in a 0.1 M Na2SO4+ 0.001 M NaCl solution
共samples A–C兲. The black points indicate the element 共Cu, Al, or Mg兲 con-tent of the intermetallics on the as-polished sample.
Figure 9. Deviation of the SKPFM potential measured for each particle
before immersion from the mean value of the SKPFM potential before im-mersion obtained with the SKPFM potentials of all the particles. The param-eter is defined as = 共Vparticle− Vmatrix兲0−兺n共Vparticle− Vmatrix兲0/n, where
n is the total number of particles:共a兲 particles found uncorroded and 共b兲 particles corroded after immersion in a 0.1 M Na2SO4+ 0.001 M NaCl
so-lution at open-circuit potential. The dashed lines indicate the mean value of for 共a兲 uncorroded and 共b兲 corroded particles.
the electron beam and the material, but it may suggest the formation of a Cu2O oxide film, which is in good agreement with literature.16 In summary, this statistical study allows a quantitative dissolu-tion mechanism to be proposed for the S-phase particles of AA2024;
when an S-phase particle is attacked, its chemical composition changes共the copper content increases while the aluminum and mag-nesium contents decrease兲 until its copper content reaches about 60–70 atom %, corresponding to the formation of a probable Cu2O-rich oxide film on the surface of the particle. This copper enrichment of the S-phase particle parallels a decrease of its poten-tial relative to the matrix down to around −410 mV. Then, the SKPFM potential and the chemical composition of the particle do not evolve any longer while the dissolution depth continues to in-crease. Figure 12 shows that corroded S-phase particles have a po-rous structure arising from heterogeneous dissolution with preferen-tial removal of aluminum and magnesium, leading to copper enrichment.34,35It can be assumed that, subsequent to the formation of the pores in the particle, settling of the structure occurs, which would explain the increase of the dissolution depth while neither the chemical composition nor the SKPFM potential continue to change. Furthermore, due to the copper enrichment, the particle becomes nobler. Oxygen reduction increases on the particle mainly at the particle/matrix interface favoring the dissolution of the surrounding matrix, as observed. When the dissolution of the matrix is so strong that there is no longer any mechanical cohesion with the particle, the particle falls out; the potential measured on this site is then that of the matrix共Fig. 5兲. As a conclusion, when an S-particle is corroded, particle dealloying is observed as well as the formation of a groove around the perimeter of the particle due to increased oxygen reduc-tion on the particle and subsequent alkalinizareduc-tion at the interface particle/matrix.
Conclusion
AFM, SKPFM, and EDS experiments were performed on more than 300 Al2CuMg particles in AA2024 to study their dissolution in chloride-containing solutions. The results show that 共i兲 statistical analysis is necessary for quantitative measurements because the dis-solution kinetics of the S-phase particles varies strongly from one intermetallic to another,共ii兲 dissolution of the S-phase particles
oc-Figure 10.共Color online兲 SEM observations of an AA2024 sample 共a兲
be-fore and 共b兲 after immersion for 30 min in a 0.1 M Na2SO4
+ 0.001 M NaCl solution at open-circuit potential. Two zones,␣ and , are indicated on an S-phase particle.
Figure 11.共Color online兲 EDS analyzes on the 共a兲 ␣ and 共b兲  zone marked
out in Fig. 10 before共solid curve兲 and after 共dotted curve兲 immersion for 30 min in a 0.1 M Na2SO4+ 0.001 M NaCl solution at open-circuit
poten-tial.
Figure 12. SEM observations of an S-phase particle in a 共a兲 70° tilted
AA2024 specimen and共b兲 not tilted AA2024 specimen after immersion for 180 min in a 0.1 M Na2SO4+ 0.001 M NaCl solution at open-circuit
curs with release of magnesium into the solution resulting in copper enrichment, 共iii兲 dissolution kinetics of S-phase particles can be followed by SKPFM potential measurements because the copper enrichment of the particles parallels a decrease of their potential relative to the matrix. Due to the copper enrichment, the particles become nobler than the matrix and hence favor the dissolution of the surrounding matrix. The particles finally fall from the surface of the material and then there is no longer potential contrast; and共iv兲 even though the measurements are not so trivial to interpret, SKPFM potentials are found to be a powerful tool to follow the dissolution kinetics of intermetallics.
Centre National de la Recherche Scientifique assisted in meeting the publication costs of this article.
References
1. Z. Szklarska-Smialowska, Corros. Sci., 41, 1743共1999兲.
2. J. W. J. Silva, A. G. Bustamante, E. N. Codaro, R. Z. Nakazato, and L. R. O. Hein,
Appl. Surf. Sci., 236, 356共2004兲.
3. A. Garner and D. Tromans, Corrosion (Houston), 35, 55共1979兲.
4. X. Zhao, G. S. Frankel, B. Zoofan, and S. Rokhlin, Corrosion (Houston), 59, 1012 共2003兲.
5. M. Posada, L. E. Murr, C. S. Niou, D. Roberson, D. Little, R. Arrowood, and D. George, Mater. Charact., 38, 259共1997兲.
6. M. R. Bayoumi, Eng. Fract. Mech., 54, 879共1996兲.
7. X. Liu, G. S. Frankel, B. Zoofan, and S. Rokhlin, Corros. Sci., 49, 139共2007兲. 8. I. L. Muller and J. R. Galvele, Corros. Sci., 17, 179共1977兲.
9. J. F. Li, Z. Ziqiao, J. Na, and T. Chengyu, Mater. Chem. Phys., 91, 325共2005兲. 10. J. Galvele and S. De Micheli, Corros. Sci., 10, 795共1970兲.
11. V. Guillaumin and G. Mankowski, Corros. Sci., 41, 421共1998兲. 12. W. Zhang and G. S. Frankel, Electrochim. Acta, 48, 1193共2003兲. 13. C. Blanc, B. Lavelle, and G. Mankowski, Corros. Sci., 39, 495共1997兲.
14. R. G. Buchheit, L. P. Montes, M. A. Martinez, J. Michael, and P. F. Hlava, J.
Electrochem. Soc., 146, 4424共1999兲.
15. N. Birbilis and R. G. Buchheit, J. Electrochem. Soc., 152, B140共2005兲. 16. C. Blanc, A. Freulon, M. C. Lafont, Y. Kihn, and G. Mankowski, Corros. Sci., 48,
3838共2006兲.
17. C. Blanc, S. Gastaud, and G. Mankowski, J. Electrochem. Soc., 150, B396共2003兲. 18. R. G. Buchheit, R. P. Grant, P. F. Hlava, B. Mckenzie, and G. L. Zender, J.
Electrochem. Soc., 144, 2621共1997兲.
19. Y. Yoon and R. G. Buchheit, J. Electrochem. Soc., 153, B151共2006兲. 20. P. Schmutz and G. S. Frankel, J. Electrochem. Soc., 145, 2285共1998兲. 21. P. Schmutz and G. S. Frankel, J. Electrochem. Soc., 145, 2295共1998兲. 22. V. Guillaumin, P. Schmutz, and G. S. Frankel, J. Electrochem. Soc., 148, B163
共2001兲.
23. P. Leblanc and G. S. Frankel, J. Electrochem. Soc., 149, B239共2002兲. 24. T. H. Muster and A. E. Hughes, J. Electrochem. Soc., 153, B474共2006兲. 25. H. O. Jacobs, H. F. Knapp, S. Müller, and A. Stemmer, Ultramicroscopy, 69, 39
共1997兲.
26. J. H. W. de Wit, Electrochim. Acta, 49, 2841共2004兲. 27. M. Rohwerder and F. Turcu, Electrochim. Acta, 53, 290共2007兲.
28. H. O. Jacobs, P. Leuchtmann, O. J. Homan, and A. Stemmer, J. Appl. Phys., 84, 1168共1998兲.
29. T. Ouisse, F. Martins, M. Stark, and S. Huant, Appl. Phys. Lett., 88, 043102 共2006兲.
30. H. O. Jacobs, H. F. Knapp, and A. Stemmer, Rev. Sci. Instrum., 70, 1756共1999兲. 31. B. S. Tanem, G. Svenningsen, and J. Mardalen, Corros. Sci., 47, 1506共2005兲. 32. N. Gaillard, M. Gros-Jean, D. Mariolle, F. Bertin, and A. Bsiesy, Appl. Phys. Lett.,
89, 154101共2006兲.
33. J. Idrac, P. Skeldon, Y. Liu, T. Hashimoto, G. Mankowski, G. Thompson, and C. Blanc, in Proceedings of the 9th International Symposium on the Passivation of
Metals and Semiconductors and the Properties of Thin Oxide Layers, P. Marcus
and V. Maurice, Editors, pp. 167–172, Elsevier B.V., Amsterdam共2006兲. 34. T. Suter and R. C. Alkire, J. Electrochem. Soc., 148, B36共2001兲.
35. R. G. Buchheit, M. A. Martinez, and L. P. Montes, J. Electrochem. Soc., 147, 119 共2000兲.