HAL Id: hal-00317537
https://hal.archives-ouvertes.fr/hal-00317537
Submitted on 28 Feb 2005
HAL is a multi-disciplinary open access
archive for the deposit and dissemination of
sci-entific research documents, whether they are
pub-lished or not. The documents may come from
teaching and research institutions in France or
abroad, or from public or private research centers.
L’archive ouverte pluridisciplinaire HAL, est
destinée au dépôt et à la diffusion de documents
scientifiques de niveau recherche, publiés ou non,
émanant des établissements d’enseignement et de
recherche français ou étrangers, des laboratoires
publics ou privés.
On the relationship between the velocity of E-region HF
echoes and ExB plasma drift
A. V. Koustov, D. W. Danskin, R. A. Makarevitch, J. D. Gorin
To cite this version:
A. V. Koustov, D. W. Danskin, R. A. Makarevitch, J. D. Gorin. On the relationship between the
velocity of E-region HF echoes and ExB plasma drift. Annales Geophysicae, European Geosciences
Union, 2005, 23 (2), pp.371-378. �hal-00317537�
SRef-ID: 1432-0576/ag/2005-23-371 © European Geosciences Union 2005
Annales
Geophysicae
On the relationship between the velocity of E-region HF echoes and
E×B plasma drift
A. V. Koustov1, D. W. Danskin2, R. A. Makarevitch3, and J. D. Gorin1
1Institute of Space and Atmospheric Studies, University of Saskatchewan, 116 Science Place, Saskatoon, S7N 5E2 Canada 2Geological Survey of Canada, Geomagnetic Laboratory, 7 Observatory Cres., Ottawa, K1A 0Y3 Canada
3Department of Communication Systems, Lancaster University, Lancaster, LA1 4YR, UK
Received: 26 April 2004 – Revised: 18 October 2004 – Accepted: 21 October 2004 – Published: 28 February 2005
Abstract. In this study, velocities of E-region HF echoes
ob-served by the Stokkseyri HF radar are compared with E×B plasma drifts in the F-region measured by the DMSP satel-lites. Events were selected for which the DMSP track pro-jected to the height of 110 km was almost perpendicular to the central beams of the radar, resulting in a direct compari-son of the cross-track component of the E×B drift and the line-of-sight HF velocity. We found that the typical ratio of HF velocity to the DMSP drift is ∼0.35 in a range of DMSP drifts of 0–1700 m/s. It is suggested that E-region HF ve-locities, observed both along the electrojet and at large flow angles, are significantly affected by scatter from the bottom of the electrojet layer where the irregularity phase velocity is expected to be strongly depressed with respect to the E×B flow.
Key words. Ionosphere (Ionospheric irregularities; Plasma
waves and instabilities; Auroral ionosphere)
1 Introduction
The presence of magnetic field-aligned, wave-like plasma density irregularities of the meter-decameter scale is an in-herent feature of the high-latitude E-region. Such irregu-larities are believed to be created by the Farley-Buneman (FB) and gradient-drift (GD) plasma instabilities at electro-jet heights (Fejer and Kelley, 1980). The irregularities are routinely detected by VHF and HF coherent radars in those parts of the high-latitude ionosphere where the radio waves propagate almost perpendicular to the Earth’s magnetic field lines.
According to the linear theory of the FB and GD insta-bilities, the velocity of plasma irregularities is, to a first approximation,VE·cos θ , where VEis the E×B plasma drift
(velocity of the electron motion at the electrojet heights) and θis the flow angle between the electron velocity vector and Correspondence to: A. V. Koustov
(sasha.koustov@usask.ca)
the direction of the irregularities’ propagation. This expecta-tion has been widely used for plasma convecexpecta-tion monitoring in VHF experiments, for example, in the STARE experiment (Greenwald et al., 1978; Nielsen and Schlegel, 1985). For the success of the convection estimates, it is fundamentally important that the velocity magnitude is proportional to VE
and varies as a cosine function of the flow angle.
VHF observations show, however, that the relationship be-tween the velocity of electrojet irregularities and the E×B plasma drift is more complicated, especially for the con-dition of strong plasma flows of VE>Cs (where Cs is the
ion-acoustic speed, roughly 400 m/s) when the FB instabil-ity is the prime factor controlling the irregularinstabil-ity production. Nonlinear theories predict that the phase velocity of the FB-related irregularities is close to the ion-acoustic speed within a relatively broad cone of flow angles determined from the equation cos θ∗=Cs/VE (Fejer and Kelley, 1980; Nielsen
and Schlegel, 1985). This property is often referred to as the “Cs saturation” of the irregularity velocity (Nielsen and
Schlegel, 1985). Outside the FB instability cone, it is be-lieved (e.g. Nielsen and Schlegel, 1985) that the irregularities (sometimes called the secondary irregularities) move with the velocityVE·cos θ , as prescribed by the linear theory.
Previous VHF observations showed that indeed the veloc-ity of echoes observed within the FB instabilveloc-ity cone is close to Cs, typically slightly above it (e.g. Nielsen et al., 2002).
Similar results were obtained at UHF (Foster and Erickson, 2000).
VHF observations at large flow angles, outside the FB in-stability cone, are somewhat controversial. Evidences have been presented that the line-of-sight (l-o-s) velocity is, to a first approximation, the cosine component of the E×B plasma drift (Reinleitner and Nielsen, 1985; Nielsen et al., 2002), especially at 50 MHz (Ecklund et al., 1977). How-ever, Kustov and Haldoupis (1992) published STARE data for large flow angles indicating that the l-o-s velocity can be 10–20% smaller than the plasma drift component along the beam. This velocity “depression” was attributed to the aspect angle effect.
372 A. V. Koustov et al.: The velocity of E-region HF echoes and E×B plasma drift
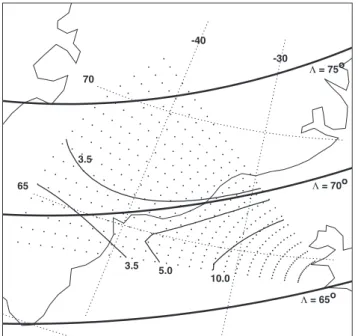
Fig. 1. The field-of-view of the Stokkseyri SuperDARN radar at
ranges 180–1260 km. Each dot represents the location of the begin-ning of a radar cell. The height of 110 km is assumed. The thin lines are the zero aspect angles of observations for various electron den-sities in the ionosphere (denden-sities are shown in units of 1010m−3) at 110 km and the radar frequency of 12 MHz. The thick lines are the AACGM magnetic latitudes of 65◦, 70◦, and 75◦.
Such interpretation is consistent with the generally ac-cepted notion that the VHF velocity is aspect-angle sen-sitive, implying that the expected l-o-s velocity at certain radar direction cannot be computed by simple multiplica-tion of VE and the cosine of the flow angle (e.g. Ogawa et
al., 1982; Nielsen, 1986; Kustov et al., 1994; Kustov et al., 1997). More recently, Koustov et al. (2002) reported an even stronger STARE velocity depression, though the effect might be attributed to the shorter pulse separation in the modified STARE system.
The relationship between the velocity of HF coherent echoes and the E×B plasma drift has been less investigated than at VHF/UHF. The major problem is the significant diffi-culty of obtaining concurrent data; one needs an HF radar ca-pable of detecting echoes over an area where the E×B vec-tor is monivec-tored continuously by an independent instrument. One such instrument can be incoherent scatter radar. One might think that the currently existing chain of SuperDARN HF radars (Greenwald et al., 1995) should provide ample data to work with. However, appropriate data can only be collected in a short-range viewing zone of the Hankasalmi-Finland radar over the CP-1 spot of the incoherent scatter radar EISCAT. In addition, the analysis of Hankasalmi data indicates that the majority of echoes over the EISCAT CP-1 spot come from the F-region (e.g. Davies et al., 1999; Dan-skin et al., 2002). A limited EISCAT-Hankasalmi E-region HF velocity comparison by Davies et al. (1999) showed that the l-o-s velocities were typically smaller than the E×B flow
components. Unfortunately, no information on the flow an-gle of observations was provided.
E-region HF radar observations alone, without comple-mentary E×B measurements, are somewhat contradictory. At small flow angles (presumably within the FB instabil-ity cone), from one side, a clear statistical clustering of HF velocities near 400 m/s (typical Cs value) was reported
(Hanuise et al., 1991; Milan and Lester, 2001). On the other hand, large velocities of more than 700 m/s are not rare (Milan and Lester, 1998; 2001) and strong velocity change with the flow angle within the FB instability cone has been reported (Milan and Lester, 2001; Uspensky et al., 2001; Makarevitch et al., 2002b). We should note that the veloc-ity variation with flow angle inside the FB instabilveloc-ity cone was recently reported for the STARE radars (Nielsen et al., 2002).
At large flow angles of HF observations, Koustov et al. (2002) and Makarevitch et al. (2004) presented evidence from indirect measurements that the velocity of E-region HF echoes is significantly smaller than the E×B component. These results seem to disagree with the ones reported by Jay-achandran et al. (2000), who compared DMSP ion drift mea-surements and Saskatoon HF data for observations at large flow angles and concluded that the HF velocity does indeed correspond to the DMSP drift.
In this study we continue the investigation of the relation-ship between the Doppler velocity of E-region HF echoes and E×B plasma drifts by considering the Stokkseyri HF radar measurements and DMSP ion drifts. The Stokkseyri observations were selected for a simple reason that as the DMSP satellites cross this radar field-of-view (FoV), their cross-track directions are almost a perfect match to some of the radar beam orientations. Thus, a direct comparison of the E×B component and the radar l-o-s velocity can be per-formed without invoking the assumption that the irregularity velocity changes with the flow angle according to the cosine rule.
2 Experiment configuration and data selection
Stokkseyri SuperDARN data from the standard mode of op-eration (scanning from beam 15 to beam 0 in one/two min-utes) were used in this study. The raw data set consisted of power, velocity and width estimated according to the FITACF procedure (Villain et al., 1987; Greenwald et al., 1995). For the selection of pure E-region events, several conditions were considered, as often the HF echoes were ob-served as a broad “blob” extending from 300 to >800 km.
Figure 1 shows the FoV of the Stokkseyri radar for ranges 180–1260 km. Each individual dot represents the beginning of a radar cell at a height of 110 km. We also show the lines of zero aspect angles at a height of 110 km and for electron densities (Ne)of 3.5, 5.0 and 10.0×10¹⁰m−3(at this height)
with the assumption of a uniform density over the FoV. Calculations were performed for the radar frequency of 12 MHz using a simple geometry-optical approach for a
spherical case (Uspensky et al., 1994). The IGRF-99 mag-netic field model was adopted.
For densities below ∼2×10¹⁰m−3, zero aspect angles
cannot be achieved anywhere within the Stokkseyri FoV, and one would not expect E-region echoes. For a slightly denser ionosphere, for example, at Ne=3.5×10¹⁰m−3, two separate
regions of the perfect aspect angle are present, in the far southern and far northern parts of the FoV. The far southern line is unusual; normally one would not have it (for exam-ple, see the STARE aspect angle lines in Greenwald et al., 1978). The new line originates from a special configuration of the Earth’s magnetic field over Greenland and refraction due to the use of HF frequency of 12 MHz. For stronger den-sities, the zero aspect angle lines change their appearance; they cross the FoV in a more east-west direction. With a further density increase, the lines move closer to the radar location and their elongation becomes more and more devi-ated from the L shell directions. This should give a special appearance of the echo bands in terms of power. For exam-ple, for Ne∼10×1010m−3, one would expect the backscatter
at ranges ∼400 km and it should be stretched from south-west to north-east at an angle of ∼30◦with the magnetic L-shells. In addition, because the range of perfect aspect is less in larger number beams, one would expect the power to be stronger in those beams.
An important implication of the aspect angle configuration within the Stokkseyri FoV is that generally one can expect E-region echoes at any range (180–1200 km) but for typical densities of Ne∼10×1010m−3they should be at close ranges
of 300–500 km stretched from south-west to north-east with stronger power in high number beams. This feature was used as one of the criteria for the identification of E-region events. Another criterion for the event selection was that the echo region should not be very broad since the aspect sensitiv-ity of E-region echoes should confine the echoes to limited bands. For some events, the echoes were quite extended, but the Doppler velocity maps clearly indicated that the far edge of the echo region had a very different velocity, hinting that these are F-region echoes at these ranges (see example in Makarevitch et al., 2004). Finally, for many events, addi-tional confirmation that these were indeed E-region echoes comes from the simultaneous detection of F-region echoes or ground scatter at appropriate ranges, similar to Milan and Lester (1998).
Identification of E-region echoes was an important part of the work but the final and the most crucial step in the event selection was the consideration of concurrent DMSP ion drift measurements. The south-west to north-east orientation of the E-region echo bands for the Stokkseyri radar dictates that the DMSP trajectories have to pass the Stokkseyri FoV at short ranges roughly along these orientations to enable a di-rect comparison of the radar velocities and the E×B flow.
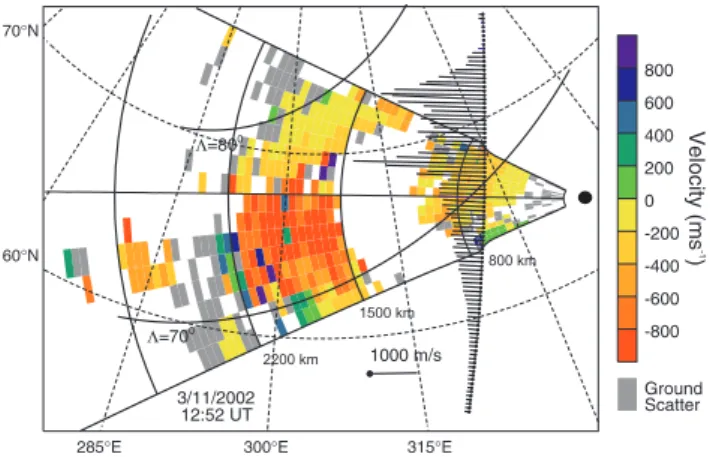
Figure 2 gives an example of the Stokkseyri velocity ob-servations on 3 November 2002 at 12:52–12:53 UT. Two “blobs” of high-velocity echoes are evident with one at short ranges, E-region echoes, and the other one at far ranges, F-region echoes. Even though the echo blobs occur at about the
Fig. 2. The Stokkseyri velocity map at 12:52–12:53 UT on 3 November 2002 and DMSP cross-track ion drifts along the satel-lite pass over the radar field-of-view.
same magnetic latitudes, the F-region velocities are at least two times larger than the E-region ones.
Also shown in Fig. 2 is the trajectory of the DMSP F15 satellite and the measured cross-track E×B ion drift. The DMSP measurements were performed at a height of ∼840 km; the track shown in Fig. 2 is the projection of the satellite location along the magnetic flux lines to a height of 110 km. Such a projection was done to facilitate a direct comparison of the DMSP drifts and the Stokkseyri l-o-s ve-locities. For the projection, the magnetic coordinates of the satellite location were traced down along the same flux line according to the ACCGM model. It was assumed that the electric field does not change with height.
In Fig. 2 one can notice that the DMSP drifts are com-parable in their magnitude with the Stokkseyri far-range F-region velocities (beyond 1500 km) and they are definitely larger than the velocities of the short-range E-region echoes. From Fig. 2, it is clear that as the satellite travels (to lower latitudes), it crosses some radar beams at almost 90◦angles. This is an important requirement for the present work, since the DMSP ion drift measurements along the satellite path are not as reliable as those across the cross-track. The az-imuth difference between the DMSP direction of measure-ments and the Stokkseyri radar beam were computed so that a comparison at various orientations between the radar beams and the cross-track directions was possible to perform. Sim-ilar geometry of the SuperDARN/DMSP measurements was sought for other SuperDARN radars but it turned out that only the Stokkseyri and Syowa-East radars were satisfactory. In this study we consider only the Stokkseyri measurements. Limited analysis of the Syowa-East data supports the major conclusions drawn from the Stokkseyri observations but the event selection is more problematic there because the aspect angle conditions lead to the formation of very narrow bands of E-region echoes, so that common data are infrequent. In addition, the separation between the E- and F-region scatter cases is more difficult as joint measurements occur at larger flow angles.
374 A. V. Koustov et al.: The velocity of E-region HF echoes and E×B plasma drift
Fig. 3. A scheme illustrating the principle of DMSP ion drift data
averaging for the comparison with the SuperDARN line-of-sight ve-locities.
It is important to note that DMSP passes over the Stokkseyri field-of-view were found to occur in between 08:00 UT and 13:00 UT which corresponds to the prenoon (07:00–12:00) MLT sector. This is not the best time for de-tection of E-region HF echoes as they are more frequent dur-ing the evendur-ing hours and nighttime (Milan et al., 1997; Dan-skin et al., 2002).
Figure 3 illustrates our approach to the data comparison. We used 4-s averaged DMSP ion drifts corresponding to the spatial resolution of ∼30 km. The Stokkseyri data were inte-grated (by the radar design) over ∼3 s (1-min scans) or ∼7 s (2-min scans) at every beam position and for every 45-km range cell. There was no exact correspondence of the satellite and radar measurements either in terms of time or in terms of location. To minimize temporal differences, we consid-ered only one Stokkseyri scan that corresponded to the time of DMSP crossing the radar’s central beams. Spatially, each radar cell was associated with 3 measurements of the DMSP that were less than 40 km away from the radar point. For the comparison, the average DMSP ion drift at these sequential measurements along the track was used.
Originally, over 60 passes with proper trajectory orienta-tion were located for observaorienta-tions in 1999–2002 (the period for which the DMSP drift-meter data were accessible to us). Out of these, about half of the passes were not considered for further assessment for a variety of reasons. For some events, the DMSP data were not continuous or had high variabil-ity. Besides concerns about the quality of the DMSP data, such cases might indicate the patchiness of the ionosphere, and comparison with HF data would not make sense since the obtained discrepancies could be explained by spatial and temporal differences in measurements. Some events were ex-cluded from consideration on the basis of the quality of the
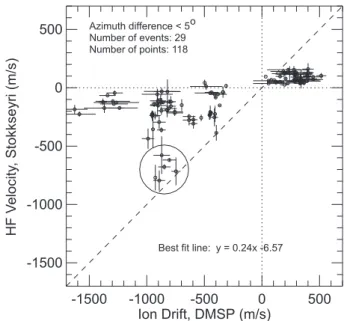
Fig. 4. The line-of-sight Stokkseyri velocity versus DMSP ion drift
when the deviation between the radar and satellite directions of measurements were less than 5◦ and the differences in time were less than 2 min.
radar data; for these the DMSP measurements corresponded to the radar cells just at the edge of the echo band, either at short or far ranges. After this thorough selection, 29 events of reasonable quality were entered into the data base. We should note that the DMSP/Stokkseyri comparison for the whole original data set, without careful checking of the data quality, show tendencies similar to the ones for the selected events, however, with more significant spread in the data.
3 Results of the comparison
In Fig. 4 we compare the l-o-s Stokkseyri velocities with DMSP ion drifts for the 29 joint events. A strict require-ment that the azimuth of the DMSP cross-track velocity and the azimuth of the Stokkseyri beam differ by not more than 5◦was selected. The vertical bar for the HF data corresponds to the error in the FITACF velocity determination (for the FI-TACF procedure, see Villain et al., 1987). The horizontal bar for the DMSP drift is simply the standard deviation. The dashed line is the line of perfect agreement between the data. For positive DMSP drifts (eastward ion motion), one can see that all points but one are located below the line of perfect agreement, and the departure increases for stronger ion drifts. For negative DMSP drifts (westward ion motion), there are two sorts of points. A small minority of points (circled in Fig. 4) is located not far from the line of perfect agreement.
For the majority of the points though, the Stokkseyri ve-locity magnitude is well below the DMSP drift magnitude, similar to the result for the positive DMSP drifts. The velocity inconsistency increases as the ion drift magnitude increases. For example, for DMSP drifts of ∼−400 m/s, the velocity ratio R=VH F/VDMSP is ∼0.25 while for drifts of
∼−1300 m/s it is ∼0.1. The overall mean ratio R is around 0.32. If one were to describe the Stokkseyri-DMSP velocity relationship by a linear line, the slope of the line would be 0.24 and the offset is −6.57 m/s. We should stress that for all DMSP values, there was only one point for which the ion drift was smaller than the Stokkseyri velocity.
As mentioned, the data presented in Fig. 4 satisfy quite a stringent requirement on the alignment between the satellite and radar directions of measurements. Analysis of the avail-able data showed that with an increase in azimuth difference, more points appear with either reasonable agreement or low radar velocities. Also, there are some points for which the radar velocity is somewhat larger that the DMSP velocity, but the number of these points is insignificant. For example, for 15◦of misalignment, 2% of the points had stronger radar
velocities.
4 Discussion
The results indicate that the relationship between the HF velocity and E×B plasma drift is rather complicated. We would like to start the discussion from a cluster of points at VDMSPfrom −700 to −900 m/s for which there was a
rea-sonable agreement between the Stokkseyri and DMSP ve-locities (the circled points in Fig. 4). These occurred infre-quently, but were present in the data set. We believe that these points correspond to the case of radar echo detection from the upper E- or bottom F-regions (for shortness, we will call such points “F-region scatter”). In this case, the veloci-ties indeed should be comparable and this would be consis-tent with previous DMSP/HF velocity comparisons by Baker et al. (1990) and Xu (2003). One may wonder why the F-scatter points appeared in the data statistics despite all possi-ble efforts have been done to only select E-region echoes. In our opinion, the selection process cannot be totally correct, especially if there are patches of enhanced electron density in the ionosphere. We showed that the aspect angle condi-tions are very sensitive to the electron density in the E-region, Fig. 1. The same is also true for the F-region observations. If the ionosphere is patchy, one may obtain the F-region scatter in some radar cell and the E-region scatter in a radar cell not far away. This can be especially true if the considered radar data are collected at relatively far ranges of more than 500– 600 km. Also, for some ranges there might be co-existence of F - and E-region backscatter in one radar cell (Milan and Lester, 1998). One might think that the issue can be resolved with the angle-of-arrival information, however, these mea-surements at Stokkseyri were not always available, and in the cases when they were available, it was difficult to make a judgment. By considering the spectral power distribution for the echoes of reasonable agreement with the Burg spec-tral method (Danskin et al., 2004), we found that some of the circled echoes in Fig. 4 had single-peaked, well-defined spectra, typical of F-region scatter.
If one does not consider these F-region scatter points, the major conclusion from Fig. 4 is that the HF velocity is less
than the E×B component (convection component) for all magnitudes of the flow. This is not a surprising result for drifts faster than ∼500 m/s because it might well be that in these cases, the radar observations were performed within the FB instability cone such that the irregularity phase velocity was “saturated” at the ion acoustic speed Cs. The only
dif-ficulty with this explanation would be that the observed HF velocities were 100–300 m/s, which is below the typical ion-acoustic speed of 400 m/s. One of the ways to understand this result is to accept that the phase velocity of decameter irreg-ularities is modified by the sharp gradients of the background plasma, as suggested by St-Maurice et al. (1994). This may be the case but we think that other explanations are also pos-sible.
Danskin et al. (2004) discovered that E-region HF echoes were often double/multiple-peaked and the FITACF velocity (that was used in producing of Fig. 4 and that was obtained according to the procedure outlined by Villain et al., 1987) corresponded usually to the velocity somewhere in between the shift in the high- and low-velocity components. Accord-ing to Danskin et al. (2004), the most likely reason for the frequent double-peak E-region echo occurrence at HF is that typical propagation conditions are such that echo detection from both the top and bottom of the electrojet layer is possi-ble, as originally pointed out by Uspensky et al. (1994). One can hypothesize that this is the case for the present observa-tions. In this situation, one might expect the high-velocity peak to be close to the Cs values. To check this scenario, we
considered 22 events (all events for which this type of analy-sis was technically possible) and performed the spectral anal-ysis with the Burg method similar to Danskin et al. (2004). Results are shown in Fig. 5.
In panel (a) of Fig. 5 we present observations for which single-peaked spectra were detected. There were 19 points spread over 11 events. Clearly, the points are of two kinds. Six points lie very close to the line of perfect agreement be-tween the radar and satellite data. Out of these, four points are at relatively low DMSP drifts so that the radar mea-surements very likely refer to large flow angles for which agreement is expected if the echoes originated from the cen-tral/upper part of the electrojet layer. The two points at VDMSP∼850 m/s correspond probably to the detection of
F-region echoes, as discussed above; also, it is hard to expect the ion-acoustic velocity in access of ∼650 m/s. We note that these two points were reported as the points within the circle in Fig. 4. For the other fifteen points in panel (a), the radar velocity magnitude is of the order of 100 m/s and much smaller than the ion drift.
Panel (b) shows the FITACF velocity versus the DMSP ion drift for those measurements for which the spectra were double-peaked according to the Burg analysis. The total amount of points is 65; they occurred in 22 events. Clearly, there is a number of points for which the radar velocity is well below the DMSP drifts, especially for VDMSP in
be-tween −750 and −1700 m/s. One would expect that the radar observations were performed in directions close to the plasma convection (electron flow), within the FB instability
376 A. V. Koustov et al.: The velocity of E-region HF echoes and E×B plasma drift
Fig. 5. A comparison of the Stokkseyri l-o-s velocity (FITACF)
and DMSP cross-track ion drift for 22 events. Panels (a) and (b) correspond to the cases of single- and double-peaked HF echoes. Panel (c) shows velocities of low- (open circles) and high- (filled circles) shifted components of the double-peaked echoes as given by the Burg spectrum analysis.
cone. If one compares the velocity ratios R=VH F/VDMSP
for these data with the velocity ratios at VHF (Nielsen and Schlegel, 1985), a conclusion can be made that the velocity “depression” is stronger at HF (for the FITACF case) within the FB instability cone.
Panel (c) presents the velocity of high-shifted (filled cir-cle) and low-shifted (open circir-cle) components for the mea-surements selected in panel (b). One can notice that the high-shifted velocities are larger than the FITACF veloci-ties in panel (b) with quite a few at 400–500 m/s, within the range of expected values of Cs. One can associate these
points with the detection of ion-acoustic waves, and the re-sult would be consistent with the ones reported by Nielsen
and Schlegel (1985) at VHF and Foster and Erickson (2000) at UHF. The multi-peak nature of many E-region echoes im-plies that the identification of Cs saturated waves with the
SuperDARN FITACF velocity data can often be problematic. Some of the high-shifted points in panel (c) are close to the line of perfect agreement between the radar and satellite data, especially for positive DMSP velocities. The points for VDMSP=0–400 m/s, located around the line of perfect
agree-ment, can be interpreted in two ways. One possibility is that these echo components are in fact the top-side E or bottom-side F-region scatter; in this case the explanation of high-velocity peaks is the same as the one proposed for the points circled in Fig. 4. Another possibility is that, indeed, the ve-locity of decameter irregularities near or outside the FB in-stability cone is roughly the cosine component of the E×B plasma drift as one would expect on the basis of previous VHF (e.g. Nielsen et al., 2002) and HF (Villain et al., 1987; Jayachandran et al., 2000) observations. With the data avail-able, we are not able to distinguish from the above two inter-pretations, hence more comparisons of the E-region HF ve-locity with plasma drift are needed. Clearly, joint work with incoherent scatter radar would be of the most help, since for such observations one can obtain information on the full vec-tor of plasma drift, the ion-acoustic speed and the instability cone, as well as the electron density profiles needed for eval-uation of the propagation conditions.
The data presented in Fig. 5c for the low-shifted com-ponents are consistent with some recent HF observations. Makarevitch et al. (2001) reported a cluster of 12-MHz echoes whose (FITACF) velocity was low and significantly smaller than the velocity of concurrently observed 50-MHz echoes at the Antarctic Syowa station. We recall that the 50-MHz velocity is believed to be close to the E×B con-vection component (e.g. Ecklund et al., 1977). Koustov et al. (2002) reported low Finland HF (FITACF) velocities that were smaller than (or comparable with) the VHF velocities that were estimated to be lower that the E×B drift due to as-pect angle attenuation. And finally, Makarevitch et al. (2004) analyzed the azimuthal distribution of the E-region HF (FI-TACF) velocities and concluded that they are strongly de-pressed with respect to the F-region convection estimated from simultaneously observed F-region echoes at slightly larger ranges.
We believe that the low-shifted spectral components in Fig. 5c correspond to the echo detection from the bottom of the electrojet layer. We are of the same opinion with respect to the single-peaked points in Fig. 5a with strongly depressed velocity. The irregularity phase velocity depression at the bottom of the electrojet layer can be strong for several rea-sons.
One of these is the collisional depression, as suggested by Koustov et al. (2002). Indeed, the more precise ex-pression for the phase velocity of the electrojet irregulari-ties is VE·cos θ/(1+ψ ), where the factor ψ depends upon
both the collision frequencies of electrons and ions with neutrals (νen, νin)and the aspect angle (α) of observations, ψ =νenνin/ ei[1+(2e/νen2 )sin2α], e and i are the
electron and ion gyrofrequencies (Fejer and Kelley, 1980). In a case of ψ>1–2, one can indeed expect strong depres-sion of the velocity. This can happen if plasma waves are excited at the bottom of the electrojet layer where, in addi-tion, the aspect angles of waves are non zero. With respect to the non-zero aspect angles, we should note that the E-region HF echoes are often believed to be received from exactly zero aspect angles (e.g. Moorcroft, 2002). The present compari-son has been performed for the middle part of E-region echo bands where the power was generally at maximum so that the best (not necessarily zero) aspect angles were expected. However, Uspensky et al. (1994) and Uspensky et al. (2003) forwarded an idea that an E-region HF echo is a combination of a scatter from a range of heights and a range of aspect an-gles so that the effective aspect angle is actually always non-zero. Whether this hypothesis is generally correct requires further investigation.
Another possible reason for strong velocity depression for the low-shifted components is their excitation through neutral wind related plasma instabilities (Kagan and Kel-ley, 1998; 2000), collisional thermal instabilities (Dimant and Sudan, 1995, 1997) or simply due to neutral wind tur-bulence (Gurevich et al., 1997). We note that the veloci-ties of some low-shifted components are very close to zero which might indicate that in fact these echoes are simply the ground scatter received through anomalous radio wave prop-agation channels. Ground scatter at short ranges of 400–500 km can be expected in the presence of strong electron density patches.
Finally, the reported differences between the DMSP ion drift and Stokkseyri l-o-s velocity can result from violation of the cosine rule for the velocity variation with the flow angle. For observations within the FB instability cone, this statement is simply a re-wording of the fact that the veloc-ity is saturated at Cs. For observations at large flow angles,
one may expect deviations from the cosine rule because of the ion-drift contribution to the irregularity phase velocity as argued by Makarevitch et al. (2002b), who presented data for the E-region HF velocities, indicating the violation of the cosine rule. Later, Makarevitch et al. (2004) showed that in-clusion of the ion contribution under the assumption of the finite aspect angle (as suggested by Uspensky et al., 2003) allows for an explanation for some features in the HF veloc-ity azimuthal behavior identified by the Finland SuperDARN radar. The data of the present study do not allow for investi-gation of the validity of the cosine rule, since the full vector of the E×B drift was not available.
5 Conclusions
In this study we compared directly the velocity of E-region Stokkseyri HF echoes and the E×B plasma drift component along the radar beam as measured by the DMSP satellites and showed that:
1. The FITACF velocity is typically smaller than the E×B component in a broad range of DMSP drifts
between 0 and 1700 m/s. The overall average ratio R=VH F/VDMSP is 0.35. This ratio is ∼0.41 for low
drifts of <400 m/s and can be as low as 0.1 for large drifts of >1000 m/s.
2. The observed spectra of short-range Stokkseyri echoes are often double-peaked. The spectral analysis of such echoes with the Burg method shows that of the two spectral components, the high-velocity one is close to the E×B drift for the slow plasma flows of <400 m/s. The high-velocity component is in the range of 400– 700 m/s (possible Csvalues) for fast plasma flows of >700 m/s. For all strengths of the plasma flow, the low-shifted Stokkseyri velocity magnitudes are in between 0 and 200 m/s. The low velocities were also observed for some of the single-peaked HF echoes.
3. One of the reasons for the HF FITACF velocity being smaller than the E×B drift component can be the pres-ence of a low-shifted echo component corresponding most likely to the scatter from the bottom of the elec-trojet layer.
Acknowledgements. The Stokkseyri SuperDARN radar is operated
by LPCE/CNRS (France). The research was supported by NSERC (Canada) grant to AVK and PPARC (UK) funding to RAM. The DMSP ion drift data were obtained from the U of Texas at Dallas website. The authors thank P. Kulyk for his contribution to the data processing and K. McWilliams for kind help with software devel-opment.
Topical Editor M. Lester thanks J.-P. Villain and K. Hosokawa for their help in evaluating this paper.
References
Baker, K. B., Greenwald, R. A., Ruohoniemi, J. M., Dudeney, J. R., Pinnock, M., Newell, P. T., Greenspan, M. E., and Meng, C. I.: Simultaneous HF-radar and DMSP observations of the cusp, Geophys. Res. Lett., 17, 1869–1872, 1990.
Danskin, D. W., Koustov, A. V., Ogawa, T., Nishitani, N., Nozawa, S., Milan, S. E., Lester, M., and Andr´e, D.: On the factors con-trolling occurrence of F-region coherent echoes, Ann. Geophys., 20, 1385–1397, 2002,
SRef-ID: 1432-0576/ag/2002-20-1385.
Danskin, D. W., Koustov, A. V., Makarevitch, R. A., and Lester, M.: Observations of double-peaked E-region coherent spec-tra with the CUTLASS Finland HF radar, Radio Sci., 39, doi:10.1029/2003RS0029032, 2004.
Davies, J. A., Lester, M., Milan, S. E., and Yeoman, T. K.: A com-parison of velocity measurements from the CUTLASS Finland radar and the EISCAT UHF system, Ann. Geophys., 17, 892– 902, 1999,
SRef-ID: 1432-0576/ag/1999-17-892.
Dimant, Ya. S. and Sudan, R. N.: Kinetic theory of the Farley-Buneman instability in the E-region of the ionosphere, J. Geo-phys. Res., 100, 14 605–14 623, 1995.
Dimant, Ya. S. and Sudan, R. N.: Physical nature of a new cross-field current-driven instability in the lower ionosphere, J. Geo-phys. Res., 102, 2551–2563, 1997.
378 A. V. Koustov et al.: The velocity of E-region HF echoes and E×B plasma drift
Ecklund, W. L., Balsley B. B., and Carter D. A.: A preliminary comparison of F-region plasma drifts and E-region irregularity drifts in the auroral zone, J. Geophys. Res., 82, 195–197, 1977. Fejer, B. G. and Kelley, M. C.: Ionospheric irregularities, Rev.
Geo-phys., 18, 401–454, 1980.
Foster, J. C. and Erickson, P. J.: Simultaneous observations of E-region coherent backscatter and electric field amplitude at F-region heights with the Millstone Hill UHF radar, Geophys. Res. Lett., 27, 3177–3180, 2000.
Greenwald, R. A., Weiss, W., Nielsen, E., and Thomson, N. R.: STARE: A new radar auroral backscatter experiment in Northern Scandinavia, Radio Sci., 13, 1021–1029, 1978.
Greenwald, R. A., Baker, K. B., Dudeney, J. R., Pinnock, M., Jones, T. B., Thomas, E. C., Villain, J.-P., Cerisier, J.-C., Senior, C., Hanuise, C., Hunsuker, R. D., Sofko, G., Koehler, J., Nielsen, E., Pellinen, R., Walker, A. D. M., Sato, N., and Yamagishi, H.: DARN/SuperDARN: A global view of the dynamics of high-latitude convection, Space Sci. Rev., 71, 763–796, 1995. Gurevich, A. V., Borisov, N. D., and Zybin, K. P.: Ionospheric
tur-bulence induced in the lower part of the E-region by the turbu-lence of the neutral atmosphere, J. Geophys. Res., 102, 379–388, 1997.
Hanuise, C., Villain, J.-P., Cerisier, J. C., Senior, C., Ruohoniemi, J. M., Greenwald, R. A., and Baker, K. B.: Statistical study of high-latitude E-region Doppler spectra obtained with SHERPA HF radar, Ann. Geophys., 9, 273–285, 1991.
Jayachandran, P. T., St.-Maurice, J.-P., MacDougall, J. W., and Moorcroft, D. R.: HF detection of slow long-lived E-region plasma structures, J. Geophys. Res., 105, 2425–2442, 2000. Kagan, L. M. and Kelley, M. C.: A wind-driven gradient drift
mech-anism for mid-latitude E-region ionospheric irregularities, Geo-phys. Res. Lett., 25, 4141–4144, 1998.
Kagan, L. M. and Kelley, M. C.: A thermal mechanism for gener-ation of small-scale irregularities in the ionospheric E-region, J. Geophys. Res., 105, 5291–5303, 2000.
Koustov, A. V., Danskin, D. W., Uspensky, M. V., Ogawa, T., Jan-hunen, P., Nishitani, N., Nozawa, S., Lester, M., and Milan, S.: Velocities of auroral coherent echoes at 12 and 144 MHz, Ann. Geophys., 20, 1647–1661, 2002,
SRef-ID: 1432-0576/ag/2002-20-1647.
Kustov, A. V. and Haldoupis, C.: Irregularity drift velocity esti-mates in radar auroral backscatter, J. Atmos. Terr. Phys., 54, 415– 423, 1992.
Kustov, A. V., Uspensky, M. V., Sofko, G. J., Koehler, J. A., and Mu, J.: Aspect angle dependence of the radar aurora Doppler velocity, J. Geophys. Res., 99, 2131–2144, 1994.
Kustov, A. V., Koehler, J. A., Sofko, G. J., Danskin, D. W., and Schiffler, A.: Relationship of the SAPPHIRE-North merged ve-locity and the plasma convection veve-locity derived from simulta-neous SuperDARN radar measurements, J. Geophys. Res., 102, 2495–2501, 1997.
Makarevitch, R. A., Ogawa, T., Igarashi, K., Koustov, A. V., Sato, N., Ohtaka, K., Yamagishi, H., and Yukimatu, A.: On the power-velocity relationship for 12- and 50-MHz auroral coher-ent echoes, J. Geophys. Res., 106, 15 455–15 469, 2001. Makarevitch, R. A., Koustov, A. V., Andr´e, D., Sofko, G.
J., and Ogawa, T.: Multi-frequency measurements of HF Doppler velocity in the auroral E-region, J. Geophys. Res., 107, 10.1029/2001JA000268, 2002a.
Makarevitch, R. A., Koustov, A. V., Igarashi, K., Ohtaka, K., Ogawa, T., Nishitani, N., Sato, N., Yamagishi, H., and Yuki-matu, A. S.: Comparison of flow angle variations of E-region
echo characteristics at VHF and HF, Adv. Polar Upper Atmos. Res., 16, 59–83, 2002b.
Makarevitch, R. A., Honary, F., and Koustov, A. V.: Simultaneous HF measurements of E- and F-region Doppler velocities at large flow angles, Ann. Geophys., 22, 1177–1185, 2004,
SRef-ID: 1432-0576/ag/2004-22-1177.
Moorcroft, D. R.: Outstanding issues in the theory of radar aurora: Evidence from the frequency dependence of spectral characteris-tics, J. Geophys. Res., 107, 10.1029/2001JA009218, 2002. Milan, S. E., Yeoman, T. K., Lester, M., Thomas, E. C., and Jones,
T. B.: Initial backscatter occurrence statistics from the CUT-LASS HF radars, Ann. Geophys., 15, 703–718, 1997,
SRef-ID: 1432-0576/ag/1997-15-703.
Milan, S. E. and Lester, M.: Simultaneous observations at differ-ent altitudes of ionospheric backscatter in the eastward electrojet, Ann. Geophys., 16, 55–68, 1998,
SRef-ID: 1432-0576/ag/1998-16-55.
Milan, S. E. and Lester, M.: A classification of spectral populations observed in HF radar backscatter from the E-region auroral elec-trojects, Ann. Geophys., 19, 189–204, 2001,
SRef-ID: 1432-0576/ag/2001-19-189.
Nielsen, E.: Aspect angle dependence of mean Doppler velocities of 1-m auroral plasma waves, J. Geophys. Res., 91, 10 173–10 177, 1986.
Nielsen, E. and Schlegel, K.: Coherent radar Doppler measure-ments and their relationship to the ionospheric electron drift ve-locity, J. Geophys. Res., 90, 3498–3504, 1985.
Nielsen, E., del Pozo, C. F., and Williams, P. J. S.: VHF coherent radar signals from the E-region ionosphere and the relationship to electron drift velocity and ion-acoustic velocity, J. Geophys. Res., 107, 10.1029/2001JA900111, 2002.
Ogawa, T., Balsley, B. B., Ecklund, W. L., Carter, D. A., and John-ston, P. E.: Auroral radar observations at Siple Station, Antarc-tica, J. Atmos. Terr. Phys., 44, 529–537, 1982.
Reinleitner, L. A. and Nielsen, E.: Self-consistent analysis of elec-tron drift velocity measurements with the STARE/SABRE sys-tem, J. Geophys. Res., 90, 8477–8486, 1985.
St.-Maurice, J. P., Prikryl, P., Danskin, D. W., Hamza, A. M., Sofko, G. J., Koehler, J. A., Kustov, A. V., and Chen, J.: On the origin of narrow non-ion- acoustic coherent spectra in the high-latitude E-region, J. Geophys. Res., 99, 6447–6474, 1994.
Uspensky, M. V., Kustov, A. V., Sofko, G. J., Koehler, J. A., Villain, J.-P., Hanuise, C., Ruohoniemi, J. M., and Williams, P. J. S.: Ionospheric refraction effects in slant range profiles of auroral HF coherent echoes, Radio Sci., 29, 503–517, 1994.
Uspensky, M. V., Koustov, A .V., Eglitis, P., Huuskonen, A., Milan, S. E., Pulkkinen, T., and Pirjola, R.: CUTLASS HF radar ob-servations of high-velocity E-region echoes, Ann. Geophys., 19, 411–424, 2001,
SRef-ID: 1432-0576/ag/2001-19-411.
Uspensky, M. V., Koustov, A. V., Janhunen, P., Pellinen, R., Dan-skin, D., and Nozawa, S.: STARE velocities: the importance of off-orthogonality and ion motions, Ann. Geophys., 21, 729–743, 2003,
SRef-ID: 1432-0576/ag/2003-21-729.
Villain, J. P., Greenwald, R. A., Baker, K. B., and Ruohoniemi, J. M.: HF radar observations of E-region plasma irregularities produced by oblique electron streaming, J. Geophys. Res., 92, 12 327–12 342, 1987.
Xu, L.: SuperDARN-derived plasma convection: Comparison with other data and application to field-aligned current measurements, PhD. Thesis, Univ. of Saskatchewan, Saskatoon, Canada, 2003.