HAL Id: hal-00318316
https://hal.archives-ouvertes.fr/hal-00318316
Submitted on 8 May 2007
HAL is a multi-disciplinary open access
archive for the deposit and dissemination of
sci-entific research documents, whether they are
pub-lished or not. The documents may come from
teaching and research institutions in France or
abroad, or from public or private research centers.
L’archive ouverte pluridisciplinaire HAL, est
destinée au dépôt et à la diffusion de documents
scientifiques de niveau recherche, publiés ou non,
émanant des établissements d’enseignement et de
recherche français ou étrangers, des laboratoires
publics ou privés.
interplanetary parameters: the role of suprathermal ions
N. Yagova, V. Pilipenko, J. Watermann, K. Yumoto
To cite this version:
N. Yagova, V. Pilipenko, J. Watermann, K. Yumoto. Control of high latitude geomagnetic
fluctua-tions by interplanetary parameters: the role of suprathermal ions. Annales Geophysicae, European
Geosciences Union, 2007, 25 (4), pp.1037-1047. �hal-00318316�
www.ann-geophys.net/25/1037/2007/ © European Geosciences Union 2007
Annales
Geophysicae
Control of high latitude geomagnetic fluctuations by interplanetary
parameters: the role of suprathermal ions
N. Yagova1, V. Pilipenko1, J. Watermann2, and K. Yumoto3
1Institute of the Physics of the Earth, Moscow, Russia 2Danish Meteorological Institute, Copenhagen, Denmark 3Kyushu University, Fukuoka, Japan
Received: 14 July 2006 – Revised: 7 March 2007 – Accepted: 30 March 2007 – Published: 8 May 2007
Abstract. We examine the statistical relationships between
the interplanetary parameters and spectral power of the geo-magnetic fluctuations in the 1–4 mHz frequency band at high latitude stations in two hemispheres. For that, we use a cross-correlative analysis of different combinations of parameters to identify a factor contributing most to the ULF power and to choose (whenever possible) the cross-related keynote con-trolling parameters. Along with the well-known dependen-cies of the high latitude pulsation power on the solar wind velocity and variations of the SW dynamical pressure and an additional factor – the flux of solar suprathermal ions with energies about several keV, has been established.
Keywords. Magnetospheric physics (MHD waves and
in-stabilities; Polar cap phenomena)
1 Introduction
The broadband fluctuations in the nominal Pc5-6/Pi3 range (from ∼1 mHz to ∼10 mHz) are the most common mani-festation of geomagnetic activity at high geomagnetic lati-tudes. The fluctuations with millihertz frequencies lie at the boundary between lowest eigenmodes of the Earth’s mag-netosphere and quasi-static variations. The most intense sources of broadband pulsations are associated with the day-side cusp region and nightday-side auroral oval. The dedicated studies of the long-period pulsations in the polar caps by Yagova et al. (2002, 2004) have shown that these geomag-netic fluctuations, coined Pi3CAPpulsations, are not reduced
to a poleward extension of the auroral or cusp activity. The variations of Pi3CAPspectral power have a significant
com-ponent specific to the polar cap only. Mechanisms of these high latitude long-period geomagnetic fluctuations have not been firmly established yet, though some theoretical models
Correspondence to: N. Yagova
(Allan and Wright, 2000; Pilipenko et al., 2005) may be rel-evant to at least part of the observed variations. A thorough examination of ULF signatures in the polar cap regions may reveal specific magnetotail or mantle wave modes. A possi-ble control of Pi3CAPpulsations by the solar wind/IMF has
not been examined so far.
The most important interplanetary parameter for the in-tensity/occurrence of the geomagnetic fluctuations almost at all geomagnetic latitudes and throughout the ULF frequency range from few mHz (Pc5) (Engebretson et al., 1998; Venner-strom, 1999) to ∼0.1 Hz (Pc2-3) (Yedidia, 1991) is the solar wind (SW) velocity. This fact is commonly interpreted as an indication on the key role of the KH instability at the inter-face between the magnetosphere and the solar plasma flow in generation of magnetospheric ULF activity. Besides SW velocity, steep or periodical variations of the SW dynamic pressure can stimulate Pc5 pulsations (Kepko et al., 2002, 2003; Kim et al., 2002) and references therein. Under favor-able conditions, the high latitude long-period pulsations can be driven by the IMF quasi-periodic oscillations (Prikryl et al., 1999; Pilipenko et al., 2000; Kepko et al., 2002). Impor-tant source of the Pc3-4 (∼10–100 mHz) waves in the Earth’s foreshock is the suprathermal protons reflected and acceler-ated at the bow shock (Blanco-Cano and Schwartz, 1997). Foreshock diffuse ions are associated with the hydromag-netic waves at frequencies 0.01–0.05 Hz and reflected ions are related to the high frequency (∼1 Hz) waves (Hoppe et al., 1981). To find sources of the high latitude Pi3 pulsa-tions, a comprehensive statistical study of their correlations with the interplanetary parameters is necessary. In this paper we study the statistical relationships of the spectral power of the geomagnetic field fluctuations in the nominal Pc5-6/Pi3 frequency band with interplanetary parameters including the SW velocity, SW dynamic pressure and its fluctuations, in-terplanetary magnetic field (IMF), and the suprathermal ion fluxes.
Table 1. Information about observatories.
Station Code Geo CGM MLT
midn.
LAT LON LAT LON in UT
Vostok VOS −78.5 106.8 −83.3 54.4 01:01
Mawson MAW −67.6 62.9 −70.2 89.8 22:42
BAS A81 A81 −81.5 3.0 −68.6 36.5 02:18
Alert ALE 82.5 297.7 87.0 101.9 21:34 Thule THL 77.5 290.8 85.4 32.9 02:57 Godthab GHB 64.2 308.3 70.6 38.2 02:32 Bear BJN 74.5 19.2 71.4 108.7 20:59 Island Kotelny KTN 75.9 137.7 70.2 201.6 15:48 Fort FCC 58.8 265.9 69.1 331.9 06:35 Churchill Yellow- YKC 62.5 245.5 69.7 298.8 08:35 knife
2 Database of ground and spacecraft observations
Yagova et al. (2004) showed with the use of multi-regression statistical analysis that Pi3 power at cap latitudes can be pre-sented as a sum of four components: auroral, cusp, pure cap, and local noise. The auroral and pure cap components are bigger than the other two. This determines the choice of stations for the present analysis: 3 stations deep in the polar caps – Antarctic base Vostok (VOS), and Arctic sta-tions Alert (ALE) and Qaanaaq (Thule, THL), and 7 auro-ral stations at ∼70◦CGM latitude: BAS A81 and Mawson (MAW) in Antarctica, and Nuuk (Godhaben, GHB), Bear Is-land (BJN), Kotelny (KTN), Yellowknife (YKC), and Fort Churchill (FCC) in the Northern Hemisphere. All the sta-tions are equipped with flux-gate magnetometers with 1 min or better time resolution. The data has been filtered and deci-mated to common 1-min cadence. The information about the observatory coordinates is given in Table 1 We have taken for analysis 23 months with the best data coverage from Febru-ary 1997 to December 1998.
The data on the SW plasma, IMF, and keV-ions are taken from WIND satellite, located for the majority of intervals more than 100 RE upstream the magnetopause. In our
anal-ysis, the following parameters have been used: SW veloc-ity along Sun-Earth axis V , dynamic pressure P , IMF BZ
component, and omni-directional ion fluxes J detected by WIND-3DP experiment in 7 energy channels with energies
E from 0.07 KeV to 400 KeV.
3 Data processing technique
We try to reveal possible sources of the high latitude ULF energy. For that we examine the interplanetary factors which may control the variation of ULF spectral power on the ground and in space. Taking into account that there is no
es-sential difference in time behavior of narrow-band and broad-band pulsations in the polar caps in Pc5-6/Pi3 frequency range (Yagova et al., 2002) and that noise-type fluctuations dominate at high latitudes we use the notation Pi3 for all the pulsation studied and Pi3CAPfor those measured in the
polar caps. The boundaries of the frequency band chosen 1–4 mHz are determined by, on the one hand, an expected lowest frequency of the magnetospheric oscillations (1 mHz,
T ∼17 min) and, on the other hand, by the requirement of
the spectral estimate stability for 1 min sampling rate. We use 2-h running window to calculate the mean values of in-terplanetary parameters and the Pi3 spectral power, which corresponds to ∼7 periods at lowest possible frequency un-der study. A routine data pre-processing procedure includes elimination of instrumental spikes, interpolation to a com-mon sampling rate, and detrending. Intervals with long gaps are excluded from the analysis and short (several points) data gaps are filled with interpolated values. A time window is considered valid for analysis if it includes at least 90 min of continuous record. Thus, the actual length of time interval varies from 90 to 120 min and we do not use overlapping windows to avoid the variation in the degree of overlapping. Two-hour mean values of the SW velocity V , dynamical pressure, P , and ion flux, J , from a specific energy channel in WIND-3DP experiment have been used to calculate cross-correlation coefficients between ground and space parame-ters. As a measure of the ground ULF activity we use the total horizontal spectral power density (i.e., the sum of spec-tral power densities for two horizontal components) in sub-bands of ∼0.5 mHz width in the frequency band 1–4 mHz. As a measure of the IMF fluctuations the 2-h spectral power of the IMF Bzcomponent variations SBzwas used (the use of
other IMF components provides a similar results and will not be shown). Similarly, the SW plasma fluctuations are charac-terized by the spectral power of the dynamical pressure vari-ations SP. Because the spectral powers and proton flux vary
in a wide range, their logarithms are used for the statistical analysis. Though the propagation time between the Wind lo-cation and the magnetopause is ∼1 h and its influence on the calculation results is weak, we have time-shifted all WIND parameters to account for the SW propagation to the dayside magnetopause.
We are interested in variations at relatively short time scales, about several days. At this timescale, the short-term irregular variations dominate while seasonal and solar-related variations (e.g., the 27-days periodicity responsible for false correlations at longer timescales) are not significant. We calculate correlation coefficients CLfor all the sub-sets
that contain a given number L of points, and , i.e. the aver-aged over the period of observations value of hCLi, is used
as measure of linear correlation between two parameters at a given timesclale. The 2-h interval is taken as a point in the subset which contains L points. We are not interested in fluctuations of parameters inside this elementary interval and operate only with 2-h mean values.
Actually, many of the solar wind parameters are inter-related. This may lead to an ambiguity in selection of a governing parameter and, thus, in identification of a physical mechanism of the geomagnetic pulsation excitation. For ex-ample, there is a well-known anti-correlation of the SW ve-locity and density (Burlaga and Ogilvie, 1970; Neugebauer, 1976). To avoid this bias, following Yagova et al. (2004) we apply the statistical procedure of subsequent identification of inter-dependent parameters, which is similar to the multi-variate linear regression. The primary governing parameter is chosen to be the one with a maximal absolute value of C. Then, the n-th order parameter has the maximal value of C between the (n-1) residuals.
Commonly, it is unclear whether the correlation between two parameters, X and Y, which both depend on parameter Z, is due to this dependence only, or the X-Y relation has also a Z-independent component. To answer this question, the time variations of each parameter are decomposed with the linear regression procedure into two components: proptional to the factor Z and statistically independent on it (or or-thogonal). Then the correlation between these Z-independent (hereafter it is often noted as “pure component”) fractions is calculated. This correlation indicates a level of X-Y relation with the influence of factor Z excluded.
In the statistical approach that we apply (see for details Loeve, 1960) the variation of Pi3 spectral power at a given station SSTN is considered as an independent variable. In
essence, we have to study its expansion over orthogonal ba-sis formed from the variations of dependent parameters. For two variables X, Y centered at their mean values the scalar production XY is introduced and the vectors are orthogonal if XY =0. The correlation coefficient C is the normalized scalar product. A basis can be orthogonalized and a projec-tion of an arbitrary vector, say Y on a given basis (Xi, i=1,
. . . , n) can be found. This projection corresponds to the com-ponent of the variation of the independent variable equal to linear combination of basic variables. If this projection is equal to the vector itself then the behavior of the variable is totally controlled by the governing parameters.
The procedure of expanding of the dependent vector Y over basic vectors (X1, . . . , XN) and the orthogonalization
of basis is as follows. We use the notation P for the orthog-onal basis. The first vector of the new basis P1=Xj , where j is determined from the condition of maximum of |CXj Y|. Then the components of Y and all the other X vectors, or-thogonal to P1, are calculated and one with the maximal C
is chosen as P2. Thus, the vector Pi... Pn are orthogonal
to all vectors P1. . . Pi−1 and Pi is chosen from the
condi-tion of the maximal absolute value of correlacondi-tion with the Y projection on the subspace Xi. . . Xn. If the initial set of
pa-rameters X or at least its projection on Y is degenerate, i.e. includes linearly dependent variables, they will be excluded during the procedure.
8
10
12
log (G)
8
10
12
200
400
600
8
10
12
Days, start 19970101
VOS
GHB
THL
A81
BJN
MAW
Fig. 1. The total horizontal spectral power density (in log scale) for the period 1997–1998 at 3 nearly conjugated stations VOS-THL (polar cap), A81-GHB and MAW-BJN (auroral) from the Southern (red) and Northern Hemispheres (blue). X-scale is day numbers starting from 1 January 1997. Codes for Northern (Southern) sta-tions are given in upper (lower) part of each plot.
4 Results of statistical analysis
4.1 Cross-correlation coefficients between ULF power and interplanetary parameters
The variations of Pi3 spectral power density at three nearly conjugated station pairs VOS-THL, A81-GBH and MAW-BJN are shown in Fig. 1 (from top to bottom). Here the low-est frequency sub-band 1–1.5 mHz has been used. However, because the spectral power decreases with frequency (alike “colored” noise) the results of the subsequent correlation analysis for the power integrated over the whole 1–4 mHz band are almost identical. At cap latitudes (upper panel) the seasonal variations are anti-phase in two hemispheres (with a maximal ULF power in a local summer), while at time scales of several days these variations are in-phase. At auroral
0
50
100
150
200
0
0.2
0.4
0.6
L
C
S−VVOS
ALE
THL
A81
MAW
FCC
KTN
Wi
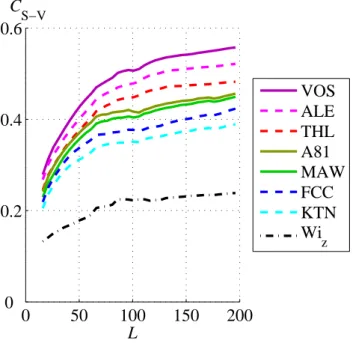
zFig. 2. Averaged over two years (1997–1998) correlation coeffi-cient C between S (1–1.5 mHz band) and V for 7 high latitude sta-tions in dependence on sample length L (in points). Solid (dashed) lines correspond to the Southern (Northern) Hemisphere, respec-tively. Warm colors denote polar cap stations, and cold colors de-note auroral stations. Among the Northern auroral stations only those with the maximal and minimal correlations are shown. Black dashed-dotted line shows the correlation between V and the power of IMF Bzfluctuations SBz.
latitudes (middle and bottom panels) almost no seasonal vari-ations are seen and varivari-ations are in-phase and coherent for all temporal scales. It is clear from Fig. 1 that variations of Pi3 power and, possibly, their correlation with governing pa-rameters, depend on timescale. Therefore, further we will present the average correlation coefficient C in dependence on the subset length L.
We start the analysis of correlation with the SW velocity
V , because it is known to be the main factor which controls
the intensity of almost all types of ULF pulsations at auro-ral and middle latitudes. Averaged correlation coefficients between the Pi3 power and V in respect to the subset length
L for the polar cap and auroral stations in both hemispheres
are given in Fig. 2. These dependences are similar for all sta-tions: at short sample lengths, the correlation grows with L, and then it saturates at a plateau at L about several tens. In further analysis, to minimize the influence of regular cyclic variations we use as a reference value L=30.
The correlation with V for the polar cap stations turns out to be higher (∼0.5) than for the auroral stations (∼0.4). The correlation of V with the power of IMF Bz fluctuations SBz
(black dashed-dotted line) is lower (∼0.25) than those with the Pi3 power on the ground. More effective ULF response
0
50
100
150
200
0
0.2
0.4
0.6
L
C
S−PVOS
ALE
THL
A81
MAW
FCC
KTN
Wi
zFig. 3. The same as Fig. 2, but for the correlation between S and
the SW dynamic pressure P .
on the ground than in space to the SW driving indicates that the mechanism of the K-H instability at the magnetospheric boundary may be involved. Thus, the SW velocity to a great extent controls the ground Pi3 activity, especially in the polar caps.
Then we check whether the SW dynamic pressure P may control the level of the SW/IMF fluctuations and ground ULF pulsations in the Pi3 frequency range. The correlations of P with the pulsation power S for 6 ground stations and Wind are shown in Fig. 3. These correlations demonstrate the be-havior analogous to the previous V −S correlation: saturation at a plateau at about several tens of points. The correlation of P with the Pi3 power at the polar cap stations is again higher (C∼0.3) than that at auroral stations (C∼0.2), though lower than the correlation with V (cf. Fig. 2). Contrary to the correlation with V , the SW pressure correlations with the Pi3 power on the ground and in space are nearly the same (C∼0.3). This fact can be related to the higher level of pres-sure and IMF fluctuations in the high prespres-sure segments of the SW. To discriminate the influence of the SW dynamic pressure P and the spectral power density of pressure fluctu-ations, we examine separately the correlations of P and SP
with the magnetic fluctuation power at the ground (VOS) and at Wind (Fig. 4a). The relevant correlation coefficients show that the magnitude of P and the spectral power density of pressure fluctuations SP correlate well with each other, and
both influence the intensity of magnetic field fluctuations S in a similar way. To reveal the influence on the ULF power of each of parameters free from the influence of the other,
0 0.2 0.4 0.6C 0 50 100 150 200 0 0.1 0.2 0.3 0.4 L S Bz−P S Bz−SP S VOS−P S VOS−SP (S Bz−P) S P (S Bz−SP) P (S VOS−P) S P (S VOS−SP) P (a) (b)
Fig. 4. (a) The same for the correlation between ULF power at VOS
(blue) and WIND (magenta) and solar wind dynamical pressure P (solid) and amplitude of its fluctuation SP(dashed). (b) The same, but for “pure” components (orthogonal to the parameters given in the upper indexes).
the correlations between “pure” components (orthogonal to
SP and P , correspondingly) are calculated as described in
Sect. 3. The correlation coefficients (Fig. 4b) for the “pure” components are less than for original time series, but signif-icant. A positive correlation between SP-independent
com-ponents of the SW dynamical pressure and the power of the magnetic field fluctuations on the ground and in space indi-cates the existence of an additional mechanism for excitation of the IMF fluctuations in a high pressure SW.
Segments of the SW with high particle density and dynam-ical pressure are known to be a source of accelerated parti-cles (Gloeckler, 1984; Richardson and Zwickl, 1984). We examine the correlation between the WIND ion flux J and ULF power on the ground and in space. The dependence of the S−J correlation coefficient on ion energy, C(E), is shown in Fig. 5. S−J correlation at (E<20 keV) is surpris-ingly high, ∼0.4–0.5 both in the polar cap and in the inter-planetary space. At these energies the correlation coefficient
C(E) slowly decreases with E and it drops significantly for E>40 keV.
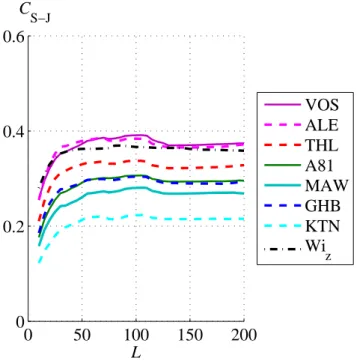
The correlation of the SW proton flux with ground mag-netic variations at different latitudes is examined in Fig. 6, where the correlations C(L) between the Pi3 power on the ground (6 stations) and the Wind flux J (8 keV<E<30 keV) are given. Qualitatively these dependencies are similar to the previous S–P and S–SP correlations (cf. Figs. 3, 4): the
maximal correlation of S with J occurs at cap latitude sta-tions (∼0.4), whereas the correlation at auroral stasta-tions is lower (∼0.3). The behavior of J correlation with the IMF
10
010
110
20
0.2
0.4
0.6
E, keV
S
VOS
− J
S
Bz
− J
C
Fig. 5. Two years averaged correlations between magnetic
fluctu-ations in the polar cap SVOS(solid) and in the interplanetary space at WIND SBz(dashed) and interplanetary proton fluxes in respect to energy at L=30.
0
50
100
150
200
0
0.2
0.4
0.6
L
C
S−JVOS
ALE
THL
A81
MAW
GHB
KTN
Wi
zFig. 6. Two years averaged correlation coefficient between S and
WIND ion (8–30 keV) flux J for 6 high latitude stations in depen-dence on sample length L. Black dash-dot line shows the correla-tion with SBz.
fluctuations (dashed-dotted line) is similar to that with P and
SP.
The above analysis has shown that besides SW veloc-ity, the primary driver of high-latitude Pi3 pulsations, there is a group of geoeffective interplanetary parameters weakly
0
0.25
0.5
0.75
1
C
0
0.1
0.2
0.3
0
50
100
150
200
0
0.1
0.2
0.3
L
J−S
PS
P−P
J−P(S
VOS−P)
S P, J(S
VOS−J)
S P, P(S
VOS−S
P)
J, P(S
Wiz−J)
S P, P(S
Wiz−S
P)
J, P(S
Wiz−P)
S P, JFig. 7. Upper panel: the correlations between J and SP(solid), J and P (dash-dot), and P and SP(dashed). Other two panels show the correlations of SVOS(middle) and SBz(bottom) with J (solid),
SP(dash-dot), and P (dash) pure components (orthogonal to the pa-rameters given in the upper indexes). SPand P for the correlations with SVOS(middle panel) are recalculated to the dayside magne-topause.
related to V : the SW dynamic pressure, the amplitude of pressure fluctuations, and the flux of protons with keV en-ergies. These parameters are inter-related and influence the ULF power on the ground and in space similarly, but in a different way than V . Correlations between these three pa-rameters and their influence on the Pi3 wave power on the ground and in space are shown in Fig. 7. The highest corre-lation (∼ 0.8) is found between P and J and the correcorre-lation between two other pairs are very close (∼0.6).
To exclude a dependent parameter influencing ULF power only as a superposition of two others, correlations of “pure” components (i.e. each of three independent on two others) with ULF power on the ground and in space have been calcu-lated (two bottom panels in Fig. 7). The correlation vanishes for S−P pair, which means that the SW dynamic pressure influences ULF power not directly, but only through the pres-sure fluctuations and proton fluxes. At the same time, the cor-relation of the pure S and J (that is, V and SP-independent)
components is non-zero and positive (∼0.2), indicating that
the SW proton flux is an additional independent factor which contributes to the excitation of magnetic fluctuations on the ground.
The proton flux and pressure both vary almost syn-chronously indicating a quick thermalization of 8–30 keV protons. Thus, only those protons accelerated at small dis-tances from the observational monitor contribute to the ULF power in space and on the ground. An important feature of protons with E<30 keV is their weak correlation with higher energy protons generated during the solar proton events (SPE) (not shown). SPE-related peaks can be seen in 8– 30 keV channel, but these events are relatively rare and give a low contribution to the total statistics of J . The intervals with low J (8–30 KeV) – P correlation are mainly SPE in-tervals with the increased proton flux in all energy channels. However, even for these intervals the correlation coefficients between J (8–30 KeV) and ULF power are nearly the same as for the total interval. This gives an additional argument in favor of the above conclusion that the magnitude of the SW dynamic pressure acts on the Pi3 pulsation power only as the superposition of two factors: pressure variations and ion flux. For the majority of subsets the correlation coefficients of the ULF power on the ground and in space with the proton flux and SW pressure fluctuations are approximately equal and both vary in a similar way with time. However, for
∼25% of samples the correlation of J with the ground ULF power is even higher than its correlation with the ULF power measured on WIND. The two year mean value of the corre-lation between the pure components of SVOS and J (that is
independent on V , SPand SBZ) is ∼0.13.
The above analysis of possible interplanetary factors, which influence the amplitude of ULF fluctuations at high latitudes, may be summarized as follows: the most impor-tant factor is the SW velocity. A higher correlation of V with ULF power at the Earth’s surface than in the interplanetary space indicates the occurrence of a magnetospheric genera-tion mechanism (probably, KH instability). Then we have a group of coupled parameters weakly dependent on V and related to the SW dynamical pressure P . For them the cor-relations with the ULF power in the polar caps and at Wind are very close. The multi-regression analysis shows that the influence of P on ULF magnetic fluctuations is, in fact, a superposition of two factors: the spectral power density of the pressure fluctuations SP and suprathermal ion flux J . A
weak positive correlation exists between J and ground ULF power independent on V , SP and SBzthroughout the whole
high latitude region, but it is higher in the polar caps. 4.2 Cross-covariation of ULF power with the
interplane-tary parameters
In this section, the cross-covariate functions for all the pa-rameters analyzed in the previous paragraph are calculated in order to take into account a possible delay in variations of related parameters. It may help to identify the cause/reason,
−48 −24
0
24
48
−0.2
0
0.2
0.4
0.6
τ
, hours
C
VOS
A81
MAW
THL
ALE
KTN
FCC
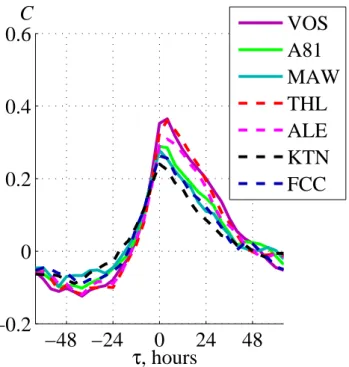
Fig. 8. Two year averaged S−V covariate functions C(τ ) for
var-ious stations. Only maximal and minimal covariate functions from auroral stations in the Northern Hemisphere are shown. Positive lag corresponds to S leading.
and physical mechanisms for correlations discovered. The cross-covariate function between averaged values of Pi3 spectral power densities at the cap and auroral stations in both hemispheres and the SW velocity is given in Fig. 8. For all the stations the behavior of their cross-covariate functions is similar, though the peak values are higher (∼0.35) for the polar cap stations. The covariate function reaches a maxi-mum at zero time offset indicating the occurrence of instan-taneous relation between parameters. At the same time, this function demonstrates an unexpected puzzling asymmetry, as if Pi3 power depends on future values of the SW velocity, or as if Pi3 power enhancements precede somewhat increases of V . This can be due to the dependence of the ULF power at the Earth’s surface on space parameters whose variations precede those of the SW velocity.
The covariate functions of the ULF fluctuations in the po-lar cap with J , SP, P , and SBzare shown in Fig. 9. They also
have a weak asymmetry, but opposite to that of the S − V relationship. Generally, an asymmetric covariate curve with the maximum at zero offset prompts that the delay time be-tween parameters under examination may vary in a wide range from zero to some maximal value. The above features of the covariate functions shows that the delay times between the P -related SW parameters and ULF power at the ground
S, as well as between V and S, may vary from 0 to several
ten hours.
−48 −24
0
24
48
−0.25
0
0.25
0.5
τ
, hours
C
S
VOS−S
BzS
VOS−S
PS
VOS−J
S
VOS−P
Fig. 9. The same as Fig. 8, but for the covariate functions SVOS−J (8−30 keV), SP, P , and SBz. Jumps in SVOS−SPcovariate function are due to gaps in SPtime series.
4.3 Examples of Pi3 driving by solar wind proton fluxes In the above two sections, we have shown statistically that the Pi3 power depends on the SW velocity, SW dynamic pressure fluctuations, and flux of supra-thermal solar protons, whereas the latter two parameters correlate closely with the SW dynamic pressure. Here we present two events for a dis-turbed interval and a relatively quiet one when the influence of the proton flux on ground ULF activity is seen evidently with a lower nterference of other factors. These events are not unique, because throughout the entire period of observa-tions, during ∼25% of intervals the correlation of ground Pi3 power with J is higher than with SPand V .
During the first event from 3 August 1998 to 8 August 1998 (days 215–220), shown in Fig. 10, two rises of the SW dynamic pressure (third panel) occur at days 215 and 218. The second increase of P up to ∼10 nPa, caused by arrival of a corotating interacting region (CIR), marks the onset of moderate magnetic storm with peak Dst=−138 nT. It is
in-teresting that the response of the ULF power in the polar cap (VOS) (upper panel) to this pressure jump is more evident that the variation of ULF power at WIND (second panel). The ULF power in the polar cap enhances nearly simultane-ously with the solar proton flux (upper panel), and slightly earlier before the pressure jumps. At the same time, the cor-respondence between SVOSand V (lower panel) for this
6
9
12
0
6
214
215
216
217
218
219
220
250
400
550
t, days
0
5
10
V
P
log(S
Bz)
log(S
P)
log(S
VOS)
log(J)
Fig. 10. Examples of variations of SVOS (black, upper) and J (red,upper), SP (green, second) and SBz (magenta, second), P (third), and V (lower) for the interval 3 August 1998–8 August 1998.
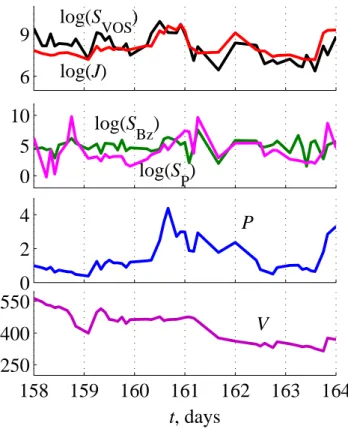
An example of a relatively quiet interval is shown in Fig. 11 During six days from 8 June 1998 to 13 June 1998 (days 159–164) moderate variations of all parameters occur. Again, a ULF activity in the polar cap, as characterized by
SVOS, is highly correlated (C∼0.7) with J , much higher than
with V . Thus, at least for some intervals the correlation be-tween SVOS and V is lower than its correlation with SP and J , that is, the influence of V -independent parameters on the
Pi3 power dominates. 4.4 Stability of correlations
To understand how the correlations found are revealed dur-ing disturbed and quiet space weather conditions, we have analyzed the cross correlations between all the SW parame-ters separately for the intervals including CME, shocks, and CIRs (∼1/3 of all intervals) and those with no space weather events (hereafter “quiet intervals”). The correlation coeffi-cients turned out to be very close for these two sub-sets, so the plots in Figs. 2–7 are nearly the same for these sub-arrays. Thus, we may conclude that the acceleration of protons in high pressure SW occurs not only in well-formed shocks or CIRs, but also in the SW with very moderate pressure in-crease. The features of the covariate functions of the SW
6
9
0
5
10
158
159
160
161
162
163
164
250
400
550
t, days
0
2
4
V
P
log(S
Bz)
log(S
P)
log(S
VOS)
log(J)
Fig. 11. Examples of variations of SVOS (black, upper) and
J (red,upper), SP (green, second) and SBz (magenta, second), P (third), and V (lower) for the interval 8 June 1998–13 June 1998.
dynamic pressure and supra-thermal proton flux in respect to amplitude of the magnetic field fluctuations in the interplan-etary space and on the ground are similar for a disturbed and quiet SW. Thus, we may conclude that the relation between SW supra-thermal protons (E<30 keV) and the amplitude of the ULF fluctuations in the interplanetary space and on the ground exists permanently, both for the disturbed and quiet intervals.
The other concern is the possible false correlations orig-inating from cyclic variations (e.g., solar-related, seasonal, and diurnal). The most direct and effective method to sup-press the influence of these variations might be the high-pass filtration of the time series of 2-h parameters at a frequency about 1–2 day−1. The problem in our particular case of numerous parameters, measured simultaneously by different sensors in the interplanetary space and on the ground, is the existence of data gaps. Actually, there are not enough sub-sets with complete data coverage. That is why we use cross-correlation in time domain. To verify the robustness of the averaged correlations we use the following procedure. The whole two-year interval is divided into two one-year inter-vals, and the average correlation coefficients for all the sub-sets are calculated for both one-year intervals and between years for all the parameter pairs. The time-shift in cross-year
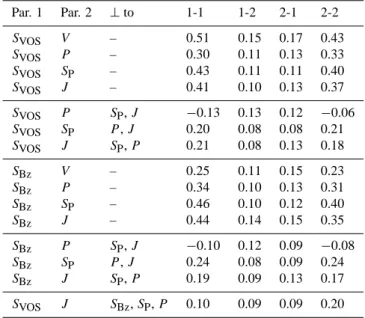
correlations is varied from 0 to 27 days to estimate the maxi-mal correlation of solar-cycle origin. The same procedure is used for “pure” components as well. The summary of corre-lations is given in Table 2. The columns 1-1 and 2-2 show the correlations for years 1997 and 1998, respectively. The columns 1-2 and 2-1 show the maximal cross year correla-tions with index 1(2) corresponding to the year 1997(1998). E.g. in the first line of Table 2 column 1-2 demonstrates the correlation between SVOS (1997) and V (1998). All the
cross-year correlations demonstrate cyclic behavior with the 27-day period and we give their maximal absolute values, i.e. the amplitude of these variations, in columns 1-2 and 2-1 of Table 2. For the all the correlations, with the exception of “pure” S−P (orthogonal to SPand J ) correlation, zero-shift
one-year correlation is at least 1.5–2 times higher than the maximal values of the cross-year correlations. For the corre-lations SVOS−P and SBz−P (components orthogonal to SP
and J ) the absolute values of zero-shift one-year and maxi-mal cross-year correlations are approximately equal.
One more result, which is influenced sufficiently by cyclic variations, is the existence of the relation between ULF power on the ground and ion flux independent on V , SP and SBz(last line in the table). Although the two-year averaged
correlation for SVOS−J “pure” correlation is higher than
both cross-year maximal correlations, only one-year corre-lation for 1998 is 2 times higher than the maximal cross-year correlation, while the correlation for 1997 is nearly equal to it. Thus this result is doubtful and requires more precise anal-ysis.
5 Discussion and conclusion
This study has shown that the high latitude Pi3 (1–4 mHz) ac-tivity is controlled by several interplanetary parameters. The relationships between the fluctuations in this frequency band and basic interplanetary parameters: the SW velocity, SW dynamic pressure, and IMF fluctuations, are similar, but not the same as the known relationships for common Pc5 pulsa-tions. The ULF response in this frequency range turns out to be more noticeable at the polar cap latitudes than at auroral latitudes. This distinction may be caused by several reasons:
– lower background ULF activity in the polar cap region;
– occurrence of additional magnetospheric mechanisms
of ULF generation in the cusp/auroral regions, masking the IMF/SW control;
– easier KH instability excitation and ULF wave
penetra-tion on the flanks of the magnetotail lobes. The pri-mary drivers of high-latitude magnetic Pi3 fluctuations, especially in the polar caps, are turned out to be the SW velocity V and the group of parameters almost in-dependent on V , but correlated with the SW dynamic
Table 2. Average correlation coefficients for different parameter
pairs inside one-year intervals (columns 1-1 and 2-2) and between years (columns 1-2 and 2-1).
Par. 1 Par. 2 ⊥to 1-1 1-2 2-1 2-2 SVOS V – 0.51 0.15 0.17 0.43 SVOS P – 0.30 0.11 0.13 0.33 SVOS SP – 0.43 0.11 0.11 0.40 SVOS J – 0.41 0.10 0.13 0.37 SVOS P SP, J −0.13 0.13 0.12 −0.06 SVOS SP P , J 0.20 0.08 0.08 0.21 SVOS J SP, P 0.21 0.08 0.13 0.18 SBz V – 0.25 0.11 0.15 0.23 SBz P – 0.34 0.10 0.13 0.31 SBz SP – 0.46 0.10 0.12 0.40 SBz J – 0.44 0.14 0.15 0.35 SBz P SP, J −0.10 0.12 0.09 −0.08 SBz SP P , J 0.24 0.08 0.09 0.24 SBz J SP, P 0.19 0.09 0.13 0.17 SVOS J SBz, SP, P 0.10 0.09 0.09 0.20
pressure P . This group of parameters causes a simi-lar Pi3 response both on the ground and in interplane-tary space. The influence on the Pi3 amplitude of the SW dynamic pressure P is, in fact, a superposition of two factors: the spectral power density of the SW dy-namic pressure fluctuations and supra-thermal ion (with energy E<30 KeV) flux.
As all the three parameters, i.e. P , SP and J , correlate with
each other and their correlation coefficients with Pi3 power are close to each other, we use the following additional test to choose between these parameters those actually which con-trol the Pi3 spectral power. The flux of SW protons with J (E<30 keV) and ULF spectral power S both on the ground and in space have almost no correlation with higher energy (E>1 MeV) solar protons generated during SPE. As it was mentioned above, J increases with the SW dynamical pres-sure. However, there are time intervals when the J –P cor-relation is low. These intervals are characterized by a steep increase in proton flux in all energy channels and, thus, they correspond to SPE. The S−J correlation for these intervals is approximately the same as for quiet intervals, while S−P correlation for SPE intervals vanishes. Thus, the flux of suprathermal protons is directly related to Pi3 power, while its correlation with P is an artifact.
The inter-relations between all the parameters studied are summarized in Fig. 12, where the average correlation coeffi-cients are shown by different types of lines. The correlations between all the parameters (except P −V pair) are statisti-cally significant. To make the picture readable, we take only
J
S
VOS
S
P
S
Bz
P
V
>0.6
0.45 − 0.6
0.3 − 0.45
0.15 − 0.3
Fig. 12. Summary sketch of averaged correlations between all the
parameters studied. The power spectral density at VOS and in the SW are taken in the low-frequency band (1–1.5 mHz).
one ground station (VOS). The picture for other polar sta-tions (ALE and THL) is very similar to the one depicted in Fig. 12. The correlations between ULF spectral power in the polar caps and in space are close to each other, except the correlation with V , which is lower in the interplanetary space. For V and SP-independent components a significant
correlation remains between Pi3 power, both on the ground and in the SW, and the proton flux. The correlation coef-ficients SVOS−J and SBz−J are approximately equal, i.e.
suprathermal protons influence the power of fluctuations on the ground and in space in a similar way. However, the cor-relation between the proton flux and Pi3 power components independent also on the power of SBz is about 0.13. This
may indicate the possibility of generation of ULF noise by suprathermal protons not only in the foreshock, but also in-side the bow shock. Special studies are necessary to study the reliability of this relation and establish mechanisms for it.
An important result of our analysis is the puzzling asym-metry in S−V covariations corresponding to preceding of the Pi3 power variations to the variations of the SW velocity. Most probably, this asymmetry is associated with the typi-cal structure of CIRs in which high speed SW streams are preceded by the plasma compression. Compressed SW seg-ments are characterized by the enhanced pressure and IMF fluctuations, generating ULF response in the magnetosphere. The examples of events with high peak-to-peak correspon-dence between the 1 mHz SW dynamic pressure fluctuations and variations of the Earth’s magnetic field were presented by Kepko et al. (2003) proving the possibility for the magne-tosphere to be a forced low quality oscillator.
CIRs are also the sources of accelerated ions. Accelera-tion of SW protons to energies E>40 keV takes place in
in-terplanetary shocks while CIRs are known to be a source of suprathermal protons of lower energies even if a shock is not formed (Gloeckler, 1984; Richardson and Zwickl, 1984). A CIR necessarily includes a high pressure segment in the zone where a high speed SW meets a slow flow. As was found by Chotoo et al. (2000), maximal flux position of lower energy (less than several 100 keV) ions is shifted anti-sunward as compared with the Mev ions and corresponds to the zone of dense decelerated SW. The 10–30 keV protons are, probably, stochastically accelerated by the SW fluctuations, therefore, the proton flux correlates with the SW density (Trattner et al., 1991). The evolution SW supra-thermal protons and its relation to the ULF fluctuations in the interplanetary space have not been sufficiently explored. Possibly, an enhanced ULF power can be generated by the differential streaming of keV-ions at super-Alfvenic velocities through the SW. A possibility of the MHD wave generation under differential streaming was discussed by Leubner (2004) and Dubinin et al. (2005).
The main mechanism of the Earth’s magnetosphere influ-ence on the proton flux upstream of the Earth’s bow shock is the acceleration at the bow shock (McKenna-Lawlor et al., 2003). Additionally, a close relation between particle flux fluctuations (electrons in the magnetosheath) and Pc5 oscillations was observed by Sarafopolous et al. (2001), who proposed a leakage of particles from the magnetosphere as a physical mechanism. These two mechanisms may be respon-sible for proton events measured at interplanetary monitor magnetically conjugate with the magnetosphere. However, these mechanisms cannot interpret our results, because inter-vals with possible Wind-magnetosphere conjugacy are very rare. More than 90% of 2 h intervals from our dataset corre-spond to the WIND location at X>30 RE, and among them
there are only very few conjugated intervals with low IMF cone angle θ , such that tan(θ )<h/x, where h is the mag-netosheath typical lateral scale and x is the GSE Sun-Earth coordinate of WIND. Taking h=30 RE, we get only ∼160
from ∼4000 subsets and these intervals give almost no con-tribution to the J −S correlation. Thus, the asymmetry of the S−V covariation cannot be explained by the foreshock extension to the Wind location. Thus, the finding of the sig-nificant role of supra-thermal ion fluxes in the stimulation of the Pi3 activity at polar latitudes is a challenge to the ULF community. The identification of relevant mechanisms may require a comparison of the differential fluxes in SW, mag-netosheath, and magnetotail.
Acknowledgements. We are grateful to data supporting institutions
and personnel: WDC-1 participating institutions for the data of VOS, MAW, ALE, FCC, YKC and BJN stations; BAS for the data of A81 station; NASA CDAWEB for the data of WIND magnetic and plasma experiments. This study is supported by INTAS grant 03-51-5359 (NVY, VAP, JW).
Topical Editor I. A. Daglis thanks J. De Keyser and another ref-eree for their help in evaluating this paper.
References
Allan, W. and Wright, A. N.: Magnetotail waveguide: Fast and Alfven waves in the plasma sheet boundary layer and lobe, J. Geophys. Res., 105, 317–328, 2000.
Blanco-Cano X. and Schwartz, S. J.: Identification of low-frequency kinetic wave-modes in the Earth’s ion foreshock, Ann. Geophys., 15, 273–288, 1997,
http://www.ann-geophys.net/15/273/1997/.
Burlaga, L. F. and Ogilvie, K. W.: Heating of the solar wind, Astro-phys. J., 159, 659–670, 1970.
Chotoo, K., Scwadron, N. A., Mason, G. M., Zurbuchen, T. H., Gloecker, G., Posner, A., Fisk, L. A., Galvin, A. B., Gamilton, D. C., and Collier, M. R.: The suprathermal seed population for corotation interaction region ions at 1 AU deduced from compo-sition and spectra of H+, He++ and He+ observed on WIND, J. Geophys. Res., 105, 23 107–23 122, 2000.
Dubinin, E., Sauer, K., and McKenzie, J. F.: Differential ion stream-ing in the solar wind as an equilibrium state, J. Geophys. Res., 110, A07101, doi:10.1029/2004JA010826, 2005.
Engebretson, M. J., Glassmeier, K.-H., Stellmacher, M., and Hughes, W. J.: The dependence of high-latitude Pc5 wave power on solar wind velocity and on the phase of high-speed solar wind streams, J. Geophys. Res., 103, 26 271–26 283, 1998.
Hoppe, M. M., Russel, C. T., Frank, L. A., Eastman, T. E., and Greenstadt, E. W.: Upstream geomagnetic waves and their asso-ciation with backstreaming ion populatios: ISEE 1 and 2 obser-vations, J. Geophys. Res., 86, 4471–4492, 1981.
Gloeckler, G.: Characteristics of solar and heliospheric ion popula-tions observed near Earth, Adv. Space Res., 4, 127–137, 1984. Kepko, L., Spence, H. E., and Singer, H. J.: ULF waves in the solar
wind as direct drivers of magnetospheric pulsations, Geophys. Res. Lett., 29, 1197, doi:10.1029/2001GL014405, 2002. Kepko, L. and Spence, H. E.: Observations of discrete,
global magnetospheric oscillations directly driven by so-lar wind density variations, J. Geophys. Res., 108, 1257, doi:10.1029/2002JA009676, 2003.
Kim, K.-H., Cattell, C. A., Lee, D.-H., Takahashi, K., Yumoto, K., Shiokawa, K., Mozer, F. S., and Andre, M.: Magnetospheric re-sponses to sudden and quasiperiodical solar wind variations, J. Geophys. Res., 107, 1406, doi:10.1029/2002JA009342, 2002. Leubner, M. P.: Core-halo distribution functions: A natural
equilib-rium state in generalized thermostatistics, Astrophys. J., 604(1), 469–478, 2004.
Loeve, M.: Probability theory, D. Van Nostrand Company Inc., Princeton, New Jersey, Toronto, New York, London, 1960.
Neugebauer, M.: The quiet solar wind, J. Geophys. Res., 81, 4664– 4670, 1976.
McKenna-Lawlor S., Kudela, K., Kesckemety, K., and Chang, S. W.: Spacecraft measurements of ions and electrons near and far upstream of the Earth’s bow shock, Adv. Space Res., 31, 933– 938, 2003.
Pilipenko, V., Mazur, N., Fedorov, E., Engebretson, M. J., and Murr, D. L.: Alfven wave reflection in a curvilinear magnetic field and formation of Alfvenic resonators on open field lines, J. Geophys. Res., 110, A10S05, doi.:10.1029/2004JA010755, 2005. Pilipenko, V. A., Fedorov, E. N., Engebretson, M. J., Papitashvili,
V. O., and Watermann, J.: Poleward progressing quasi-periodic disturbances at cusp latitudes: The role of wave processes, J. Geophys. Res., 105, 27 569–27 588, 2000.
Prikryl, P., MacDougall, J. W. , Grant, I. F. , Steele, D. P., Sofko, G. J., and Greenwald, R. A.: Observations of polar patches gener-ated by solar wind Alfven wave coupling to the dayside magne-topause, Ann. Geophys., 17, 463–489, 1999,
http://www.ann-geophys.net/17/463/1999/.
Richardson L. G. and Zwickl, R. D.: Low energy ions in corotation interaction regions at 1 AU: observations, Planet. Space Sci., 32, 1179–1193, 1984.
Sarafopoulos, D. V., Takahashi, K., and Mcentire, R. W.: Peri-odic variations of magnetosheath energetic electron flux associ-ated with global Pc5 pulsations, J. Geophys. Res., 106, 13 037– 13 051, 2001.
Trattner, K. J., Mobius, E., Klecker, B., and Scholer, M.: Variation in the energy spectra of energetic ions at the earth’s bow shock, Adv. Space Res., 11, 261–264, 1991.
Vennerstrom, S.: Dayside magnetic ULF power at high latitudes: a possible long-term proxy for the solar wind velocity?, J. Geo-phys. Res., 104, NA5, 10 145–10 157, 1999.
Yagova, N., Lanzerotti, L., Villante, U., Pilipenko, V., Lepidi, S., Francia, P., Papitashvili, V., and Rodger, A.: Magnetic activity in the ULF Pc5-6 band at very high latitudes in Antarctica, J. Geophys. Res., 107, 1195, doi:10.1029/2001JA900143, 2002. Yagova, N. V., Pilipenko, V. A., Lanzerotti, L. J.,
Engebret-son, M. J., Rodger, A. S., Lepidi, S., and Papitashvili, V. O.: Two-dimensional structure of long-period pulsations at po-lar latitudes in Antarctica, J. Geophys. Res., 109, A03222, doi:10.1029/2003JA010166, 2004.
Yedidia, B. A., Vellante, M., Villante, U., and Lazarus, A. J.: A study of the relationship between micropulsations and solar wind properties, J. Geophys. Res., 96(A3), 3465–3470, 1991.