Does Formal System Dynamics Training Improve
People's Understanding of Accumulation?
The MIT Faculty has made this article openly available. Please share
how this access benefits you. Your story matters.
Citation Sterman, John D. “Does Formal System Dynamics Training Improve People’s Understanding of Accumulation?” System Dynamics
Review 26.4 (2010): 316–334. CrossRef. Web. As Published http://dx.doi.org/10.1002/sdr.447
Publisher John Wiley & Sons, Inc.
Version Author's final manuscript
Citable link http://hdl.handle.net/1721.1/77979
Terms of Use Creative Commons Attribution-Noncommercial-Share Alike 3.0 Detailed Terms http://creativecommons.org/licenses/by-nc-sa/3.0/
Does formal system dynamics training improve people’s understanding of accumulation?
Short Title: Does system dynamics training improve understanding of accumulation?
John D. Sterman
MIT Sloan School of Management [email protected]
Abstract
Prior work shows widespread misunderstanding of stocks and flows, even among highly
educated adults. People fail to grasp that any stock rises (falls) when the inflow exceeds (is less than) the outflow. Rather, people often use the correlation heuristic, concluding that a system’s output is positively correlated with its inputs. Here I report an experiment with MIT graduate students at to assess the impact of an introductory system dynamics course on intuitive understanding of accumulation. I use a pretest-treatment-posttest design; the treatment is the course content. Results show improvement in performance and a reduction in the prevalence of the correlation heuristic. Modest exposure to stocks and flows improves intuitive understanding of accumulation, at least among these highly educated adults. However, there is still evidence of correlational reasoning among a minority of students. I suggest additional experiments to deepen our knowledge of the training required to develop people’s understanding of accumulation.
KEYWORDS: accumulation, stocks and flows, correlation heuristic, systems thinking, misperceptions of feedback
Research shows that many people do not understand the distinction between stocks and flows and are unable to infer correctly the behavior of a stock from the behavior of its inflows and outflows (graphical or intuitive integration), or infer the behavior of the net flow from the trajectory of the stock (graphical or intuitive differentiation). Stock-flow problems, even simple ones, are unintuitive and difficult, even for highly educated people with substantial training in Science, Technology, Engineering, and Mathematics (STEM) (Booth Sweeney & Sterman, 2000; Cronin, Gonzalez and Sterman, 2009; Cronin & Gonzalez, 2007; Sterman 2002; Sterman & Booth Sweeney, 2002). For example, Booth Sweeney and Sterman (2000) presented graduate students at the MIT Sloan School of Management with a picture of a bathtub and graphs showing the inflow and outflow of water, then asked them to sketch the trajectory of the stock of water in the tub. Although the patterns were simple, fewer than half responded correctly. Performance remains poor in even simpler tasks (Cronin, Gonzalez and Sterman 2009). Such stock-flow failures have important public policy implications, including widespread failure to understand the fundamental relationships between greenhouse gas emissions, atmospheric GHG
concentrations, and climate change (Sterman 2008, Sterman and Booth Sweeney 2007). The prior work clearly establishes widespread misunderstanding of the fundamental principles of accumulation. People fail to grasp that the quantity of any stock, such as the level of water in a tub, rises (falls) when the inflow exceeds (is less than) the outflow. Instead, people often use intuitively appealing heuristics such as assuming that the output of a system is
positively correlated with its inputs. That is, people assume that the output (the stock) should “look like” the input (the flow or net flow). Cronin, Gonzalez and Sterman (2009) denote such behavior the correlation heuristic and show that such correlational reasoning is common in a wide range of stock-flow tasks. They further show that these stock-flow errors are robust to a wide range of information displays, cover stories and contexts, motivation, and other conditions.
The obvious question is what can be done to improve people’s intuitive understanding of stocks and flows. In particular, are formal courses in system dynamics effective in overcoming people’s poor understanding of stocks and flows? Here I report an experiment with graduate
students at the MIT Sloan School of Management to assess whether a half-term introductory course in system dynamics improves their intuitive understanding of accumulation. The study uses a pretest–treatment–post-test design. On the first day of the semester, students were given the classic “department store” task (Sterman 2002, Cronin, Gonzalez and Sterman 2009) to establish a baseline. As in prior studies, overall performance was poor, with fewer than 38% responding correctly. The treatment consisted of the standard course material on stocks and flows, including several class sessions, assigned reading on stocks and flows from Sterman (2000), and an assignment. The post-test consisted of the graphical department store task described in Cronin, Gonzalez and Sterman (2009).
Results show improvement in overall performance, and a reduction in the prevalence of the use of the correlation heuristic. Even relatively modest exposure to the concepts of stocks and flows and the principles of accumulation improves the intuitive understanding of these concepts, at least among these highly educated adults. This result should be reassuring to those who teach system dynamics—if there were little improvement, it would call into question the value of current system dynamics syllabi and pedagogical approaches (at least, the one used at MIT).
However, several questions remain. While performance improved, there is still evidence of correlational reasoning among a number of students. Further, the robustness of the
improvement is not known. Will these students be able to apply the principles of accumulation in naturalistic contexts they will encounter outside the system dynamics classroom, where there are few or no cues indicating that stock-flow structure and the principles of accumulation are applicable? How durable will student skills be as time passes? I discuss these issues and suggest additional experiments to deepen our knowledge of the education and experiences that can develop people’s intuitive understanding of accumulation.
Misperceptions of Feedback and Stock-Flow Failure
Research in dynamic decision making shows that high levels of dynamic complexity lead to systematically biased and suboptimal performance. Dynamically complex systems contain multiple feedback processes, including both positive and negative feedbacks, time delays, nonlinearities, and accumulations (Sterman, 2002). Research further shows that learning in dynamic systems is often slow and weak, even with repeated trials, unlimited time, and
performance incentives (Diehl & Sterman, 1995; Kleinmuntz & Schkade, 1993; Moxnes, 2004, Sterman, 1989a, 1989b). Poor performance in such experimental systems is often attributed to the gap between the complexity of the system and the bounded rationality of human
decisionmaking, specifically, limits on cognitive resources resulting in information overload and computational constraints (Brehmer, 1990, 1995; Gonzalez, 2005; Kleinmuntz, 1985, 1993; Omodei & Wearing, 1995).
Recent work, however, shows that people make persistent mistakes even in the simplest dynamic systems with no feedback processes, time delays, or nonlinearities, including systems consisting of a single stock with one inflow and one outflow, (e.g., Booth Sweeney & Sterman, 2000; Cronin & Gonzalez, 2007; Sterman & Booth Sweeney, 2007, Cronin, Gonzalez and Sterman 2009). For example, Sterman (2002) describes the “department store” task, which presents participants with a graph showing the number of people entering and leaving a department store each minute over a 30-minute interval (Figure 1). The system consists of a single stock (the number of people in the store) with one inflow (people entering) and one outflow (people leaving). There are no feedbacks, time delays, nonlinearities, or other elements of dynamic complexity. Participants are asked four questions. The first two—“When did the most people enter the store? When did the most people leave the store?”—test whether
participants can read the graph and correctly distinguish between inflow and outflow. The next questions—“When were the most people in the store? When were the fewest people in the store?”—test whether participants can infer the behavior of the stock from the behavior of the flows.
Figure 1. “Classic” Department Store Task (Sterman, 2002; Cronin, Gonzalez, and Sterman,
2009).
The graph below shows the number of people entering and leaving a department store over a 30-minute period.
Please answer the following questions.
Check the box if the answer cannot be determined from the information provided. 1. During which minute did the most people enter the store?
Minute ________ Can’t be determined
2. During which minute did the most people leave the store?
Minute ________ Can’t be determined
3. During which minute were the most people in the store?
Minute ________ Can’t be determined
4. During which minute were the fewest people in the store?
Minute ________ Can’t be determined
0 5 10 15 20 25 30 35 40 0 2 4 6 8 10 12 14 16 18 20 22 24 26 28 30 People/Minute Minute Entering Leaving
To answer participants could keep a running tally of the number of people in the store minute by minute, St = St–1 + It – Ot. This brute-force method, however, is tedious, error prone, and unnecessary. Rather, if participants understand the principles of accumulation they can answer without any calculation. Like any stock, the number of people in the store rises (falls) when the inflow—the number of people entering each minute—exceeds (is less than) the outflow—number of people leaving each minute. The number entering exceeds the number exiting through t = 13 and is less thereafter. Therefore, the most people are in the store when the two curves cross (t = 13). Furthermore, because the number of people in the store rises through t = 13 and falls thereafter, the fewest people are in the store either at the beginning or the end of the 30 minutes. To determine which, participants must judge whether the cumulative increase in the store population through t = 13 is greater or less than the cumulative decrease from t = 13 to 30. Calculation is again unnecessary: participants need only judge whether the area between the rate of entering and the rate of leaving up to t = 13 is greater or smaller than the area between the two curves from t = 13 on. The area between the curves for t ≥ 13 on is clearly larger, so the fewest people are in the store at the end of the 30 minutes. As described in Sterman 2002 and Cronin et al. 2009, the task was carefully designed so that area of the region in which outflow exceeds inflow (t ≥ 13) is twice as large as the area in which inflow exceeds outflow (t ≤13). To test whether people can determine which area is larger, a convenience sample consisting of 12 members of the support staff from the MIT Sloan School of Management were asked which area was greater; all correctly identified the larger area.
Despite the extreme simplicity of the department store task, Cronin, Gonzalez and Sterman (2009) show that performance by a sample of graduate students enrolled in the introductory system dynamics class at the MIT Sloan School of Management was poor. Participants (N = 173) were primarily MBA students and graduate students from other MIT departments or from Harvard University. The mean age was 29 and 78% were male. All had taken calculus, and most had strong training in science, technology, engineering, or mathematics (STEM): 71% had a degree in STEM; 28% had a degree in the social sciences, primarily
economics. Fully 40% had a prior graduate degree, most in technical fields. Students did the task in class at the beginning of the semester, prior to any exposure to system dynamics concepts, including stocks and flows. As expected for this highly educated population, the vast majority of participants correctly identified when the most people entered and left the store (96% and 95% for Questions 1 and 2, respectively). However, few were able to answer the stock-flow questions correctly (44% and 31% for Questions 3 and 4, respectively). Approximately 17% indicated that it is not possible to determine when the most people were in the store, and 25% said that it is not possible to determine when the fewest people were in the store. More importantly, 29%
incorrectly indicated that the most are in the store when the net inflow is greatest (t = 8) and 30% incorrectly conclude that the fewest are in the store when the net outflow is greatest (t = 17). These responses, accounting for far more of the erroneous choices than any other, reveal a fundamental confusion about the relationship between stocks and flows. Cronin, Gonzalez and Sterman (2009), using subjects drawn from MIT, Carnegie-Mellon University and George Mason University, show that the poor performance persists when the task is simplified (fewer data points), when the data display is varied (from line graph to bar graph, spreadsheet, or text), when more time is allowed, and when subjects are provided modest incentives and opportunities for learning from outcome feedback.
Method
The study uses a pretest-treatment-post-test design (Figure 2). Participants were students enrolled in the introductory system dynamics class at the MIT Sloan School of Management in the fall term 2008. The course is divided into two half-semester courses. Both halves are electives, and students may opt to take only the first half or both halves. The experiment was carried out within the first half-term course, which consists of eleven 80-minute sessions, meeting twice per week. In the fall term 2008 there were two sections of the course, taught in back-to-back time slots. To establish a baseline, students were given the classic department store task (Figure 1) on the first day of the semester as a pretest. The treatment consisted of the
standard course material, which covers principles of system dynamics and tools for dynamic modeling and systems thinking including causal loop diagrams, stock and flow mapping, and computer simulation. Students complete five assignments in the half term. These include: building a simple simulation model of the SARS epidemic (Assignment 1); developing causal diagrams of various business and public policy issues (Assignment 2); stocks and flows,
including identification, mapping, graphical integration, and building simple simulation models (Assignment 3); applying their modeling skills to evaluate the business strategy of a firm or of their choice (Assignment 4), and the People Express Management Flight Simulator (Assignment 5). Stocks and flows were introduced in the first class (after the pretest was administered). Two sessions (sessions 4 and 5) were specifically devoted to stocks and flows; sessions afterwards often used stock and flow diagrams and concepts in developing the examples used in class discussion. Students were assigned reading for each class, including the chapters on stocks and flows from Sterman (2000).1
Figure 2. Experimental Design.
To avoid performance improvement arising from reuse of the pretest as the post-test instrument, the post-test consisted of the graphical department store task described in Cronin,
1 The syllabus, readings, and the stock-flow assignment are available online at
http://ocw.mit.edu/OcwWeb/Sloan-School-of-Gonzalez and Sterman (Figure 3). The graphical department store task also allows a direct test of the extent to which people rely on the correlation heuristic. The post-test was administered in the 9th
class session, two sessions after students completed the assignment on stocks and flows. Administering the post-test one week after the due date for the stock and flow assignment reduces the chance of priming the students that the post-test must involve stock-flow reasoning. Because the pre- and post-tests are different tasks performance on them does not directly assess the extent of improvement resulting from the treatment. To do so, I compare performance on the post-test to the performance of the students who completed the same graphical department store task on the first day of the same class in the fall term of 2007. As shown below, the
demographics of these subjects, whose performance is reported in Cronin et al. (2009), are not statistically significantly different from those of the students who completed the task as the post-test in the Fall of 2008. The difference in performance between these two groups can therefore be interpreted as a measure of the impact of the treatment, that is, of participating in the class and being exposed to the material on stocks and flows.
Administration of the pre- and post-tests followed the protocol described in Cronin et al. (2009) so that the results could be compared. Specifically, students received the pre- and post-tests at the beginning of the first and ninth class periods, respectively. The tasks were
administered on paper. Cronin et al. show that question order in the classic department store task (the pretest) had no impact, so all students received the questions in the same order (shown in Figure 1). Students also provided demographic information such as age, gender, work
experience, etc. In the case of the post-test, students were randomly assigned to each of the 8 experimental conditions. For both pre- and post-test, students were given ten minutes to
complete the task; as in prior use of these tasks, many students finished far faster. Students were told that participation was voluntary and that the results would not be graded, but would be helpful to the instructor in improving future offerings of the course and in this research.
Figure 3. The “graphical” department store task, used to identify the prevalence of the
correlation heuristic (Cronin, Gonzalez and Sterman, 2009). Subjects were randomly assigned to receive one of eight different patterns for the number of people entering and leaving the store (see Fig. 3 parts 2 and 3, below).
The graph below shows the number of people entering and leaving a department store over a 30 minute period.
In the space below, graph the number of people in the store over the 30 minute interval. You do not need to specify numerical values. The dot at time zero shows the initial number of people in the store.
0 9 18 27 36 0 2 4 6 8 10 12 14 16 18 20 22 24 26 28 30 Time (minutes) Entering Leaving People/minute 0 2 4 6 8 10 12 14 16 18 20 22 24 26 28 30 Time (minutes)
Figure 3 (continued). Correct and typical incorrect responses for the graphical department store task (Cronin, Gonzalez and Sterman 2009).
1. Constant Flows; I < O 2. Linear decline in both I and O, Constant Net Flow, I > O
3. Constant Outflow, Linear increase in Inflow; I ≤ O
4. Constant Outflow, Linear increase in inflow; I ≥ O
F lo w s C o rr e c t Re s p o n s e
Net flow is constant and < 0. Stock falls linearly.
Net flow is constant and > 0. Stock rises linearly.
Net flow < 0, rises linearly to 0 by time 30. Stock falls at decreasing rate, is constant at t=30
Net flow > zero, rises linearly throughout. Stock rises at increasing rate from initial equilibrium. Re s p o n s e S h o w in g C o rr e la ti o n 0 10 19 29 38 0 2 4 6 8 10 12 14 16 18 20 22 24 26 28 30 Time (minutes) Entering Leaving People/minute 0 9 18 27 36 0 2 4 6 8 10 12 14 16 18 20 22 24 26 28 30 Time (minutes) Entering Leaving People/minute 0 9 18 27 36 0 2 4 6 8 10 12 14 16 18 20 22 24 26 28 30 Time (minutes) Entering Leaving People/minute 0 9 18 27 36 0 2 4 6 8 10 12 14 16 18 20 22 24 26 28 30 Time (minutes) Entering Leaving People/minute 0 2 4 6 8 10 12 14 16 18 20 22 24 26 28 30 Time (minutes)
People in the Store
0 2 4 6 8 10 12 14 16 18 20 22 24 26 28 30
Time (minutes)
People in the Store
0 2 4 6 8 10 12 14 16 18 20 22 24 26 28 30
Time (minutes)
People in the Store
0 2 4 6 8 10 12 14 16 18 20 22 24 26 28 30
Time (minutes)
Figure 3 (continued). Correct and typical incorrect responses for the graphical department store task (Cronin, Gonzalez and Sterman 2009).
5. Constant Flows; I ≤ O 6. Linear decline in both I and O, Constant Net Flow, I ≤ O
7. Constant Outflow, Linear increase in Inflow; I ≥ O
8. Constant Outflow, Linear increase in inflow; I ≥ O
F lo w s C o rr e c t R e s p o n s e
Net flow > 0, falls linearly to 0 by t = 30. Stock rises at decreasing rate, reaches equilibrium at t = 30.
Net flow ≤ 0, rises to 0 at midpoint, then falls. Stock falls at decreasing rate, is flat at midpoint, then falls at increasing rate.
Initially zero, net flow rises to max, then falls. Stock follows s-shape with inflection point at midpoint and equilibrium at start and end.
Net flow ≥ 0, follows S-shape. Stock starts in equilibrium, rises at increasing rate until last few minutes, where growth is linear.
R e s p o n s e S h o w in g C o rr e la ti o n 0 9 18 27 36 0 2 4 6 8 10 12 14 16 18 20 22 24 26 28 30 Time (minutes) Entering Leaving People/minute 0 11 22 34 45 0 2 4 6 8 10 12 14 16 18 20 22 24 26 28 30 Time (minutes) Entering Leaving People/minute 0 11 22 34 45 0 2 4 6 8 10 12 14 16 18 20 22 24 26 28 30 Time (minutes) Entering Leaving People/minute 0 11 22 34 45 0 2 4 6 8 10 12 14 16 18 20 22 24 26 28 30 Time (minutes) Entering Leaving People/minute 0 2 4 6 8 10 12 14 16 18 20 22 24 26 28 30 Time (minutes)
People in the Store
0 2 4 6 8 10 12 14 16 18 20 22 24 26 28 30
Time (minutes)
People in the Store
0 2 4 6 8 10 12 14 16 18 20 22 24 26 28 30
Time (minutes)
People in the Store
0 2 4 6 8 10 12 14 16 18 20 22 24 26 28 30
Time (minutes)
Subjects
A total of Npre = 255 students completed the pretest and provided usable demographic
information. Of these, Npost = 173 completed the post-test. Table 1 summarizes the
demographics for the pre- and post-tests and compares the subject pool to the samples reported in Cronin, Gonzalez and Sterman (2009). Mean age for the pretest was 28.4 years (range: 19 – 39), with a mean of 4.9 years of work experience (range: 0 to 15), and 71% were male. Seventy percent were 2nd
year MBA students, 10% were enrolled in the Leaders for Manufacturing program (a dual-degree program in which students receive both an MBA and a masters degree in engineering), 15% were MIT graduate students in other programs including the Sloan doctoral program and masters and doctoral programs in engineering and science, roughly 3% were MIT undergraduates and approximately 3% were graduate students from Harvard and other
universities. As in prior semesters of the class, and typical of the student population at MIT and the Sloan School, the students are highly trained in technical fields: 58% list science,
technology, engineering, or mathematics as the field of their highest prior degree; 36% are trained in the social sciences, including economics, business and finance; 3% are trained in architecture; only 3% listed a field in the humanities. To determine the extent of prior exposure to system dynamics concepts, students were asked whether they had played the Beer Game (Sterman 1989); 86% had done so (the beer game is used as the capstone event in the orientation program for incoming MBA students, hence most of the MBAs had played the game
approximately one year prior to enrolling in the class). In addition, 25 students (10%), all 2nd
year MBAs, had participated in a half-day workshop on the dynamics of climate change the author conducted in the spring term of 2008. That workshop focused explicitly on stock-flow structure and included several graphical integration exercises with climate change cover stories (Martin 2008, Sterman and Booth Sweeney 2007). Finally, students were asked if they had seen the classic department store (pretest) task before; only one had, and this subject is excluded from the demographics and analysis. Of those who provided demographics and completed the pretest,
a total of Npost = 173 students completed the post-test at the beginning of the ninth class session.
The difference in sample size between the pre- and post-test reflects the fact that the course is an elective, so a number of students who attended the first session and completed the pretest either dropped the course or chose not to attend the day the post-test was administered. An additional 28 students completed the post-test but not the pretest, indicating that they did not attend the first class in which the pretest was administered. Demographic data for these students is not available and they are not included in the analysis. To assess the extent of selection bias among those who survived the first day and later completed the post-test, I compared the demographics of those who completed the pretest only to those who completed the pretest and post-test. Age was statistically significantly higher in the post-test group (t = 2.05, p = .042), but the difference between the group means of 0.4 years is not substantively significant. The only other statistically significant difference is in the proportion of students who had participated in the Beer Game, which increased from 75% among those completing the pretest only to 91% among those who completed both pre- and post-test (2-sided Wilcoxon test; p = .0006). The proportion increased because the course was oversubscribed on the first day; Sloan rules require priority be given to Sloan students, all of whom experience the Beer Game during MBA orientation, compared to students from other programs and universities, most of whom have not played the game. All other factors, including sex, English as a native language, work experience, field of study, highest prior degree, etc. were not statistically significantly different between those who completed the pre-test only and those who completed both pre- and post-test. Further, there were no statistically significant differences (at p < 0.10) between those taking the graphical
department store task as the post-test in the Fall of 2008 and those who completed the same task on the first day of class in the Fall of 2007, including age, work experience, sex, English as a native language, degree program in which the subjects were enrolled, highest prior degree or field of study, and beer game experience. Therefore it is reasonable to compare the performance of these groups to measure the impact of the treatment.
Table 1. Subject demographics for the pretest, post-test, and comparison groups reported in
Cronin, Gonzalez and Sterman (2009). 1. Pretest, Fall 2008 (N = 255) 2. Classic Department Store (Cronin et al.) (N = 173) 3. Post-test, Fall 2008 (N = 167) 4. Graphical Department Store, Fall 2007 (Cronin et al.) (N = 282) Age 28.4 σ = 3.3 range 19-39 29.2 σ = 4.7 range 20-46 28.8† σ = 3.1 range 22-39 28.2 σ = 3.4 range 20-44 Years of Work Experience 4.9 σ = 2.7 range 0-15 NA 5.1 σ = 2.7 range 0-15 4.8 σ = 2.9 range 0-22 Gender = Male .706 .789 .701 .706 Native language = English .533 .500 .557 .630 Program 1st year MBA 0 .243 0 0 2nd year MBA .702 .139 .701 .716 LFM .098 .046 .120 .067
Other MIT grad student .145 .295 .156 .111
Other University .028 .127 .006 .064
Undergraduate .028 .012 .018 .039
Highest Prior Degree
High School .028 .012 .018 .039 BA .306 .162 .283 .292 BS .400 .422 .416 .377 Masters .239 .353 .253 .249 Ph.D. .012 .052 .018 .018 Other (JD, MD, etc.) .016 0 .012 .025
Field of highest degree1
STEM .582 .674 .600 .577 Social Science .357 .267 .338 .385 Humanities .033 .041 .031 .034 Architecture .029 .017 .031 .004 Beer Game? .855 .503 .910‡ .862 Climate Change Workshop? .098 0 .096 0
† = p < 0.05 for H0: Age(Pretest subjects only) = Age(Subjects taking both pre- and post-test); t-test,
Results: Pretest
Table 2 presents the results of the pretest for both the full group that completed the pretest, Npre = 255, and the subsample of those who later completed the post-test, Npost = 167. As
in Sterman (2002) and Cronin et al. (2009), responses were considered correct if they were within ±1 minute of the correct answer. For example, the most people enter the store at t = 4; responses of t = 3, 4, or 5 were coded as correct. The task is designed so that the timing of key events listed in table 2 are separated by more than two minutes.
Consistent with prior results, these highly educated subjects are able to read the graph and distinguish between those entering and those leaving. For the full sample, Npre, performance
on Q1: Most entering was 95% and on Q2: Most leaving was 93%. Most of those responding incorrectly reversed the entering and leaving data, gave the maximum net in- or out-flow instead of the gross flows, or gave the y-axis values rather than the time at which the maximum gross flows occurred.
Table 2. Pretest results. Each column shows the proportion of subjects who selected the
response indicated in each row for each of the four questions in the classic department store task. Npre = results for full sample of 255 subjects who completed the pretest. Npost = pretest results for
subsample of 167 who also went on to complete the post-test in class 9. CGS = results for 173 subjects who completed the pretest on the first day of class in a prior semester, as reported by Cronin, Gonzalez and Sterman (2009). Bold indicates the correct answer.
Q1: Most Entering Q2: Most Leaving Q3: Most in Store Q4: Fewest in Store Response: Npre Npost CGS Npre Npost CGS Npre Npost CGS Npre Npost CGS
Max Entering t=4 .953 .958 .960 .012 .018 0 .008 .006 .035 .004 .006 .006 Max Leaving t=21 .004 .006 .012 .933 .934 .948 0 0 .006 .012 .012 .017 Max in Store t=13 0 0 0 0 0 0 .510 .503 .439 .035 .036 .023 Fewest in store t=30 0 0 0 0 0 0 0 0 .006 .380 .377 .312 Max Net Inflow t=8 .012 .006 .023 .008 .006 0 .263 .305 .289 0 0 0 Max Net Outflow t=17 0 0 0 .012 .006 .035 .035 .030 .035 .224 .240 .295 Initial in Store t=1 0 0 0 0 0 0 0 0 0 .090 .078 .069 Canʼt be Determined .012 .012 0 .012 .012 0 .141 .138 .168 .192 .204 .249 Other .016 .018 .006 .020 .024 .012 .027 .012 .012 .035 .036 .012
However, performance on the two stock-flow questions is poor. Only 51% correctly identified when the most people are in the store (Q3), while 14% said it can’t be determined and 26% selected t = 8, which is the point at which the net inflow to the store reaches its maximum. Only 38% correctly determined when the fewest are in the store (Q4), while 19% said it can’t be determined and 22% selected t = 17, which is the point at which the net outflow reaches its maximum.
As described above, only 167 of the 255 students who took the pretest went on to take the post-test. It is important to test for selection bias among those who went on. Comparing the fraction correct for those who later took the post-test against those who did not shows no
statistically significant differences (the Fisher exact test of H0: Fraction correct(post) = Fraction
correct(~post) yields p = .76, 1.00, .79, .89 for Q1-4, respectively). There do not appear to be any important differences in the responses of those who continued with the class and took the post-test compared to those who did not.
Table 2 also compares the results against the results of the classic department store task reported in Cronin et al. (2009). The data reported by Cronin et al. should be comparable: they were collected in a prior semester of the same course, using the same protocol and under nearly identical circumstances (the first day of class, the same instructor, the same room). The
performance of the 2008 students is not statistically different from those of the Cronin et al. group: For the full pretest sample, the Fisher test yields p = .82, .68, .17, .15 for the fraction correct on Q1-4, respectively (results are similar when the Npost sample is used).
The pretest results show that, prior to any exposure to system dynamics concepts, many students have a weak grasp of stock-flow principles. Despite the simplicity of the department store task, fewer than half correctly identify when the most and fewest people are in the store. Nearly a quarter of all respondents mistake the maximum net in- and out-flow rates for the maximum and minimum of the stock of people in the store, a fundamental confusion about the process of accumulation. The question now is whether exposure to these concepts in the course improves their understanding of stock-flow relationships.
Post-test: Method
The post-test uses the graphical department store task shown in Figure 3. Cronin, Gonzalez and Sterman (2009) use this task to determine the extent to which people erroneously rely on the “correlation heuristic” in assessing the behavior of stock-flow systems.
Suggested by prior work (Booth Sweeney and Sterman, 2000), the correlation heuristic is a form of pattern matching in which people assume that the output of a system (e.g., the number of people in the store) should “look like” the input (the flow or net flow of people into the store). Booth Sweeney and Sterman (2000) found extensive use of the correlation heuristic among erroneous responses to simple tasks including inferring the level of water in a tub or the cash balance of a firm from graphs of the inflows and outflows. These results have been replicated with diverse student populations (e.g., Atkins et al., 2002; Ossimitz, 2002; Pala and Vennix, 2005). The graphical department store task was designed to test the extent to which people rely on the correlation heuristic, and to identify which cues—inflow, outflow, or net flow—people select as the basis for estimating the behavior of the stock.
As shown in Figure 3, each of the eight different conditions for the graphical department store task consists of a graph showing the flow of people entering and leaving a store over 30 minutes. Participants were directed to draw the number of people in the store throughout the 30 minutes on a blank graph placed directly beneath the flow graph. The eight flow patterns ranged from constant flows to more complex shapes. Note that no numerical scales are provided for the flow data or for the blank graph for the subjects’ response. The graph for the stock includes a point indicating the initial number of people in the store. To avoid biasing participant responses, that point is placed at the midpoint of the vertical axis. In all cases, it is possible to answer correctly without knowledge of calculus and without carrying out any calculations.
Subject responses were coded correct or incorrect, and correlations between the pattern drawn for the stock and any of the flows, if present, were noted. A response was judged qualitatively correct if it was consistent with basic stock-flow principles: (i) the stock is rising, constant, or falling when the net inflow is positive, zero, or negative, respectively; and (ii) the
rate of change (slope) of the stock is increasing (decreasing) when the net flow is increasing (decreasing). Participants were not penalized for drawing patterns that were not quantitatively correct or that did not show the number in the store beginning at the initial point provided on the graph. Erroneous responses were coded to determine whether the correlation between the stock and inflow or net flow was +1 (perfect pattern matching), or –1. A correlation of –1 indicates perfect pattern matching, but with the pattern inverted; such inversion might occur when the net flow is positive but falling (e.g., treatment 5); in such a case the participant realizes that the stock is rising, but still erroneously concludes the stock follows the shape of the net flow.
The eight flow patterns divide into three groups. Group I consists of conditions 1 and 2 and should be the easiest: participants need only realize that the net flow is constant, determine whether it is positive or negative, and draw a straight line with positive or negative slope. Group II consists of conditions 3, 4 and 5. These all have constant outflow and linear inflow:
participants must determine whether the net flow is positive or negative, note whether the net flow is increasing or decreasing, and then draw a curve that is rising or falling at an increasing or decreasing rate. Group III comprises conditions 6, 7, and 8 and should present the greatest difficulty: These have constant outflows but nonlinear patterns for the inflow: participants must determine whether the net flow is positive or negative, then determine whether the net flow is increasing or decreasing in each part of the thirty minute interval, and sketch a path that shows the stock rising or falling with qualitatively correct changes in slope.
Table 3 presents the results for the post-test and compares them to the results in Cronin et al. (2009). The Cronin et al. results provide a useful comparison because they were collected on the first day of the same class in the prior year (2007). As shown in table 1, the demographics of the two groups are essentially identical. Further, the task was administered to the two groups under the same protocol, by the same instructor, in the same room, at nearly the same time of day. The main difference between the post-test group and the subjects in 2007 is that the 2007 subjects received the task on the first day of class while the 2008 subjects received it in the 9th
Results improve significantly in the post-test compared to the results from 2007 (Figure 4, Table 3). Overall, 25% of the participants responded incorrectly, nearly half the rate of 46% in 2007, a highly statistically significant reduction (p < 6 x 10⁻⁶
by the Fisher test). Performance improved for all treatments except treatment 2, where the difference (25% vs 22.2% incorrect) is not statistically significant (p = 1). Performance improved in all three groups, though the
improvement in Group I is not statistically significant, perhaps because of the generally high performance and comparatively small sample size compared to the other groups. In Group I, the simplest tasks with constant flows, the fraction incorrect fell from 21% to 15% (but is not
statistically significant; p = .62). Performance in Group II, three tasks with linearly changing net flows, improved significantly, from 46% incorrect to 15% incorrect (p = 2.3 x 10⁻⁵
). In Group III, the most difficult tasks, with nonlinear net flows, performance improved significantly, from 64% incorrect to 41% incorrect (p = .006).
Figure 4. Graphical Department Store Task: Post-test results (Fall 2008) compared to results
from first day of class in Fall 2007 (Cronin, Gonzalez and Sterman, 2009). Left: percent responding correctly. Right: % of those responding incorrectly exhibiting pattern matching (using the correlation heuristic).
0 10 20 30 40 50 F07 F08 46.1 24.7 % Correct Pretest Post-test p < .00001 0 20 40 60 80 F07 F08 70.8 51.2
% of Incorrect Exhibiting Correlation
Pretest Post-test
Turning to the prevalence of pattern matching (the correlation heuristic), Figure 4 and Table 3 also show the fraction of those responding incorrectly whose responses exhibit perfect correlation with the input cues (the stock trajectory drawn by the subject is perfectly correlated, +1 or -1, with the inflow or net flow). The fraction of those responding incorrectly whose
answers exhibit correlation fell overall, from 71% in Fall 2007 to 51% in Fall 2008, significant at
p = .024. The proportion of erroneous responses exhibiting correlation fell in all three groups,
though the drop is significant only for Group II. The incidence of erroneous use of the
correlation heuristic relative to all subjects fell substantially and significantly, from 32.6% in Fall 2007 to 12.7%, p = 1.8 x 10⁻⁶
.
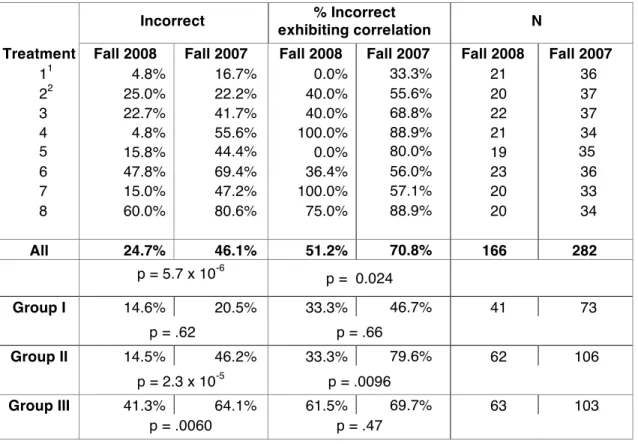
Table 3. Graphical Department Store Task: Post-test results (Fall 2008) compared to results
from first day of class in Fall 2007 (Cronin, Gonzalez and Sterman, 2009).
Incorrect % Incorrect
exhibiting correlation N
Treatment Fall 2008 Fall 2007 Fall 2008 Fall 2007 Fall 2008 Fall 2007
11 4.8% 16.7% 0.0% 33.3% 21 36 22 25.0% 22.2% 40.0% 55.6% 20 37 3 22.7% 41.7% 40.0% 68.8% 22 37 4 4.8% 55.6% 100.0% 88.9% 21 34 5 15.8% 44.4% 0.0% 80.0% 19 35 6 47.8% 69.4% 36.4% 56.0% 23 36 7 15.0% 47.2% 100.0% 57.1% 20 33 8 60.0% 80.6% 75.0% 88.9% 20 34 All 24.7% 46.1% 51.2% 70.8% 166 282 p = 5.7 x 10⁻⁶ p = 0.024 Group I 14.6% 20.5% 33.3% 46.7% 41 73 p = .62 p = .66 Group II 14.5% 46.2% 33.3% 79.6% 62 106 p = 2.3 x 10⁻⁵ p = .0096 Group III 41.3% 64.1% 61.5% 69.7% 63 103 p = .0060 p = .47
1. Inflow, Outflow and Net Flow are all constant. A subjectʼs response was coded as showing correlation if the response was also constant (a horizontal line).
2. Inflow and Outflow are correlated; Net Flow is constant. A subjectʼs response was coded as showing correlation if the response was either correlated to the inflow (a straight line) or was constant,
Impact of Demographics on Performance
People’s understanding of accumulation and the extent to which they learn from the course material may be affected by demographic characteristics including prior degrees, prior field of study, and so on. Booth Sweeney and Sterman (2000) found some evidence for such effects on a variety of graphical integration tasks, including weak evidence of a gender effect (males performed better than females) and some evidence of a field effect (those with more technical training did somewhat better). I estimated logistic regression models to explore the impact of subject demographics on performance for both pre- and post-tests.
Table 4 shows the significance levels of tests of each individual demographic variable on the fraction correct for each of the four questions in the pretest. Considering the first two
questions, which assess whether subjects can interpret the graph, none of the demographic variables have a statistically significant impact on the fraction correct, with the exception of English as a native language for Q1 only (p = .044). There is, however, no plausible reason for native language to matter for the question of when the most people left the store but not for when the most people entered the store. Turning to performance on the two stock-flow questions (Q3 and Q4, most and fewest in the store, respectively), age, work experience, English as a native language, prior experience with the beer game, and participation in the half-day climate change workshop have no significant effects on performance. However, there is a highly significant gender effect, with males outperforming females (p < .0001). The degree program in which the student is enrolled has a marginally significant effect for both questions. The highest prior degree has at best a marginal effect on Q4 only, and the prior field of study (STEM, social science, humanities, or architecture) has a significant effect on Q3 only. Table 4 also shows the Spearman rank correlations among responses on each of the pretest questions. As one would expect, correct responses on Q1 and Q2 are highly correlated (r = .68, p < .0001): if one cannot determine when the most people enter the store, one is also unlikely to know when the most are leaving. Also as expected, correct responses on the two stock-flow questions (Q3 and Q4) are highly correlated (r = .67, p < .0001): if one cannot determine when the most people are in the
store, one is also unlikely to know when the fewest are in the store. Performance on the
graphical interpretation questions tends to improve performance on the stock-flow questions, but much more weakly, and the impact is significant only for Q3 (when the most are in the store): the ability to read the graph is necessary but far from sufficient to understand the stock-flow structure of the task.
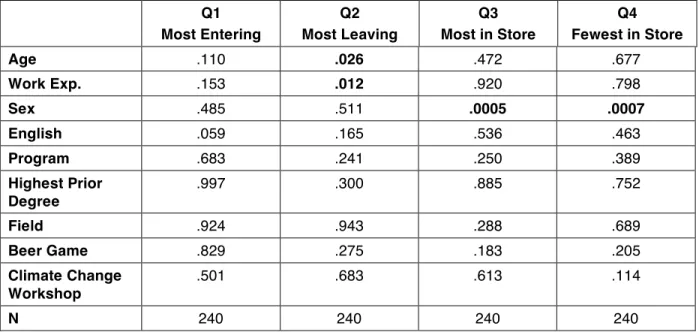
Table 4. Impact of subject demographics on pretest performance. Entries are the significance
levels (p-values) for sex, English, beer game, climate change workshop from 2-sided Wilcoxon test; for program, highest prior degree and field from Kruskal-Wallis test; for Age and Work Experience from the χ2
test of the likelihood ratio derived from univariate logistic regression. Bold values show p < .05.
Q1 Most Entering Q2 Most Leaving Q3 Most in Store Q4 Fewest in Store Age .575 .512 .541 .790 Work Exp. .858 .094 .824 .874 Sex .341 1.00 < .0001 < .0001 English .044 .299 .738 .850 Program .420 .686 .050 .063 Highest Prior Degree .984 .534 .220 .099 Field .715 .825 .025 .161 Beer Game .292 .740 .170 .448 Climate Change Workshop .414 .574 .915 .277
Spearman Correlations and Significance Levels
Q1 .683 p < .0001 .153 p = .015 .098 p = .119 Q2 .210 p = .0008 .112 p =.074 Q3 .671 p < .0001
Table 4 shows the results of univariate tests; a more appropriate test would account for the relationships among the different demographic variables. Multivariate logistic models were run with the fraction correct on Q1-4 as the dependent variable (Table 5). Results show even smaller impact of demographics than revealed by the univariate tests. For Q1, none of the demographic variables are statistically significant at p < .05. For Q2, age and work experience are significant at p < .05. For Q3 and Q4, only sex had a significant effect (p < .001 for both). Results were similar when the logistic regression excluded those variables the univariate analysis suggested had no impact (i.e., age, work experience, native language, beer game experience and participation in the climate change workshop).
Table 5. Statistical significance of subject demographics on pretest performance, multivariate
logistic regression. Entries are p-values for each effect. Values of p < .05 in bold print.
Q1 Most Entering Q2 Most Leaving Q3 Most in Store Q4 Fewest in Store Age .110 .026 .472 .677 Work Exp. .153 .012 .920 .798 Sex .485 .511 .0005 .0007 English .059 .165 .536 .463 Program .683 .241 .250 .389 Highest Prior Degree .997 .300 .885 .752 Field .924 .943 .288 .689 Beer Game .829 .275 .183 .205 Climate Change Workshop .501 .683 .613 .114 N 240 240 240 240
Turning to performance on the post-test, Table 6 shows the impact of subject
demographics on post-test performance. Univariate tests show statistically significant effects of sex, field of study, and of course which of the eight patterns of people entering and leaving the subject received. However, as in the case of the pretest, multivariate logistic regression shows
even weaker effects of the demographics. Table 6 shows the significance levels for the demographic and other variables in a set of logistic regressions incorporating combinations of the demographic variables, the treatment condition received in the post-test, and performance on each of the four pretest questions. As in the pretest, there is a strong effect gender, but the effects of age, work experience, native language, beer game experience and participation in the climate change workshop in which stock and flow concepts were discussed are not statistically significant in predicting success on the post-test. In addition, the effects of the degree program in which the student is enrolled, highest prior degree, and field of study (STEM, social science, humanities, or architecture) also were not significant.
With so many correlated regressors, the validity of the logistic regression is questionable, so successive models eliminated variables that appeared to offer no explanatory power. The results remain similar. Which of the eight patterns the subject received is always highly significant, along with the impact of gender, with males outperforming females.
An important issue is the extent to which performance on the post-test is predicted by performance on the pretest. If correct responses on the pretest are highly predictive of post-test success, then it may be that students did not benefit from the course material on stocks and flows but rather that those who understood accumulation prior to the course simply did well on both pre- and post-tests, while those who did poorly on the pretest also did poorly on the post-test. The logistic regressions suggest this is not the case. As expected, performance on pretest
questions Q1 and Q2, which assess whether subjects can interpret the graph, are not predictive of post-test success. While the univariate Wilcoxon tests show that correctly responding on the two stock-flow questions in the pretest does predict post-test success, the effects are not robust in the logistic regressions. Responding correctly on the stock-flow questions in the pretest does improve the odds of success in the post-test, but the effect is marginally significant. As a final test, Table 6 also reports tests the extent to which those getting both pretest Q1 and Q2 correct, and Q3 and Q4 correct, predicts post-test performance. As expected, the impact of getting both graph interpretation questions correct is not significant. Getting both Q3 and Q4 correct,
indicating those with the best grasp of stock-flow concepts, does predict post-test performance slightly, but the effect is, at best, only marginally significant.
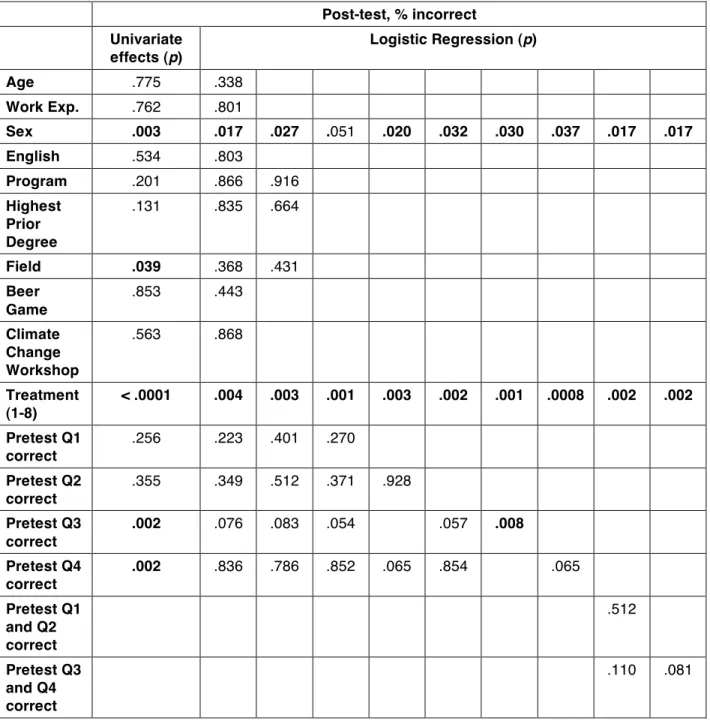
Table 6. Determinants of performance on graphical department store task. Univariate p-values
from logistic regression for Age and Work Experience, from nonparametric tests (Wilcoxon or Kruskal-Wallis) for all other variables.
Post-test, % incorrect Univariate effects (p) Logistic Regression (p) Age .775 .338 Work Exp. .762 .801 Sex .003 .017 .027 .051 .020 .032 .030 .037 .017 .017 English .534 .803 Program .201 .866 .916 Highest Prior Degree .131 .835 .664 Field .039 .368 .431 Beer Game .853 .443 Climate Change Workshop .563 .868 Treatment (1-8) < .0001 .004 .003 .001 .003 .002 .001 .0008 .002 .002 Pretest Q1 correct .256 .223 .401 .270 Pretest Q2 correct .355 .349 .512 .371 .928 Pretest Q3 correct .002 .076 .083 .054 .057 .008 Pretest Q4 correct .002 .836 .786 .852 .065 .854 .065 Pretest Q1 and Q2 correct .512 Pretest Q3 and Q4 correct .110 .081
Discussion and conclusions
Abundant research shows that people, including highly educated adults with substantial training in STEM, or quantitative social sciences, have poor understanding of stocks and flows and the principles of accumulation. These difficulties are not due to limits on working memory or mental computation capability, or to any easily correctable task features such as unfamiliar data presentation format, task context or cover story, insufficient time or lack of motivation (Gonzalez and Cronin 2007, Cronin, Gonzalez and Sterman 2009). Rather, people’s difficulties with accumulation appear to be a robust cognitive deficit analogous to the difficulties people have in probabilistic reasoning. The challenge is how to overcome this difficulty.
Here I use a pretest-treatment-post-test design to assess the extent to which a half-semester system dynamics course improves people’s ability to apply the principles of
accumulation. The subjects were students enrolled in the first half-semester introductory system dynamics class taught at the MIT Sloan School of Management. The pretest, the classic
department store task, showed the poor performance typical of this population in prior years. The treatment consisted of the standard course material, including only eight class sessions, only two of which were completely devoted to the concepts of stocks and flows. Students were also assigned to read the chapters on stocks and flows in Sterman (2000), and completed four
assignments before the post-test was administered, only one of which was focused on stocks and flows. That assignment (see the appendix) covers stock and flow identification, mapping stock and flow networks in various situations, one example of graphical integration, and construction of simple simulation models illustrating first-order linear positive and negative feedback.
The results of the post-test show that performance on the graphical department store task improved substantially and statistically significantly compared to a demographically similar set of subjects who did the task at the beginning of the term the previous year. The overall fraction correct improved significantly, with the error rate falling by nearly half. Among those who responded incorrectly, the fraction using the correlation heuristic (matching the pattern of the stock to the pattern of the inflow or net flow) dropped substantially and significantly as well.
Even the relatively brief exposure to stock-flow concepts provided by several class sessions, readings, and a single stock-flow assignment appear to improve people’s abilities to recognize stock-flow structure and correctly apply the principles of accumulation.
Nearly all subject attributes had little or no impact on performance, for either the pretest or post-test. Unsurprisingly, age, work experience, whether English was the student’s native language, and experience playing the Beer Game had no impact. In contrast, one might expect that prior educational background might have a strong impact on people’s ability to recognize stock and flow structure and apply the principles of accumulation. Surprisingly, however, the degree program in which the students were enrolled, which included both MBA students and graduate students in engineering and science, had no effect. Forty percent of the subjects earned a bachelor of science or engineering degree in their undergraduate training, and more than a quarter possessed a prior graduate degree, yet this factor was also not significantly related to performance on either the pretest or post-test. Even more surprising, the subjects’ field of study had no significant impact on performance. Nearly 60% of the subjects were trained in STEM (Science, Technology, Engineering, or Mathematics), with another roughly 36% trained in the social sciences, primarily economics and business and the remainder trained in humanities or architecture. Yet field of study was not statistically significantly related to performance. Among demographic factors, only gender was statistically significant, with males on average performing better than females. The reason for this difference is not known and deserves further study.
Success on the the stock-flow questions in the pretest is associated with success in the post-test, as expected: those who understand stocks and flows prior to taking the course should do well on both pre- and post-test. However, pretest stock-flow performance is only marginally significant as a predictor of performance on the post-test. The weak association of pretest and post-test performance provides evidence that the course material improved the subjects’
understanding of and ability to apply the principles of accumulation. The large improvement in performance compared to those who did the graphical department store task prior to taking the course is encouraging news for those who teach system dynamics.
However, several issues remain. Roughly 25% of the subjects still did the post-test incorrectly, and of these, half showed evidence of correlational reasoning. While performance improved by nearly half, and the incidence of correlational reasoning fell significantly, a disturbingly large minority of subjects still did not exhibit strong understanding of stock-flow concepts. As the instructor in the course, I believe the number of classes, problems to work, and assignments involving stock-flow concepts is simply not enough to provide sufficient practice for these concepts to become more broadly and deeply understood and internalized by the
students. Given these results, the even shorter exposure to stock-flow concepts provided in short academic and commercial training workshops is highly unlikely to be effective in overcoming the correlation heuristic and helping people learn the principles of accumulation. Those teaching system dynamics in other formats, and with other groups, should carry out evaluative research to assess the impact of their curriculum and pedagogy on student learning.
A second issue relates to the unusual characteristics of the subject population in this study. Graduate students at MIT are highly selected for top academic performance and
capability; they have far more training in STEM and other quantitative disciplines (economics, business) than the average person. Still their understanding of stocks and flows prior to exposure to the course is extremely poor. Further research into the failure of the educational system to provide such basic concepts, and effective methods to teach these concepts in the K-12 grades, is sorely needed (Booth Sweeney and Sterman 2007). Fortunately, there are some promising experiments underway, and the stock of educational materials for pre-college settings is growing (see the Creative Learning Exchange, http://www.clexchange.org, for examples).
It is also unclear how robust and durable the improved understanding of accumulation exhibited by the students tested here will be. Will their understanding of stocks and flows become internalized and readily recalled outside of the classroom and in later life? Will these students be able to recognize stock-flow structures and apply the principles of accumulation in everyday, naturalistic settings in which there are no special cues or prompts to trigger the relevance of stocks and flows? Long-term follow up study is needed.
References
Atkins, P., Wood, R., & Rutgers, P. (2002). The effects of feedback format on dynamic decision making. Organizational Behavior and Human Decision Processes, 88(587-604).
Booth Sweeney, L., & Sterman, J. D. (2000). Bathtub dynamics: Initial results of a systems thinking inventory. System Dynamics Review, 16(4), 249-286.
Booth Sweeney, L. and J. Sterman (2007). Thinking about systems: Students' and their teachers' conceptions of natural and social systems. System Dynamics Review 23(2-3): 285-312. Brehmer, B. (1990). Strategies in real-time, dynamic decision making. In R. M. Hogarth (Ed.),
Insights in decision making (pp. 262-279). Chicago: University of Chicago Press.
Brehmer, B. (1995). Feedback delays in complex dynamic decision tasks. In P. A. Frensch & J. Funke (Eds.), Complex problem solving: The European perspective (pp. 103-130). Hillsdale, NJ: Lawrence Erlbaum Associates.
Cronin, M., and Gonzalez, C. (2007). Understanding the building blocks of system dynamics.
System Dynamics Review, 23(1), 1-17.
Cronin, M., C. Gonzalez and J. D. Sterman (2009). Why Don’t Well-Educated Adults Understand Accumulation? A Challenge to Researchers, Educators, and Citizens.
Organizational Behavior and Human Decision Processes, 108(1): 116-130.
Diehl, E., & Sterman, J. D. (1995). Effects of feedback complexity on dynamic decision making.
Organizational Behavior and Human Decision Processes, 62(2), 198-215.
Gonzalez, C. (2005a). Decision support for real-time dynamic decision making tasks.
Organizational Behavior & Human Decision Processes, 96, 142-154.
Kleinmuntz, D. N. (1985). Cognitive heuristics and feedback in a dynamic decision environment.
Management Science, 31(6), 680-702.
Kleinmuntz, D. N. (1993). Information processing and misperceptions of the implications of feedback in dynamic decision making. System Dynamics Review, 9(3), 223-237. Kleinmuntz, D. N., & Schkade, D. A. (1993). Information displays and decision processes.
Moxnes, E. (2004). Misperceptions of basic dynamics: the case of renewable resource management. System Dynamics Review. 20(2), 139-162.
Omodei, M., & Wearing, A. (1995). The Fire Chief microworld generating program: An illustration of computer-simulated microworlds as an experimental paradigm for studying complex decision-making behavior. Behavior Research Methods, Instruments, & Computers,
27, 303-316.
Ossimitz, G. (2002). Stock-flow-thinking and reading stock-flow-related graphs: An emperical
investigation in dynamic thinking abilities. Paper presented at the International System
Dynamics Conference.
Pala, O., & Vennix, J. A. M. (2005). Effect of system dynamics education on systems thinking inventory task performance. System Dynamics Review, 21(2), 147-172.
Sterman, J. D. (1989a). Misperceptions of feedback in dynamic decision making. Organizational
Behavior and Human Decision Processes, 43(3), 301-335.
Sterman, J. D. (1989b). Modeling managerial behavior: Misperceptions of feedback in a dynamic decision making experiment. Management Science, 35(3), 321-339.
Sterman, J. D. (2000). Business Dynamics: Systems Thinking and Modeling for a Complex
World, Irwin/McGraw-Hill.
Sterman, J. D. (2002). All models are wrong: Reflections on becoming a systems scientist.
System Dynamics Review, 18, 501-531.
Sterman, J. D. (2008). Risk Communication on Climate: Mental Models and Mass Balance.
Science 322: 532-533 (24 October).
Sterman, J. D., & Booth Sweeney, L. (2002). Cloudy skies: Assessing public understanding of global warming. System Dynamics Review, 18(2), 207-240.
Sterman, J. D., & Booth Sweeney, L. (2007). Understanding public complacency about climate change: Adults' mental models of climate change violate conservation of matter. Climatic
Appendix
The following pages contain the syllabus for the course and the third assignment, which covers stocks and flows, including identifying and distinguishing stocks and flows, mapping the stock and flow structure of systems, graphical integration, and formulating and simulating simple models. Full information including all assignments and other materials is available on the course website, http://stellar.mit.edu/S/course/15/fa08/15.871ab/. A prior version of the course and assignments is available on http://ocw.mit.edu/OcwWeb/Sloan-School-of-Management/15-874Fall2003/CourseHome/.
Massachusetts Institute of Technology Sloan School of Management
15.871 Introduction to System Dynamics 15.872 System Dynamics II
Fall 2008
GENERAL INFORMATION
Background: 15.871 (Introduction to System Dynamics) is a 6 unit course meeting in H1.
871 & 872 15.872 (System Dynamics II) is a 6 unit course meeting in H2. Together they
constitute the introductory sequence in system dynamics. You can take 871 alone or both 871 and 872. Successful completion of both 871 and 872 is a prerequisite for advanced courses in system dynamics, work as an RA or TA in the field, as well as careers using system dynamics.
Schedule: Section A: Monday and Wednesday, 8:30 – 10:00 in E51-345.
Section B: Monday and Wednesday, 10:00 – 11:30 in E51-345.
Instructor: John Sterman, E53-351, 617.253.1951 (v), 617.258.7579 (f), [email protected]
Office hours: My door is always open to students, or make an appointment by email.
TAs: REDACTED
TA Sessions: The TAs will lead a weekly review session in which they will answer questions
about assignments in progress and discuss solutions to past assignments. There are two recitations: Friday, 10:00 – 11:30 and Friday, 14:30 – 16:00, both in E51-325. You may attend either one. The first session will be Friday, Sept. 5.
Grading Assignments: 85%
Emphasis: Class participation: 15%
Each assignment is graded on a 10-point scale. Two points will be forfeited for assignments handed in late. Assignments handed in more than 1 class late will receive no credit. This policy will be strictly enforced.
Web Site: We will be using Stellar <http://stellar.mit.edu/S/course/15/fa08/15.871ab> to
post course materials online. Non-MIT students can access Stellar after being added by the course administrator. The site contains the syllabus, assignments, simulation models, reading list, helpful hints, software access, and other useful information. We will use it to send emails with information such as hints for assignments, schedule changes for TA sessions, etc. You can also use the site to find partners for group assignments, or to pose questions to the class as a whole.
Handouts: Available on the class Stellar site. Any extra hard copies will be available