HAL Id: hal-01472129
https://hal-amu.archives-ouvertes.fr/hal-01472129
Submitted on 20 Feb 2017
HAL is a multi-disciplinary open access
archive for the deposit and dissemination of
sci-entific research documents, whether they are
pub-lished or not. The documents may come from
teaching and research institutions in France or
abroad, or from public or private research centers.
L’archive ouverte pluridisciplinaire HAL, est
destinée au dépôt et à la diffusion de documents
scientifiques de niveau recherche, publiés ou non,
émanant des établissements d’enseignement et de
recherche français ou étrangers, des laboratoires
publics ou privés.
El Niño evolution during the Holocene revealed by a
biomarker rain gauge in the Galápagos Islands
Zhaohui Zhang, Guillaume Leduc, Julian P. Sachs
To cite this version:
Zhaohui Zhang, Guillaume Leduc, Julian P. Sachs. El Niño evolution during the Holocene revealed
by a biomarker rain gauge in the Galápagos Islands. Earth and Planetary Science Letters, Elsevier,
2014, 404, pp.420-434. �10.1016/j.epsl.2014.07.013�. �hal-01472129�
Contents lists available atScienceDirect
Earth
and
Planetary
Science
Letters
www.elsevier.com/locate/epsl
El
Niño
evolution
during
the
Holocene
revealed
by
a
biomarker
rain
gauge
in
the
Galápagos
Islands
Zhaohui Zhang
a,
b,
∗
,
Guillaume Leduc
c,
d,
Julian
P. Sachs
aaUniversityofWashington,SchoolofOceanography,Seattle,WA98195,USA
bStateKeyLaboratoryforMineralDepositsResearch(NanjingUniversity),SchoolofEarthSciencesandEngineering,NanjingUniversity,22HankouRoad,
Nanjing,210093,China
cKielUniversity,InstituteofGeosciences,Kiel,Germany
dCEREGE,UMR7330,Aix-MarseilleUniversité,CNRS,IRD,Europôledel’Arbois,BP80,13545,Aix-en-ProvenceCedex4,France
a
r
t
i
c
l
e
i
n
f
o
a
b
s
t
r
a
c
t
Articlehistory:
Received3October2013
Receivedinrevisedform6July2014 Editor: J.Lynch-Stieglitz Keywords: ENSO Holocene Galápagos biomarker hydrogenisotope
TheElNiño-SouthernOscillation(ENSO)representsthelargestperturbationtotheclimatesystemonan inter-annual timescale,butitsevolutionsincetheendofthelasticeageremainsdebatedduetothe lack ofunambiguousENSO recordslasting longerthanafewcenturies. Changes inthe concentration and hydrogen isotope ratio of lipids produced by the green alga Botryococcusbraunii, whichblooms duringEl NiñorainsintheGalápagosIslands,indicatethattheearlyHolocene (9200–5600 yrBP)was characterizedbyalternatingextremesintheintensityand/orfrequencyofElNiñoeventsthatlasteda centuryormore.OurdatafromthecoreoftheENSOregionthuscallsintoquestionearlierstudiesthat reportedalackofElNiñoactivityintheearlyHolocene.Inagreementwithotherproxyevidencefrom thetropicalPacific,themid-Holocene(5600–3500 yrBP)wasatimeofconsistentlyweakElNiñoactivity, as weretheEarlyMiddleAges(∼1000–1500 yrBP).ElNiñoactivitywasmoderatetohighduringthe remainderofthelast3500years.PeriodsofstrongorfrequentElNiñotendedtooccurduringpeaksin solar activityand duringextended droughtsinthe UnitedStatesGreatPlains linkedtoLaNiña.These changing modesofENSO activityatmillennialand multi-centennialtimescalesmayhave beencaused byvariationsintheseasonalreceiptsofsolarradiationassociatedwiththeprecessionoftheequinoxes and/orchangesinsolaractivity,respectively.
©2014ElsevierB.V.All rights reserved.
1. Introduction
The tropical Pacific atmosphere–ocean system that drives the El Niño-Southern Oscillation (ENSO) is anticipated to change in responsetoincreasedradiativeforcingfromanthropogenic green-housegasemissions,withglobalrepercussions(Collinsetal.,2010; Pierrehumbert, 2000). Yet the nature and sensitivity of this re-sponse is not well understood (DiNezio et al., 2009), partly due toanincompleteknowledgeoftheunderlyingclimatephysicsand a lack of paleoclimate data bearing on ENSO variations through time.
Documentinghow ENSO evolved through theHolocene in re-sponse to known climate forcings is hence crucial for validat-ing model projections of ENSO in the future. Though a wealth of rainfall reconstructions from sedimentary sequences in the
*
Correspondingauthor.Presentaddress:SchoolofEarthSciencesand Engineer-ing,NanjingUniversity,22HankouRoad,Nanjing,210093,China.E-mailaddress:zhaohui@nju.edu.cn(Z. Zhang).
tropical Pacific has been produced in an effort to characterize ENSO during the Holocene (see Braconnot et al., 2012 and ref-erences therein), those studies remain inconclusive for two rea-sons. First, the oscillatory nature of ENSO between El Niño and La Niña conditions(Clementetal.,1999) candampenthesignalof inter-annualclimateextremesinslowlyaccumulatingsedimentary records since the two opposing modes tend to have counteract-ing effectson sea surface temperature (SST) reconstructionsthat average over decades to millennia. Second, it can be difficult to attributeasedimentarysignalunambiguouslytooneclimate phe-nomenon orthe other inlocations influencedby both ENSO and seasonal migrations of the IntertropicalConvergence Zone (ITCZ) (Braconnotetal., 2012; KoutavasandJoanides,2012;Leducetal., 2009a, 2009b;Thirumalaietal.,2013).Coralshavesub-annual res-olutionadequate toreconstructENSO,butasthey areshortlived the most comprehensive composite coral record to date is too under-sampled to document the complete Holocene time period (Cobbetal.,2013).Newcontinuoussedimentary archivesand cli-mate proxies that can be unambiguously attributedto ENSO are needed.
http://dx.doi.org/10.1016/j.epsl.2014.07.013 0012-821X/©2014ElsevierB.V.All rights reserved.
Fig. 1. Tropical PacificprecipitationandthelocationofEl JuncoLake.(a)Mapofmeanannualrainfall.ThelocationoftheGalápagosIslandsisshown.Thebandofheavy precipitationindicatestheITCZ.(b)MapoftheGalápagosIslandsshowingthelocationofSanCristóbalIslandandthepositionofElJuncoLake.(c)Panoramicphotographof ElJuncoLakeinSeptember,2004.Thelocationofanoverflowchannelisindicated.
Locatedon theequator
∼
1000 kmwest ofEcuador,the Galá-pagosarchipelagoliessouthofthemodernmean-annualITCZ po-sitionandfarfromcontinentalclimateeffectsthatcancomplicate the elucidation of coupled ocean–atmosphere processes in pale-oclimate records (Fig. 1a). The seasonal climate is characterized by a warm, wet season from January to June, when the ITCZ is nearest to the equator, and a cool, dry season from July to De-cember when the ITCZ is at its northernmost location (Fig. 2). At the height ofthe warm season in March, the ITCZ splits into northernandsouthernbranchesatabouttheequator,resultingin abimodal distribution ofrainfallwith maximaatabout5◦N and 5◦S,andarelativelydryequatorialzoneandGalápagosarchipelago during normalyears (Gu etal., 2005) (Fig. 2).The persistence of theequatorial cold tongue is the key to thisdouble ITCZ, which vanishesduring ElNiñoeventswhenanintense rainfallband ex-tendscontinuouslyfrom5◦Sto5◦N(Guetal.,2005).ElNiñoyears are thus associated with surges in rainfall inthe Galápagos that canexceedrainfallinnon-ElNiñoyearsbyanorderofmagnitude (Fig. 3).TheonlypermanentfreshwaterlakeintheGalápagos,ElJunco (0.30◦S,91.00◦W),lies670mabovesealevelintheclosedcaldera of an extinct volcano in the highlands of San Cristóbal Island (Fig. 1b, c). With a diameter of 280 m and a depth of 6 m El Juncocollects rainwaterfroma verysmall catchment(0.13 km2),
andisenshrouded in low-elevationstratusclouds(known locally asgarúa)formuchoftheyear.Anoverflowchannel3 mdeepand 2 mwideisevidentinthelowestpartoftherim(Fig. 1c,indicated byanarrow)(Colinvaux,1972),butasofthistimeweareunaware ofanyconfirmedobservationsofwaterflowingthroughthe chan-nel. Apart from this overflow and possible seepage through the rim,thelakebasinisclosed(endorheic).
In acompanion paper,AtwoodandSachs (2014) constructan idealized model of the hydrologic balance of El Junco Lake that takes into consideration precipitation, evaporation, seepage, and overflow.TheyfindthattheisotopemassbalanceoftheLake dur-ingElNiñowarmeventsis,toafirstorder,drivenbyanomalously highprecipitationratesratherthanbywaterlossviaevaporation, overfloworseepage(AtwoodandSachs,2014).
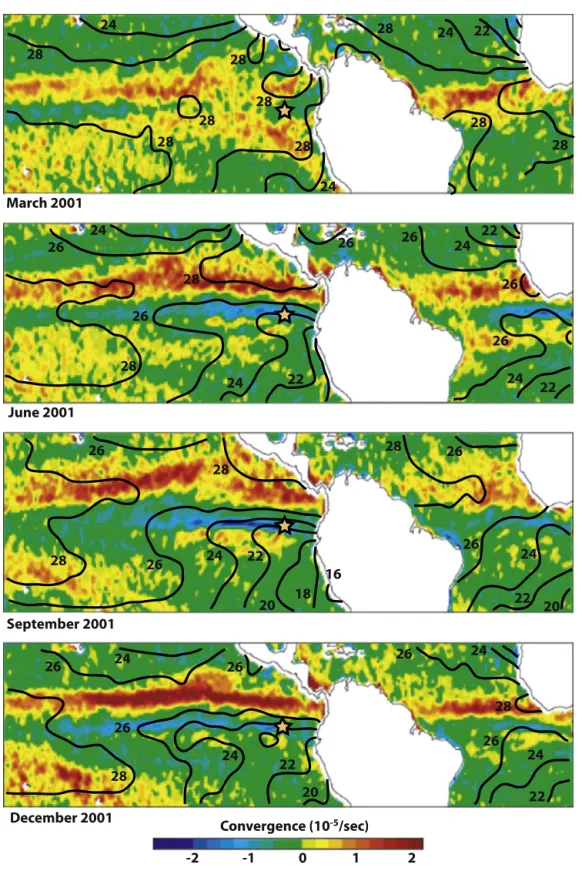
Fig. 2. Seasonal changesinwindstressconvergenceandseasurfacetemperature(SST).FieldsofwindstressconvergencearefromLiuandXie (2002).Theconvergence maximumisusedtotrackthelocationoftheIntertropicalConvergenceZone(ITCZ).SSTsarefromtheWorldOceanAtlas2009(Locarninietal.,2010).Theyellowstar indicatesthelocationoftheGalápagosIslands.ThemeanpositionoftheITCZisconsistentlyabovetheSSTmaximum.(Forinterpretationofthereferencestocolorinthis figurelegend,thereaderisreferredtothewebversionofthisarticle.)
In September 2004 we collected a 3.5 m-long 9 cm-diameter Nesjepistoncore(Conroyetal.,2008) andseveralwater–mud in-terfacecores fromthe lake(Sachs etal., 2009; Fig. 1c). Here we reconstructElNiñovariations during theHolocenefromthe con-centrationandhydrogenisotopiccompositionofalipidbiomarker froma single speciesofgreenalgae anddiscussthepossible cli-mateimplications.
2. Present-dayclimatology
The pattern of precipitation in the eastern equatorial Pacific (EEP) depends on complex ocean–atmosphere interactions. The most prominentoceanic feature ofthe EEP is the latitudinal sea surface temperature(SST)gradientseparatingwarmwatersinthe northeastern equatorial Pacific fromcold waterin the southeast-ern equatorial Pacific (the so-called “cold tongue”) (Fig. 2). This
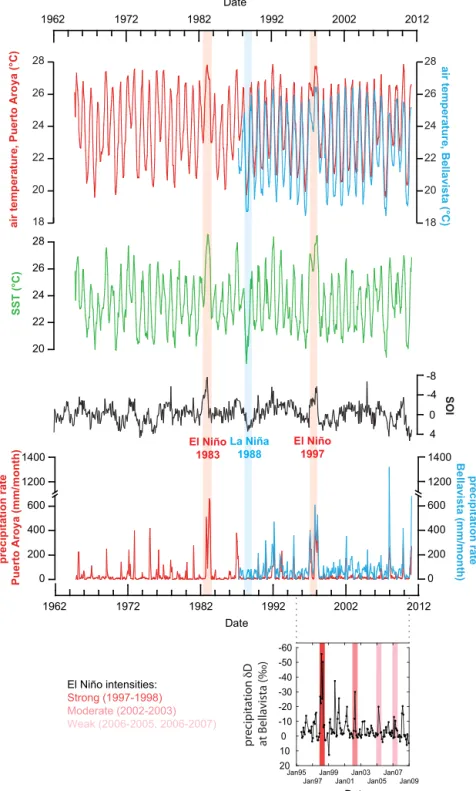
Fig. 3. Upper panels:GalápagosclimatologyandtheSouthernOscillationIndexforthe1962–2010timeperiod(Truemanandd’Ozouville,2010).TheGalápagosair tem-peratureandprecipitationdataaremonthly-averagedasmeasuredonSantaCruzIsland,onthecoastatPuertoAroya(redcurves)andat∼200 melevationatBellavista (bluecurves)(Truemanandd’Ozouville,2010).Alsoshownarelong-termchangesinSSTintheGalápagosregion(greencurve,Truemanandd’Ozouville,2010).Daily meteo-rologicalobservationsweresummarizedintochartsofmonthlyaveragesthatweredownloadedfromtheDarwinFoundationwebsite(http://www.darwinfoundation.org). ThehistoricalEl Niño(1983and 1997)andLaNiña(1988) eventsareshownas redandblue verticalbars,respectively. Bottompanel:ChangesinprecipitationδD atBellavista. Periodsofstrong,moderate andweak ElNiño onthe basisoftheOceanicElNiño index arehighlightedinred,darkpinkand lightpink,respectively (http://ggweather.com/enso/oni.htm).(Forinterpretationofthereferencestocolorinthisfigurelegend,thereaderisreferredtothewebversionofthisarticle.)
SSTgradientissustainedbytheadvectionofcoldwaterfromthe PerumarginbytheHumboldtCurrent(Fig. 2).Thechanging direc-tionoftheCoriolisforceattheequatorreinforcesthestrengthof theequatorialcoldtonguebecausetheassociatedequatorial diver-gencebringscoldwatertothesurface(Kessler,2006).
Because wind convergence occurs over SST maxima (Fig. 2), theseasonalandinter-annualchangesinEEPSSTfieldsultimately shapethepatternofwindstressconvergencethere.Theseocean–
atmosphere interactions dictate the location of the ITCZ and its associated precipitation on seasonal and inter-annual timescales (Figs. 2, 3, 4). As the ITCZ location closely tracks the regional SSTmaxima(Fig. 2),theNorth–SouthSSTgradientkeepstheITCZ Northoftheequatorduringmostofthetime.Duringaustral sum-merthelatitudinalSSTgradientdiminishesandtheITCZmigrates southtowardtheequator(Fig. 2).Duringnon-ElNiñoyearsa dou-ble ITCZ straddlingthe equator is sometimes observedin austral
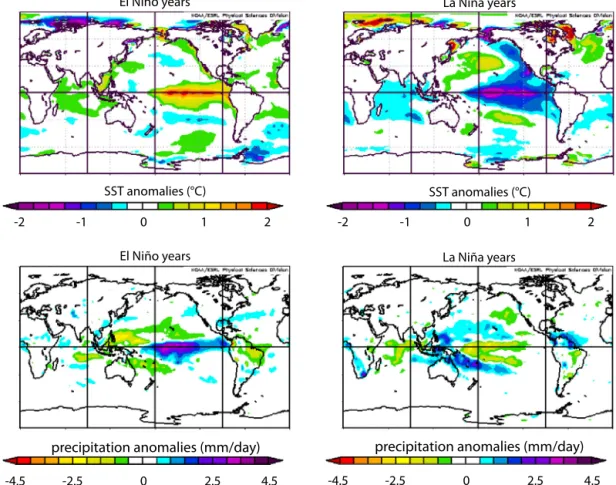
Fig. 4. SST and precipitationanomaliesfor El Niño andLa Niñayears1948–2010extracted from theNCEP reanalysisdata usingthe onlinemappingsoftware from http://www.esrl.noaa.gov.TheElNiñoanomalymaps(left panels)representthe NovembertoMarchaveragesfor theyears1958,1973,1983, 1987,1988,1989,1992, 1998,2003.TheLaNiñaanomalymaps(rightpanels)representtheNovembertoMarchaveragesfortheyears1955,1956,1965,1971,1974,1976,1989,1999,2000.
summer (Liu and Xie, 2002; Gu et al., 2005; Fig. 2). During El Niñoyears,anomalouslywarm surface watersinthe EEPcausea southwardmigration of theITCZ, andheavy rains inthe Galápa-gosIslands whereprecipitationcanexceedtheannualaverageby 10-fold(Figs. 3,4).
El Niño rains have a pronounced impact on the hydrological budgets of small crater lakes in the Galápagos Islands such as El Junco Lake (Colinvaux, 1972; Atwood and Sachs, 2014). Low-elevationcloudspreventthelakefromdesiccationduringthe win-ter time, and a light drizzle, known locally as garúa, may con-tribute up to 25% of the water to the lake catchment annually (Pryet et al., 2012). As the lake is filled by rain falling within the narrowcrater rim, its depthfluctuates slightly withthe sea-sons.Inter-annually,thelakelevelfluctuatesby50%ormore,rising withElNiñorainsandfallingduringLaNiñadroughts(Colinvaux, 1972). Apartfromasmalloverflow channelandpossibleseepage throughtherim,thelakebasin isclosed,makingitanaturalrain gaugecapturingpastrainfallvariability(Fig. 1c).
3. Methods
3.1. Samplecollection
WatersamplesandsedimentcoresfromElJuncoLakewere col-lected inSeptember 2004, during adry periodassociated witha moderateLa Niñaevent. Lakewater
δ
D values were analyzed at 1-mdepthintervalswiththemethoddescribedinZhangandSachs (2007).Precisionofwaterδ
Dmeasurements was0.
5h (
1σ
)
.The lake was 6 m deep and was well mixed at the time of the ex-pedition, as evidenced by near-constantδ
D values (7.
3h
atthe surfaceand7.
6h
at5 m),temperatures(19.3◦Cat1 m,18.6◦Cat5.5 m) andoxygenconcentrations(93%O2 saturationat1mand
89% O2 saturation at 5.5 m deep) in the water column. Though
thereisaslighttrendofdecreasedtemperatureandO2 saturation
inthewatercolumn,thebottomofthelakewaswelloxygenated. Sedimentsusedinthisstudyarefromasediment–waterinterface core(EJ7-MW1)recoveredfromthecenterofthelake,andfroma nearby3.5-m-longcoreobtainedwitha9-cm-diameterNesje pis-ton corer. The interface core was sampled every centimeter and theNesjecorewassampledevery5 cm.
3.2. Analysesofbiomarkersinthesediment
Sedimentsamples(about0.8to1g)werefreeze-driedpriorto extraction with organicsolvents. An internal standard containing 20 μg C36n-alkane,C21n-alkanolandC21n-fattyacidwas added
to sediment samples prior to extraction. Lipid extractions were performed on a Dionex ASE-200pressurized fluid extractorwith dichloromethane (DCM) and methanol (MeOH)(9:1) at 1500 psi and 150◦C. Neutral lipids were separated fromfattyacids onan aminopropyl cartridge-style SPE column (Burdick & Jackson, size 500 mg/4 ml)byelutingwithDCM/isopropylalcohol(3:1).Neutral lipidswerefractionatedbycolumnchromatographywith5% water-deactivatedsilicagel.Hydrocarbonswereelutedwithhexane,and then furtherfractionatedon activatedsilicageltoseparate botry-ococcenesfromotherhydrocarbonsbyelutionwithhexane. Quan-tification of botryococcenes discussed in this paper is based on the comparison in gas chromatograms with an internal standard ofC36 n-alkaneusingflameionization detection.AnAgilent6890
gas chromatograph was operated witha programmable tempera-turevaporizationinjector (PTV),a60 mVarianChrompacCP-Sil5 capillary column with0.32 mm i.d. and0.25 μm film thickness,
Table 1
210Pbactivity,cumulativedrymassandmodeledagesofElJuncoLakesediments.
Themodeledagesarebasedonthebulkdensityand210Pbmeasurements.Theyare
constrainedbyradiocarbonanalysesofbulksediment(INSTAAR,Universityof Col-orado,Boulder,CO,USA),fromwhichweinferdepositionbefore(−)orduring/after (+/++)atmosphericnuclearbombtestingintheearly1960’s.dpm/g=decaysper minutepergramdrysediment.
Depth (cm)
210Pbactivity
(dpm/g)
Cumulative dry mass
(g/cm2) Modeled age(yr AD)
0.5 122.827 1.88 2001 1.5 113.289 3.47 1996 2.5 106.224 5.13 1991 3.5 91.929 6.47 1986 4.5 78.059 7.73 1982(++) 5.5 71.923 9.16 1977 6.5 66.46 10.56 1972 7.5 64.847 12.31 1964(++) 8.5 68.224 13.64 1957(+) 9.5 61.902 15.05 1947 10.5 41.017 16.52 1936(−) 11.5 23.328 18.35 1924 12.5 18.826 20.3 1910 13.5 17.452 21.85 1897 14.5 18.368 23.21 1877
and helium as carrier gas. The temperature program was 80◦C to150◦Cat10◦C/min, thento 325◦Cat4◦C/min, anda 13min isothermalperiod.
3.3.Hydrogenisotopeanalysesoflipidbiomarkers
Thehydrogenisotopiccompositionofbotryococceneswas mea-sured by gas chromatography-isotope ratio-mass spectrometry (GC-IRMS) with a Thermo Delta V mass spectrometer, equipped withaTraceUltraGCandaGC-CIIIpyrolysisfurnace.
TheTraceGCwasequippedwithaPTVinletoperatedin split-less mode, a 30 m DB-5 capillary column (J&W Scientific) with 0.25mm i.d. and0.25 μm film, andwas operated at a constant helium flow rate of 1 ml/min. The oven temperature started at
80◦C,roseto200◦Cat10◦C/min,thento325◦Cat5.5◦C/min, fol-lowedby12minat325◦C.EffluentfromtheGCwaspyrolyzedin agraphite-linedceramictubeat1400◦C.Thehydrogengasstream wasintroducedtothemassspectrometerviaanopensplit,where a flow of helium carried the H2 gas into the mass
spectrome-ter.
Toeverysamplewasaddedasetofco-injectionstandards (an-drostane,C26andC32n-alkanes)withknown
δ
Dvaluesthatwerechosen tobracketthepeaksofinterestinthechromatograms. All isotopic standards were obtained fromDr. Arndt Schimmelmann attheBiogeochemicalLaboratory,IndianaUniversity.Eachsample was run intriplicate andthestandard deviationwas usually less
than 5
h
.A set of15 n-alkaneswith knownδ
Dvalues (MixtureA or B) acquired from Indiana University were injected every 6 to 9 runs to ensure the accuracy of our data.Reported data are based onthe first elutingC34 botryococcene(Zhangetal., 2007)
andthe
δ
DvaluesarereportedwithreferencetotheVSMOW stan-dard.3.4. Datingandagemodels
Thesedimentsamplesusedinthispaperwere takenfromtwo sediment cores,one75 cm-long water–mud(WM) interfacecore, EJ7-MW1andone372 cm-longNesjecore.Becausetheupperpart oftheNesjecorewaslost,weanalyzedsedimentsfrombothcores andpresentresultsfromthecompositesedimentarysequence.
Theupperpartoftheinterfacecore(0–15 cm)wasdatedwith
210Pb (Table 1). 210Pb (46.5 keV) and 214Pb (295 and 352 keV)
were measured on dried sediments on a low-energy germanium detector(CanberraInstruments).Counterefficiencywas calibrated with sequential additions of known amounts of standard pitch-blend.Unsupported210Pbwascalculatedbysubtractingsupported
210Pb,whichisinequilibriumwith214Pb,fromtotal210Pb.A210Pb
chronology was constructed assuming constant rate of supply (CRS) and by relating the exponential 210Pb decay profiles with thecumulativedrymass–depthprofilesasdeterminedusingbulk
Table 2
RadiocarbonagesofElJuncoLakesediments. Depth
(cm)a
Coreb Labc 14Cage
(yr BP)d Std.dev. (±) δ 13C (h) Modernfraction Cal.age (yr A.D.)e Modeledage (yr BP)f 10.5 WM IN 75 25 −27.5 0.9906±0.0027 1706–1932 14 30.5 WM IN 250 25 −23.8 0.9695±0.0028 1642–1800 184 50.5 WM IN 400 25 −27.2 0.9514±0.0024 1456–1626 363 64.0 N AA 455 38 −28.8 0.9450±0.0045 1421–1622 466 70.5 WM IN 450 25 −26.2 0.9454±0.0027 1440–1613 492 84.0 N AA 707 43 −27.9 0.9157±0.0049 1278–1394 624 104.0 N AA 1171 40 −26.3 0.8643±0.0043 782–1016 979 124.0 N AA 1235 42 −26.5 0.8575±0.0042 715–976 1144 142.0 N AA 1420 40 −27.7 0.8379±0.0041 600–770 1321 164.0 N AA 1885 40 −25.4 0.7908±0.0039 77–323 1783 184.0 N AA 2283 42 −21.6 0.7526±0.0039 −392∼ −195 2244 204.0 N AA 2729 38 −26.8 0.7120±0.0034 −910∼ −790 2729 224.0 N AA 2820 42 −20.5 0.7040±0.0037 −1012∼ −790 2975 230.0 N AA 2949 55 −22.7 0.6927±0.0048 −1263∼ −912 3105 250.0 N AA 3652 50 −30.8 0.6347±0.0039 −2133∼ −1771 3840 270.0 N AA 3855 46 −29.2 0.6166±0.0035 −2457∼ −2045 4287 290.0 N AA 4679 47 −29.4 0.5585±0.0032 −3627∼ −3112 5324 310.0 N AA 5674 55 −30.1 0.4935±0.0034 −4583∼ −4340 6398 330.0 N AA 6491 45 −29.5 0.4457±0.0025 −5479∼ −5318 7349 350.0 N AA 7564 47 −22.7 0.3900±0.0023 −6453∼ −6253 8292 370.0 N AA 8162 49 −31.9 0.8162±0.0022 −7310∼ −6842 9029
a Acompositecoredepthwasadoptedforbothcores.
b N=Nesjepistoncore,WM=EJ7-MW1water–mudinterfacecore.
c AA=ArizonaAMSLaboratory,Tucson,AZ,USA;IN=INSTAAR,UniversityofColorado,Boulder,CO,USA. d 14Cagesofbulkorganicmaterial.
e Calibratedageranges(2σ)usingtheSouthernHemisphere2004calibrationcurve.
f Modeledages(2σ)wereconstructedusingOxCal4.0.1beta,withtheP_sequence modelandk=0.5 cm−1.Shownarethemidpointsofthemodeled2σ agerange.
Fig. 5. Age–depth relationshipof the El Junco Lake composite sedimentary se-quenceconstructedusingOxCal4.0.1betasoftware(Bronk Ramsey,2008),adopting theNorthernHemisphere2009calibrationcurveand theP_sequence modelwith
k=1 cm−1.Theagreementindicesofindividualdatesareindicatednext tothe
samplenames(toppanel).Alsoshownarethecomputedsedimentationrates (bot-tompanel).
densitymeasurements andusingaCRScomputermodel(Appleby and Oldfield, 1978). 210Pb does not provide direct dates sensus
stricto.Butifitisassumedthatthecoretopisofmodernageand aCRSoccurredoverthetimewindowcoveredbythesedimentary sequence,thenanagemodelcanbederivedfromtheunsupported
210Pbcalculation.
We selected 17 samples from the Nesje core and four sam-ples (10.5,30.5, 50.55 and70.5 cmintervals) fromthe WMcore forradiocarbon dating (Table 2). A total of 21sediment samples were dated atthe ArizonaAMS Laboratory,Tucson, AZ, USA and INSTAAR,UniversityofColorado,Boulder,CO,USA(Table 2,Fig. 5). We consider any reservoir effect that might influence the radio-carbonagesunlikelysince: (i)therearenocarbonaterocksinthe smallvolcaniccraterinwhichthelakesits,(ii)thelakeisshallow (6m)andwellmixed,and(iii)thelakeisunlikelytoreceive car-bonatefromseaspraysinceitisat670mabovesealevel,under astableatmosphericinversionmuchoftheyear,andclosetothe equatorwherestormsarerare.Ageuncertaintiesrangefromafew
years todecades atthe topof thecore, whichis basedon 210Pb
dating, to a few decades to centuries at the bottom of the core, whichisbasedonradiocarbondating(Tables 1,2).
Radiocarbon measurements indicate the presence of nuclear-bomb-test-derived 14C atcoretop,assumedto correspondto the early 1960s (Table 1). Overlapping radiocarbon dates were then used to connect the WM and the Nesje cores and build a com-positesedimentarysequence.Thiswasachievedbyconnectingthe 64-cmintervalintheNesjecoretothe70-cmintervalintheWM core, which gave the same radiocarbon ages within dating un-certainties (Table 2), suggesting that the composite sedimentary sequenceprovidesacontinuousrecordofsedimentaccumulation.
Tobuildthecompositeagemodel,wethenusedtheOxCal4.0.1 beta software (Bronk Ramsey, 2008) that incorporates both CRS modeled 210Pbagesandradiocarbondates ofbulk sedimentfrom theWMcoreandtheNesjecore(Tables 1,2;Fig. 5).Radiocarbon dateswerecalibratedusingtheSouthernHemisphere2004 calibra-tion curve(McCormacetal.,2004).The modeluseda P_sequence modelwithk
=
0.
5 cm−1.Sedimentages betweendatedsamples werelinearlyinterpolated.Thefinalagemodelwasthenbasedon amixtureof210Pbagesandradiocarbondatesfortthefirst70cm ofthecompositesedimentarysequence,andonradiocarbondates alonefordeepersedimentdepths(Fig. 5).Sedimentationrates var-iedfrom∼
0.02to∼
0.2 cm/yrfromearlytolateHolocene,sothat one sample (1 cm thick) integrates50 to 5 yearof precipitation in average (Fig. 5). The apparent change insedimentation rateis likelyduetocompaction,whichsqueezesadjacentsedimentlayers more closelytogether, expellingwater atgreater depth. We sub-sampledat5cm intervalsintheearlyandmid-Holocene,resulting inatimeresolutionof200to250yearsforthatperiod.4. Resultsanddiscussions
4.1. Precipitationanomaliesinferredfrombiomarkersand compound-specific
δ
Dvalues4.1.1. Botryococcusbraunii(Brace)ecologyandbotryococcenesas recordersoftropicalheavyrains
ElJuncosedimentscontainasuiteoflipidbiomarkersthatcan be traced back to specific organisms (Zhang et al., 2007, 2011, 2013, 2014).Theoccurrenceofalkadienes,botryococcenesand ly-copadienes in the water column and surface sediments indicate the co-existenceof all threeraces (A, B andL) ofthe green alga Botryococcusbraunii (Zhangetal.,2007).Butalkadienes(fromtheA race)occurinonlythetraceamountsinthesurfacesedimentand water column, and lycopadienes (from the L race) appear in the sedimentsdeposited since only460yearsago. Incontrast, botry-ococcenes,highlybranchedisoprenoidhydrocarbonsuniquetothe B race (Aaronson et al., 1983; Metzger et al., 1985), are present throughouttheHolocene,indicatingapredominanceoftheBrace. The concentrationsof botryococcenesvaried by 5orders of mag-nitude, from
<
1 to 16,700 μg/g, through the Holocene (Fig. 6a; dataare providedinthesupplementarytable),implyingtemporal changesintheenvironmentalconditionsmostfavorabletoB. brau-nii Brace.B.braunii occurs mostfrequentlyinoligotrophic lakesat tem-perateandtropicallatitudes(Aaronsonetal.,1983; Belcher,1968; KebedeandBelay,1994; Richerson etal., 1986; Townsend,2001; Wake and Hillen, 1980). The causesof B.braunii blooms are not well understood, particularlywhen differentraces areconcerned, since mostecologicalstudies havenotdifferentiated betweenthe A,BandLraces.OnegeneralconsensusisthattheBraceB.
brau-nii blooms often occur after heavy rain events. One example is
given inWake andHillen (1980) who documented the bloom of
B race B.braunii in the Darwin River Reservoir (DDR, Australia)
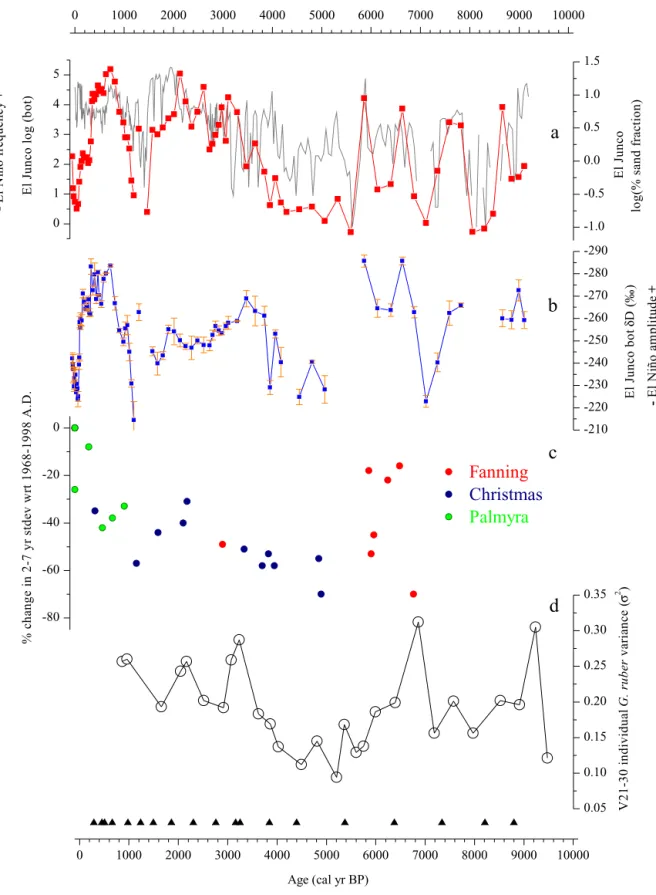
Fig. 6. Comparison ofbotryococceneconcentrationsandD/HratiosduringtheHolocenewithENSOproxyrecordsderivedfromtheEEP.(a)Botryococceneconcentrationin ElJuncoLakesediment(logscale,redcurve)andpercentageofsandfractioninthesamesedimentcore(logscale,greycurve;datafromConroyetal.,2008).(b)δDvalues ofbotryococceneinElJuncosediment.(c)ChangesinENSOvarianceasdeducedfromfossilcoralδ18OvaluesintheNorthernLineislands(datafromCobbetal.,2013). (d)Varianceofδ18Ovaluesofindividualplanktonicforaminifera(G.ruber)insedimentcoreV21–30fromtheGalápagosregion,aproxyforENSOvariance(Koutavasand Joanides,2012).(Forinterpretationofthereferencestocolorinthisfigurelegend,thereaderisreferredtothewebversionofthisarticle.)
littoralmargin, andwithoutfish (large-particle grazers)are more likely to support B.braunii blooms. The DDRis a stratified lake, havinganaveragedepthof6m(maximumdepthof25 m).In De-cember1974,shortlypriortotheappearanceofthebloom,heavy
rains associated witha cyclone causedthe reservoir to overflow, resultingin thedisappearanceofmullet andbarramundi. Follow-ing thecyclonethe algalnumbersgradually rose inthereservoir forthenext20months(WakeandHillen,1980).Anotherexample
Fig. 7. Comparison ofbotryococceneconcentrationsandD/HratiosduringthelastmillenniumwithreconstructedchangesinENSO.(a)SSTanomaliesintheNINO3.4region estimatedfromanetworkofproxiesinlocationssensitivetoENSO(Emile-Geayetal.,2013).Thethreecurvescorrespondtothethreeinstrumentalrecordsusedastarget datasetsforcomputingtheNINO3.4index.(b)BotryococceneconcentrationsinElJuncosediment(logscale).(c)δDvaluesofbotryococcenesinElJuncosediment.
isDebundshaLake,asmallcraterlakeintropicalWestCameroon. Thelakehaslowconductivityandpoorlittoraldevelopments ow-ing tothe very highannualrainfall of10 m. Whiledesmids and diatoms were commonly observed near the shoreline, B.braunii dominatedthephytoplanktonassemblage ofthe lake,mostlikely due to the muted influence of the shoreline area (Green et al., 1974).
El JuncoresemblestheDDRandDebundsha Lakeinmany re-spects.Allthreelakeshavesteeply slopingcatchments,small sur-faceareas,shallowwaterdepthsandnarrowlittoralzones(Fig. 1c). HeavyrainsinlakessuchastheDDR,DebundshaLakeandElJunco causewater to spill out over the rimof the catchment, flushing out nutrients and grazers. These conditions appear to be favor-ablefor theblooming of B.braunii. Heavyrains inthe Galápagos likelycausenutrientconcentrationstodropinElJuncoasthelake water is diluted by rainwater, the lake level reaches the height ofthe overflow channel (Conroyet al., 2008), the littoral margin shrinks, and grazing pressure diminishes. A likely contributor to thediminutionofnutrientsinElJuncoLakeduringElNiñoevents isthedeclineinguanodepositioninthecatchmentasseabird pop-ulations plummet (Steinitz-Kannan et al., 1998). Taken together, thesechangesinElJuncoLakeduringElNiñoeventsareexpected to favor blooms of B.braunii. Very low concentrations of botry-ococcenesweredetectedinsuspendedparticulatemattercollected in 2004(Zhang etal., 2007), a non-El Niño year, indicating that
B. braunii does notbloom during dryperiodssuch asthose
asso-ciated withLa Niñaevents,thedryseasonand/or withthegarúa season.
WemeasuredthehydrogenisotoperatiosoftheC34
botryococ-cene isomer that eluted first (Zhanget al., 2007) in order to be consistent down-core (Standard deviation
<
5h
). Data are pro-vided in supplementary table. Hydrogen isotope ratios of water in a closedbasin, likeEl Junco, are dictated by therelative rates of precipitationand evaporation,and theisotopic composition of precipitation,the latterofwhichisstronglyassociatedwith rain-fall ratesinthetropics(Dansgaard,1964;Kuritaetal., 2009; Risi et al., 2008). Using a modelof theisotope hydrology ofEl Junco LakeAtwoodandSachs (2014)showedthatthelakewaterδ
Dwas primarily controlled by rainfall rates during El Niño episodes,as opposedtoevaporationorwaterlossthroughseepageoroverflow. Since hydrogen isotope ratios (D/H) in botryococcenes track wa-terδ
Dvalueswithnearperfection, withan offsetdueto isotope fractionation during lipid biosynthesis (Zhang and Sachs, 2007; Zhang et al., 2009), changes in rainfall amount are imprinted in the isotopic composition of botryococcenes, with negative (posi-tive)δ
Dvaluesco-occurringwithwetter(drier)periods.4.1.2. Proofofconcept:botryococceneconcentrationsand
δ
Dvalues duringthelastmillenniumIn Fig. 7 we compare the botryococcene concentrations and
δ
D values (Figs. 7b, c) in El Junco Lake to SST anomalies in the NINO3.4 region ofthe EEP reconstructed from climateproxy records withannualresolution, such ascorals,tree ringsandicecores (Fig. 7a) (Emile-Geay et al., 2013). Increasing NINO3.4 SST anomalies 1100–1300 AD, followed by a plateau from 1300 to 1600 AD, and a sharp decrease 1600–1800 AD, are observed in thebotryococceneconcentrationand
δ
Drecords.Thelasttwo cen-turiesdiverge inthetwodatasets,astheNINO3.4 reconstruction suggests a sharp increase in SST from 1800 to 2000 AD, while the botryococcene records from El Junco imply only a moderate increaseinElNiñooccurrencesoverthelastcentury,andno indi-cationoftheveryhighENSOvarianceimpliedbythemostrecent values of the coral-based NINO 3.4 record (Fig. 7; Cobb et al., 2013).Two factors can be invoked to explain such a mismatch be-tween the El Junco record and the NINO3.4 SST reconstruction from Emile-Geay et al. (2013) over the last century. First, it is worthmentioningatthisstagethata distinctionshouldbemade between the eastern Pacific El Niño events and the central Pa-cific El Niño events.While the SST reconstruction of Emile-Geay etal. (2013)would be sensitive toboth types ofEl Niñoevents, theprecipitation anomalies atEl Junco, whichis situatedfarther east,wouldbemutedwhen centralPacific ElNiñooccurs(Ashok etal.,2007).ArecentattempttoreconstructcentralPacificElNiño eventsusingmonthlySSTdatasetsback to1880AD suggeststhat the probability that a given year was a central Pacific El Niño year has increased over the past century (Pascolini-Campbell et al., 2014). Such a result may at least partly explain why ENSO appears more dominant in the central equatorial Pacific than in the eastern equatorial Pacific over the second half of the twen-tieth century.Secondly, changes in the mean state of the Pacific over the last
∼
250 years could have modified the El Niño tele-connectiontoEl Juncoina waythat isdifficulttoassess. Model-data comparisons suggest that the spatial teleconnectionpattern ofclimatic anomalies associated withEl Niño eventscan change whendifferentclimaticbackgroundsoccurinresponsetochanges in orbital geometry and the flux of freshwater to the North At-lanticfromremnanticesheets(Braconnotetal.,2012).Whetheror notclimaticforcingsoverthe lastmillennium modifiedthe ENSO teleconnectionpatterns,theabove-mentionedfactorswarrant cau-tionwheninterpretingrelationshipsbetweenproxyrecordsonthe basis of relationships established betweenthose proxies and the modernclimate(Braconnotetal.,2012).4.1.3. TemporalchangesinbotryococceneconcentrationsandtheirD/H signatureovertheHolocene
Based on the ecologicalniche likely occupied by Botryococcus
braunii,AtwoodandSachs (2014)propose that botryococcene
δ
Dvaluesreflect thelake
δ
Dvaluesinheritedfromtheδ
Dofrainfall duringEl Niñoevents.Oligotrophic conditionssuitable toB.brau-nii bloomsbeingobservedonlyduringmoderatetostrongElNiño
eventsinElJuncoLake,largeshiftsinthesedimentary concentra-tionofbotryococcenesmayresultfromchangesintheoccurrence ofmoderateto strong El Niñoevents.Under such circumstances, ourrecord differs fromother proxyreconstructionsof ENSO that integratebothElNiñoandLaNiñaevents(e.g.Leducetal.,2009a; KoutavasandJoanides,2012; Emile-Geayetal., 2013).The associ-ation of B.braunii blooms with El Niño conditions hence makes botryococcenes an excellent biomarker for sampling the warm phasesofENSO.Inaddition,itisexpectedthat
δ
Dvaluesof botry-ococcenewill decline when precipitation rates increase, possibly providingametricfortheseverityofextremerainfalleventsthat are associated with El Niño events (Atwood and Sachs, 2014). This hypothesis is corroborated by the 13-year-long monthlyδ
D record of precipitation from Bellavista (Fig. 3). During strong El Niñoevents suchasthe1997–1998 ElNiño, precipitationδ
D de-creasedbyup to60h
,while duringmoderate(as in2002–2003) andweak(asin2004–2005and2006–2007)ElNiñosprecipitationδ
Ddecreasedbyonly∼
30h
and∼
10–20h
,respectively(Fig. 3).Botryococceneconcentrationsspannedfiveordersofmagnitude during theHolocene(Fig. 8a), whilebotryococcene
δ
Dvalues var-ied from−
286 to−
214h
(Fig. 8b). Interestingly,low botryococ-ceneδ
Dvaluescoincidedwithhighbotryococceneconcentrations (Fig. 8a, b). If El Niño rains are the exclusive driver of the El Junco Lake trophic alterations favorable to B.braunii blooms,we anticipatethat changes in El Niñofrequencywill be recordedby sedimentaryconcentrationsofbotryococcenes,whichwillincrease whenoccurrencesofElNiñoeventsincrease.Conversely,sincetheδ
D values ofbotryococcene capture theδ
D valuesof rainfall oc-curring during El Niño events (Fig. 3; Atwood andSachs, 2014), weattributechangesinbotryococceneδ
Dvaluestochangesinthe severityofEl Niñoevents.Byextension, weproposethat by pair-ing theconcentration ofbotryococcenes withtheir D/H composi-tion,twostrictlyindependentparameters,itispossibleto qualita-tively reconstructboth thefrequency(concentration)andseverity (δ
Dvalues)of ElNiñoeventsduring theHolocene. We hence in-terpretthecoincidenceoflowbotryococceneδ
Dvalues(whichwe attribute toperiods ofincreasedintensity ofEl Niñoevents)with highbotryococceneconcentrations(which weattributetoperiods ofincreasedfrequency ofElNiñoevents)asindicatingatight cou-pling between the frequency and the amplitude of El Niño wet periodsduringtheHolocene(Fig. 8a,b).High-amplitude fluctuations of botryococcene concentrations and
δ
D valuescharacterize the period from9200 to 5600yr BP, implying large fluctuations in El Niño occurrences at the multi-centennial time scale during the early Holocene(Fig. 8a, b). The mid-Holocene (5600 to3500yr BP) ischaracterized by low con-centrationsandhighδ
Dvaluesofbotryococcenes,implyinga pro-longed period of substantially reduced precipitation that we at-tribute to infrequent andweak El Niño events (Fig. 8a, b). From 5600to5200 yr BPandfrom4400to4200 yr BPthe botryococ-ceneconcentrationsweresolowthatisotopemeasurementscould not be made, signaling very infrequent El Niño events.A transi-tion tohigh concentrationsandlowδ
D valuesofbotryococcenes 4000–3500 yrBPimplieshighrainfallratesandlakelevelsthat in-dicatethere-emergenceofstrongandfrequentElNiños.Such con-ditionspersisteduntil∼
2000 yrBP,afterwhichsubstantialdrying andweakElNiñosareinferredfromahundred-folddropin botry-ococceneconcentrationsover thenext 500years andthehighestδ
Dvaluesoftheentirerecord∼
1200 yrBP(Fig. 8a,b).The subse-quentreturnofstrongandfrequentElNiñoevents1000–600 yrBP issupportedbyalargeincreaseintheconcentrationanddecrease intheδ
Dvalueofbotryococcenes.Such conditionspersisteduntil∼
200 yrBP(∼
1750 A.D.)whenatransitiontoaridconditions oc-curred thatlasteduntil thelatterhalfof the20th century(Sachs etal.,2009).Conroyetal. (2008) interpretedgrain sizechangesofEl Junco sedimentsintermsofrainfallvariations associatedwithboththe meanclimate stateandENSO. Changesin thecoarse (sand) frac-tionofsediment,thoughttobe sensitivetostrongerosionevents causedbyheavyprecipitationduringElNiñoevents,fluctuate syn-chronously withbotryococcene concentrations (Fig. 6a), andto a lesser extent with botryococcene
δ
D values (Fig. 6b). Such simi-larpatternsof changebetweenthesandfractionof sediment,its botryococcene concentrations, and theirδ
D values, lend support tothe notionthat theyall resultfromthesameforcing. We pro-posethemostparsimoniousforcingisheavyrainsassociatedwith strong and/or frequent El Niñoevents. Thisfurther suggeststhat periodsoffrequentElNiñoeventscoincidedwithperiodsofstrong ElNiñoevents(Fig. 6a,b).Ideally,ENSOreconstructionswouldbebasedonarchiveswith sub-annualresolutionfromlocationswherethe inter-annual vari-abilityofhydrologyishighlyandpredominantlysensitivetoENSO. Coral
δ
18Orecordsfromthecentral tropicalPacific,whenstacked togethercomeclosetothisideal(Cobbetal.,2003, 2013).Acom-Fig. 8. Holocene paleoclimaterecordsfromENSO-sensitiveregions. (a)BotryococceneconcentrationsinEl Juncosediment.(b)δDvaluesofbotryococcenesinElJunco sediment.14CagecontrolpointsfortheElJuncocoresareindicatedbytrianglesonthebottomx-axis.Periodsofhighprecipitationareindicatedbyyellowbars,withthe
additionofthelasttwocenturieswhenENSOlikelyincreasedwithoutanydistinguishablesignalatElJunco(seetextfordetaileddiscussion).(c)CariacoBasinsediment reflectance,aproxyforproductivityandupwellingassociatedwithmigrationsoftheITCZ(Petersonetal.,2000).(d)Mg/Ca-derivedSSTswestofBajaCalifornia(Marchitto etal.,2010).(e)Probabilitydensityfunctions(PDFs)ofdroughtoccurrencesintheCentralGreatPlainsofNorthAmericaasdeducedfromeoliansandandloessdeposits (Miaoetal.,2007).PDFswerecomputedusingindividualdatesandtheirassociateduncertaintiespublishedinMiaoetal. (2007),assumingthataGaussiandistributionof probabilityappliestoeachdate.Theprobabilitiesassociatedwitheachdatewerecalculatedandbetweenthosedatesisinterpolatedevery10yearsthroughtheHolocene period.Probabilitiesateachtimestepwerethensummedforthefulldataset.PDFsbeforeandafter2kyrBPareplottedondifferentscales,withthe2–10kyrBPinterval scaledbyafactoroffour.(f)Solarirradiancevariabilityasestimatedbycosmogenicnuclide(10Be)fluxesinGreenlandice(Vonmoosetal.,2006),usingthefilteringprocedure
parison of coral
δ
18O records from Cobb et al. (2013) from thelast 7 ka (Fig. 6c) with the El Junco Lake records implies that the latter capture the most prominent features of ENSO activity eventhoughthesediment layersfromwhichtheywere extracted weredepositedoveryearstodecades(compareFig. 6a,bwithc). Thenear-absenceofbotryococcenesbetween5600and3500yrBP coincides witha time of very low inter-annual variability in the coral records (Cobb et al., 2013; McGregor et al., 2013; Fig. 6). Onthe other hand, highENSO variance
∼
7 ka recorded by the oldestcorals correspondtoperiods whenElNiño, asrecordedby botryococceneconcentrations andδ
D values, were comparatively frequent.Changes in ENSO activity have also been recently estimated fromthe varianceof
δ
18O valuesinindividual planktonicforami-niferafromamarinesedimentcoreeastoftheGalápagos(Koutavas andJoanides,2012). The early, middleandlate Holocene succes-sionof intermediate, low and highENSO activity, respectively, is recordedinbothEl Juncoproxiesandthemarine record (Fig. 6a, b,d). This suggests that both the concentration and
δ
D value of botryococcenes in El Junco sediment capture the low frequency (multi-millennial)variationsinENSOduringtheHolocene. 4.2.CoincidentchangesinGalápagosrainfall,BajaCaliforniaSST,and CariacoBasinupwellingduringtheHoloceneThe precipitation anomalies inferred from botryococcene con-centrations and
δ
D values (Figs. 8a, b) in El Junco ultimately depend on SST anomalies in the eastern equatorial Pacific (EEP) throughocean–atmosphereinteractions (Guetal., 2005; Koutavas andJoanides,2012).DuringElNiño,positiveSSTanomaliesinthe EEPcauseincreasedwindconvergencethatdrivesintense convec-tionintheoverlyingatmosphere,resultinginpositiveprecipitation anomalies(Koutavas andJoanides,2012; Rasmussonand Carpen-ter, 1982). These conditions induce atmospheric changes around the globe. The varying modes of ENSO activity we infer from El Junco lake sediments ought therefore to be evident in paleocli-materecordsfromlocationswithclearconnectionstotheEEP.One suchlocationisthewesterntropicalNorthAtlantic,whereElNiño eventsareassociatedwithanincreaseinthestrengthofthe east-erlytrade winds(Latif andGrötzner, 2000). Located inthe heart of the western tropical Atlantic, the Cariaco Basin off the coast ofVenezuelaishighly sensitivetotheseENSO-relatedtradewind anomalies (Peterson et al., 2000) (Fig. 1a). Increased zonal wind strengthduring El Niñoenhancescoastal upwellingthere, result-ingingreaterprimaryproductivity(Tayloretal.,2012).Periodsof higherElNiñoamplitudeand/orfrequencyarethereforeexpected tobecharacterizedbygreaterrainfallintheGalápagosandhigher productivityintheCariacoBasin.Weobservesucharelationshipin theHolocenesedimentary recordsfromthetwo locations, where sedimentreflectanceintheCariacoBasin,aproxyforproductivity (lowerreflectancereflectsgreaterorganicmatterinthesediment) (Petersonetal., 2000), sharesomeof themostprominentmodes ofvariabilitywithbotryococceneconcentrationsandδ
Dvaluesin ElJuncoLakeonthemulti-millennialtomulti-centennialtimescale (Fig. 8a,b,c).Changesintheannualcycleofinsolationmayinduce changes in wind and rain that can potentially obscure the sedimentary signal associated with ENSO in both the Galápagos and Cariaco Basin. It is therefore important to consider whether changes in seasonality can explain changes in El Junco rainfall and Cariaco productivity.WedothisbyexaminingaHoloceneSSTrecordfrom thenortheasterntropicalPacificwherewarmSSTsoccurduringEl Niñoevents andboreal summers (Figs. 3, 4). The Mg/Ca-derived SSTrecord nearBajaCalifornia ischaracterizedby alternating ex-tremesof
±
2◦ClastingseveralcenturiesduringtheearlyHolocene, followed by a relatively colder and less variable period duringthemid-Holocene,andrelativelywarm conditionsduringthelate Holocene (Marchitto et al., 2010) (Fig. 8d). This pattern of SST changesismirroredinthepatternofrainfallchangesinferredfrom El Junco, whichwas intermittentlyvery wetandvery dryduring the early Holocene, dry during the mid-Holocene and primarily wet during thelate Holocene(Fig. 8d). Since the boreal summer seasonisassociatedwithwarmSSTsnearBajaCalifornia andlow rainfall in the Galápagos, while the opposite relationship is ob-served inthesediment record (i.e.warm BajaSSTscoincide with wet conditionsat El Junco), we rule out seasonality as the first-ordercauseofchangesinthetworecords.Insteadweproposethat climatic teleconnections associated with ENSO caused coincident changesinGalápagosrainfall,BajaCaliforniaSST,andCariacoBasin upwellingduringtheHolocene,asthecomparisonofElJuncoand thetropicalPacificcoralssuggests(Fig. 6).
4.3. SynchronizedvariationsofElNiñoandLaNiñaduringthe Holocene?
Because changes in ENSO also depend on the amplitude and frequency of La Niña events,co-variation of ENSO activity proxy records, such as coral and individual foraminifera
δ
18O variance, withthe El Niñoproxy recordsfrom botryococcenesin El Junco, should not necessarily be expected. While mostof the dynamic rangeinprecipitationintheGalápagosresultsfromElNiñorains, andnosedimentaryarchivesfromtheEEP areprimarilysensitive toLaNiñaconditions(thelatterbeingbestdescribedasa height-enednormalstate oftheEEP), intense droughtconditionsonthe GreatPlainsofNorthAmericaarelinkedtofrequentandstrongLa Niña events (Trenberth andGuillemot, 1996). A Holocenerecord of Great Plains drought, and by extension La Niña, can be de-rivedfromwell-datedsandandloess deposits(Miaoetal., 2007). Wecomputedtheprobabilitydensityfunctions(PDF)ofHolocene dry episodes from a databaseof sediment cores from the Great Plains (Fig. 8e). High values of the PDFs indicate periods when dryconditionslinkedtorecurrentandsevereLaNiñaeventswere common.CentralGreatPlainsdryperiodsoccurredwhenever wet-terconditionsareinferredfromElJuncosedimentsthroughoutthe Holocene(Fig. 8a,c,e), indicatingthat periodsofstrong and fre-quentEl Niñoeventswere alsoperiodsoffrequentandstrongLa Niña events.Anabsence ofdroughts onthe CentralPlains(weak LaNiña)between2and1kyrBPwasfollowedbyasharpincrease indroughts(strongLaNiña)(Fig. 8e),mirroringthepatternof pre-cipitationintheGalápagos,whichwasdryfrom2to1kyrBPand verywetbetween1and0.5kyrBP(Fig. 7a,b).TheamplitudeandfrequencyofCentralGreatPlainsdryevents prior to 2 kyr BP appears much lower than during the late Holocene(Fig. 7e; PDFsbefore andafter2 kyrBP are plottedon differentscales).We cannot determinewhetherthe low PDF val-uespriorto2kyrBParetheresultoflesssevereandfrequentLa Niñaeventsornon-linearityinthe proxy,thoughwe suspect the latter. These dataconsist of dates on aeolian sand andloess de-positsthatareerosionalfeaturesofthesurroundinglandscape.As withexposureagesfromcosmogenicisotopes usedtoreconstruct glacieradvances, thisproxysuffers fromthefact that, overtime, erosionerasesgeomorphologicalfeatures.Thus,olderdepositsthat mayhavebeenprominentandnumerousaremuchlessprominent, orevenobliterated,overthousandsofyears.Forthisreasonwedo notattempttousetheamplitude ofNebraskadroughtvariationsin our climateinterpretation, butonly the timing of maximain the PDFs.Similartimingofthosemaxima(Fig. 8e)withthetiming of botryococceneconcentration maximainEl Junco(Fig. 8a)implies that periodsoffrequentandstrongElNiñoscoincided with peri-odsoffrequentandstrongLaNiñasthroughouttheHolocene.
4.4. EvolutionofENSOduringtheHoloceneandpossibledrivingforces A synthesis of our Galápagos precipitation record with pe-riods of drought in the Great Plains and SST in the northeast tropicalPacific indicates that theearly, middleandlate Holocene werecharacterized bydifferentmodesofENSO activity.Theearly Holocene(9200–5600 yrBP)wascharacterizedbyaseriesofrapid changesbetweenperiodsofstrongandweakENSOactivityatthe multi-centennial time scale. This contradicts several studies that reportedlittleorno ENSOactivityatthattime(Moyetal.,2002; Sandweiss et al., 1996). The mid-Holocene (5500–3800 yr BP) was dominated by significantly reduced ENSO activity. The late Holocenewas characterizedby frequentandstrongENSOactivity, with the exception of the 1500–1000 yr BP time interval, when ENSOwassubstantiallyreduced.
Anincrease in theamplitude and/or frequencyof ENSO activ-ityfrom themid- to the late Holocenehas been documented in a multitude of studies. The first-order forcing is thought to be thelong-termchangesintheEarth’sorbitthatredistributes solar energy. Virtually all climate models forced by changes in orbital parameters convergetoward an orbitally-forcedincrease inENSO activity (see e.g. Clement et al., 1999; Emile-Geay et al., 2007; Zhenget al., 2008; Salauetal., 2012; Braconnotet al., 2012and references therein). Orbital parameters during the mid-Holocene ledtoanincreaseinsolarheatingattheequatorduringtheboreal summer.Thezonaltemperatureresponsetosuchheatingis, how-ever, not uniform, and produces an increased zonalSST gradient thatstrengthenstheWalkercirculationthroughocean–atmosphere interactionsalsoknownastheBjerknesfeedback(seee.g.Clement et al., 2000). Most models forced by orbital parameters produce a monotonic increase in the strength of ENSO in response to Holocenechangesinorbitalforcing. Yetnoneofthemproducesa HoloceneENSOtimeseriessimilartoanyoftheproxyrecords dis-playedinFigs. 6 and8.Takentogether,thehighsensitivityofENSO toorbitalprecessionintransientclimatesimulations,coupledwith their inability to produce multi-centennial changes in ENSO im-pliesthatcertainaspectsoftheunderlyingclimatephysicsarenot adequatelyrepresentedinthosemodels.
WhilechangesinENSOonthemulti-millennialtimescale have been described in the literature, multi-centennial variability has garnered less attention. It hasalready been suggested that solar activity can lead to changes inENSO activity (e.g.Emile-Geay et al.,2007).Co-variationsbetweenSSTsnearBajaCaliforniaand re-constructionsofsolaractivityoverthelast12kyr(Vonmoosetal., 2006) suggested thatmulti-century solarminimawereassociated withEl Niño-likeconditionsduringtheearlyHolocene(Marchitto etal.,2010).We,too,finda visualcorrespondencebetweensolar activity and ENSO during the Holocene, even though the poorly resolved early Holocene time period and the age model uncer-taintiescomplicatetheassignment ofmulti-centennialchangesin ENSOtothosereflectedinsolaractivityproxies.Broadlyspeaking, multi-centennialchangesinclimateproxiessensitivetoENSO sug-gestthathighsolaractivity(Fig. 8f)coincidedwithbothincreased El NiñoandLa Niñaoccurrences(e.g.,compareFig. 8aandetof).
It is clear that not all proxyrecords shown in Fig. 8 co-vary onthemulti-centennialtimescalefortheentiretyoftheHolocene. One cause for disagreement between certain proxies at certain timesmaystem fromagemodel uncertainties andsampling res-olution. Another is the differing nature of each type of proxy, withvarying contributionsfrombiological, chemical andphysical “noise”intheinferredclimatesignal.Athirdpossibilityisthatthe strengthandcharacterofENSOteleconnectionsmayhavechanged over time in response to stochastic and other climate forcings. Marchittoetal. (2010)reportedthatthecorrespondencebetween theSSTatBajaCaliforniaandthesolaractivitywasalteredduring the early Holocene in response to the “8.2-ka event”.
Consider-ing the above-mentioned sources ofuncertainty we refrainfrom interpreting disparities in the proxy records, particularly at the centennial timescale. We argue instead that features common to multiple recordsduring the early, midandlate Holocene(Figs. 7 and8) are bestexplained bythe changingsensitivity ofENSO to solarandorbitalforcingsduringtheHolocene.
During the instrumental period, an association is observed between the 11-yr solar cycle and ENSO (Meehl et al., 2009; Meehl and Arblaster, 2009; van Loon and Meehl, 2011). At the onset of the sunspot maximum, SSTsand rainfall inthe EEP are anomalously low, asduring La Niña. They are anomalously high two years later, asduring El Niño. Furthermore,NINO3.4 SST es-timates from Emile-Geay et al. (2013)imply an anti-phasing be-tween EEP SSTs and solar activity at the centennial timescale, suggesting that longer term changes in solar activity trigger an equatorialresponseanalogoustothe“ocean thermostat”feedback (Emile-Geay etal., 2013). Avisual correspondence between peri-ods of increasedsolar activity (Fig. 8f) and of both El Niñoand La Niña activity (Fig. 8a, b,d ande) supports the existence of a linkbetweenENSOandsolaractivityonmillennialtimescales.
Small changes in Total Solar Irradiance (TSI) can be associ-ated with large changes in ultraviolet (UV) radiation, such that a 0.1% increase in TSI during sunspot maxima coincides with a
∼
6%increaseinsolarUV (Hood,2004).ThehigherUV warmsthe stratospheredirectlyandstimulatesozoneproductionthatfurther absorbs UV light and intensifiesthe initial warming, particularly in the tropicswhere sunlightis mostintense. Vertical motionin the tropical troposphere increases in response, which intensifies the ascending limb of the Hadley cell andproduces greater pre-cipitation in the ITCZ (Haigh, 1996; Hood and Soukharev, 2012; Meehl et al., 2009; van Loon andMeehl, 2011). In addition, the HadleycellbroadensandtheWalkercirculationintensifies, resem-bling Pacific climateanomalies during La Niña events (Hoodand Soukharev, 2012; Meehletal.,2009; vanLoonandMeehl, 2011). AseconddynamicalmechanismbywhichsmallchangesinTSIcan cause changes in ENSO involves greater heating of the clear-sky subtropics during solarmaxima,promotingincreasedevaporation (Meehletal.,2009).Moisture thusderivedistransportedbytrade winds to the ITCZ where it fuels intensification of the Hadley andWalkercirculations,againresultinginLaNiña-likeconditions (Meehletal.,2009).Togetherthesetwodynamicalresponses rep-resent apositivefeedbackatsolarmaximadrivingtropicalPacific temperatureandrainfallpatternsintoanincreasinglyLaNiña-like state. Eventually,eastward-propagating Kelvinwavesarespawned that transition the system back toward El Niño-like conditions (Meehl andArblaster, 2009). Evidence that ENSO variability was enhanced during the relatively stronger 1979–1993 solar cycles comparedtothesubsequentweakersolarcyclesthatoccurred dur-ing the1994–2009periodsupportsacausallinkbetweenTSIand thetropicalPacificclimate(HoodandSoukharev,2012).Modeling studies ofspectralsolarirradiancesuggest thatUV radiationmay have been asmuch as 50% lower during extended solar minima such as the Maunder minimum,∼
1650–1700 A.D. (Krivova and Solanki, 2005). The possibilitythus exists fora large response of the tropical climateto relatively modestchanges inTSI. We pro-posethatthesamedynamical responsestomulti-century periods ofhighsolaractivitywouldcausethecoupledincreasesinElNiño andLaNiñaactivityinferredfromtheGalápagosandGreatPlains records.5. Conclusions
We presenteda continuous 9200-year record ofrainfall varia-tions fromthe only permanentfreshwater lakein the Galápagos Islands. Changes inthe concentration and hydrogenisotope ratio oflipids producedby thegreenalgaBotryococcusbraunii (Brace),
whichbloomsduring ElNiñorainsintheGalápagos,indicatethat theearlyHolocene(9200–5600yrBP) wascharacterizedby alter-natingextremesintheintensityand/orfrequencyofElNiñoevents thatlastedacenturyormore.OurdatafromthecoreoftheENSO regionthus refutesearlierstudiesthat reporteda lackofEl Niño events in the early Holocene. The mid-Holocene (5600–3500 yr BP)was atime ofconsistentlyweakEl Niñoactivity,aswere the EarlyMiddleAges(
∼
1000–1500 yrBP)andthe19th-to-mid-20th centuries.ElNiñoeventstrengthandfrequencywere moderateto highduringtheremainderofthelast3500years.Empirical evidence from a diverse set of continuous paleocli-materecordsmakeclearthattheENSOmodeofclimatevariability persisted throughout the last 9200 years, except for the period fromabout5500–3800 yr BP,when ENSO was weak or inopera-tive. Synchronous changes in Galápagos rainfall extremes and in the occurrence of US Great Plains drought with cosmogenic nu-clideproductionsupports alink betweensolar activityandENSO throughoutmostof theHolocene. These observations canbe ex-ploitedtoimprovemodelsbeingusedtopredictchangesinENSO caused by anthropogenic climate forcing. Indeed, based on the Holoceneevolution of ENSO, we propose it is likely that the fu-tureintensityandfrequencyof bothEl NiñoandLaNiñawill be atleastpartlymodulatedbynaturalvariationsinsolaractivity.
Acknowledgements
This work is supported by the U.S. National Science Founda-tion underGrants ESH-0639640 (J.S.) andEAR-0823503 (J.S.); by the Comer Science and Education Foundation (J.S.), and by the ChineseNationalScience Foundation undergrant41273086 (Z.Z). We thankRienk Smittenberg, Paul Colinvaux, Jonathan Overpeck, Miriam Steinitz-Kannan and Jessica Conroy for assistance in the field, and to the Galápagos National Park and the Charles Dar-win Foundation for their assistance with fieldworkand fortheir permissiontowork onElJuncoLake.Wearegratefultothe con-structive reviews from two anonymous reviewers, and to Birgit Schneiderfordiscussionsonanearlierversion.
Appendix A. Supplementarymaterial
Supplementarymaterialrelatedtothisarticlecanbefound on-lineathttp://dx.doi.org/10.1016/j.epsl.2014.07.013.
References
Aaronson,S.,Berner,T.,Gold,K.,Kushner,L.,Patni,N.J.,Repak,A.,Rubin,D.,1983. Someobservationsonthegreenplanktonicalga,Botryococcusbraunii andits bloomform.J.PlanktonRes. 5,693–700.
Appleby,P.G.,Oldfield,F.,1978.Thecalculationoflead-210datesassuminga con-stantrateofsupplyofunsupported210Pbtothesediment.Catena 5,1–8.
Ashok,K.,Behera,S.K., Rao,S.A.,Weng,H.,Yamagata,T., 2007. ElNiño Modoki anditspossibleteleconnection.J.Geophys.Res. 112,C11007.http://dx.doi.org/ 10.1029/2006JC003798.
Atwood,A.R.,Sachs,J.P.,2014.SeparatingITCZ- andENSO-relatedrainfallchanges in the Galápagos over the last 3 kyr using D/H ratios of multiple lipid biomarkers. Earth Planet. Sci. Lett. 404, 408–419. http://dx.doi.org/10.1016/ j.epsl.2014.07.038.
Belcher,J.H.,1968.NotesonthephysiologyofBotryococcusbraunii Kützing.Arch. Microbiol. 61,335–346.
Braconnot,P.,Luan,Y.,Brewer,S.,Zheng,W.,2012.ImpactofEarth’sorbitand fresh-waterfluxesonHoloceneclimatemeanseasonalcycleandENSOcharacteristics. Clim.Dyn. 38,1081–1092.
BronkRamsey, C., 2008.Deposition modelsfor chronological records. Quat. Sci. Rev. 27,42–60.
Clement,A.C.,Seager,R.,Cane,M.A.,1999.OrbitalcontrolonElNiño/Southern Os-cillationandthetropicalclimate.Paleoceanography 14,441–456.
Clement,A.C.,Seager,R.,Cane,M.A.,2000.SuppressionofElNiñoduringthe mid-Holocenebychangesintheearth’sorbit.Paleoceanography 15,731–737. Cobb,K.M.,Charles,C.D.,Cheng,H.,Edwards,R.L.,2003.ElNiño-SouthernOscillation
andtropicalPacificclimateduringthelastmillennium.Nature 424,271–276.
Cobb,K.M.,Westphal,N.,Sayani,H.R.,Watson,J.T.,Lorenzo,E.D.,Cheng,H.,Edwards, R.L.,Charles,C.D.,2013.HighlyvariableElNiño-SouthernOscillationthroughout theHolocene.Science 339,67–70.
Colinvaux,P.A.,1972.ClimateandtheGalápagosIslands.Nature 240,17–20. Collins,M.,etal.,2010.TheimpactofglobalwarmingonthetropicalPacificandEl
Niño.Nat.Geosci. 3,391–397.
Conroy, J.L., Overpeck, J.T., Cole, J.E., Shanahan, T.M., Steinitz-Kannan,M., 2008. HolocenechangesineasterntropicalPacificclimateinferredfromaGalápagos lakesedimentrecord.Quat.Sci.Rev. 27,1166–1180.
Dansgaard,W.,1964.Stableisotopesinprecipitation.Tellus 16,436–468. DiNezio,P.N.,Clement,A.C.,Vecchi,G.A.,Soden,B.J.,Kirtman,B.P.,Lee,S.-K.,2009.
Climateresponse ofthe equatorial Pacific toglobalwarming. J.Climate 22, 4873–4892.
Emile-Geay,J.,Cane,M.,Seager,R.,Kaplan,A.,Almasi,P.,2007.ElNiñoasa me-diatorofthesolarinfluenceonclimate.Paleoceanography 22.http://dx.doi.org/ 10.1029/2006PA001304.
Emile-Geay,J., Cobb,K.M.,Mann,M.E.,Wittenberg,A.T.,2013.Estimatingcentral equatorialPacificSSTvariabilityoverthepastmillennium.PartII: Reconstruc-tionsandimplications.J.Climate 26,2329–2352.
Green,J.,Corbet,S.A.,Betney,E.,1974.EcologicalstudiesoncraterlakesinWest Cameroon,DebundshaLake.J.Zool.(Lond.) 173,199–223.
Gu,G.J.,Adler, R.F.,Sobel,A.H.,2005.The EasternPacificITCZ duringtheboreal spring.J.Atmos.Sci. 62,1157–1174.
Haigh,J.D.,1996.Theimpactofsolarvariabilityonclimate.Science 272,981–984. Hood,L.L.,2004.SolarvariabilityanditseffectontheEarth’satmosphericand
cli-matesystem.AGU,Washington,DC,pp. 283–303.
Hood, L.L., Soukharev,B.E., 2012. Thelower-stratospheric response to11-yr so-lar forcing: coupling to the troposphere–ocean response. J. Atmos. Sci. 69, 1841–1864.
Kebede,E.,Belay, A.,1994.Speciescompositionandphytoplanktonbiomassina tropicalAfricanlake(LakeAwassa,Ethiopia).Hydrobiologia 288,13–32. Kessler,W.S.,2006.ThecirculationoftheeasterntropicalPacific:areview.Prog.
Oceanogr. 69,181–217.
Koutavas, A., Joanides, S., 2012. El Niño-Southern Oscillation extrema in the Holocene and Last GlacialMaximum.Paleoceanography 27. http://dx.doi.org/ 10.1029/2012PA002378.
Krivova,N.A.,Solanki,S.K.,2005.ReconstructionofSolarUVirradiance.Adv.Space Res. 35,361–364.
Kurita,N.,Ichiyanagi,K.,Matsumoto,J., Yamanaka,M.D., Ohata,T.,2009.The re-lationshipbetweentheisotopiccontentofprecipitationandtheprecipitation amountintropicalregions.J.Geochem.Explor. 102,113–122.
Latif,M.,Grötzner,A.,2000.TheequatorialAtlanticoscillationanditsresponseto ENSO.Clim.Dyn. 16,213–218.
Leduc, G.,Vidal, L., Cartapanis,O., Bard, E.,2009a. Modes ofEasternEquatorial Pacificthermoclinevariability:implications forENSO dynamicsover thelast glacialperiod.Paleoceanography 24.http://dx.doi.org/10.1029/2008PA1701. Leduc,G.,Vidal,L.,Tachikawa,K.,Bard,E.,2009b.ITCZratherthanENSOsignature
forabruptclimatechangesacrossthetropicalPacific?Quat.Res. 72,123–131. Liu,W.T.,Xie,X.,2002.Doubleintertropicalconvergencezones—anewlookusing
scatterometer.Geophys.Res.Lett. 29.http://dx.doi.org/10.1029/2002GL015431. Locarnini,R.A.,Mishonov,A.V.,Antonov,J.I.,Boyer,T.P.,Garcia,H.E.,Baranova,O.K.,
Zweng,M.M.,Johnson,D.R.,2010.WorldOceanAtlas2009,Vol. 1:Temperature. In:Levitus,S.(Ed.),NOAAAtlasNESDIS,vol. 68.U.S.GovernmentPrintingOffice, Washington,DC.184pp.
Marchitto,T.M.,Muscheler,R.,Ortiz,J.D.,Carriquiry,J.D.,vanGeen,A.,2010. Dynam-icalresponseofthetropicalPacificOceantosolarforcingduringtheHolocene. Science 330,1378–1381.
McCormac, F.G., et al., 2004. Radiocarbon Calibration from 0–26 cal kyr BP— SHCa104SouthernHemisphereCalibration,0–11.0 calkyrBP.Radiocarbon 46, 1087–1092.
McGregor,H.V.,Fischer,M.J.,Gagan,M.K.,Fink,D.,Phipps,S.J.,Wong,H.,Woodroffe, C.D.,2013.AweakElNiño/SouthernOscillationwithdelayedseasonalgrowth around4,300yearsago.Nat.Geosci. 6,949–953.
Meehl,G.A.,Arblaster,J.M.,2009.Alaggedwarmevent-likeresponsetopeaksin solarforcinginthePacificregion.J.Climate 22,3647–3660.
Meehl,G.A.,Arblaster,J.M.,Matthes,K.,Sassi,F.,vanLoon,H.,2009.Amplifying thePacificclimatesystemresponsetoasmall11-yearsolarcycleforcing. Sci-ence 325,1114–1118.
Metzger, P., Casadevall, E., Pouet, M.J., Pouet, Y., 1985. Structures of some botryococcenes-branchedhydrocarbonsfromtheB-raceofthegreenalga Botry-ococcusbraunii.Phytochemistry 24,2995–3002.
Miao,X.,Mason,J.A.,Swinehart,J.B.,Loope,D.B.,Hanson,P.R.,Goble,R.J.,Liu,X., 2007.A10,000yearrecordofduneactivity,duststorms,andseveredroughtin thecentralGreatPlains.Geology 35,119–122.
Moy, C.M., Seltzer, G.O., Rodbell, D.T., Anderson, D.M., 2002. Variability of El Niño/SouthernOscillationactivityatmillennialtimescalesduringtheHolocene epoch.Nature 420,162–165.
Pascolini-Campbell,M.,Zanchettin,D.,Bothe,O.,Timmreck,C.,Matei,D.,Jungclaus, J.H.,Graf,H.-F.,2014.TowardarecordofCentralPacificElNiñoeventssince 1880.Theor.Appl.Climatol.http://dx.doi.org/10.1007/s00704-014-1114-2.
Peterson,L.C.,Haug,G.H.,Hughen,K.A.,Rohl,U.,2000. Rapidchanges inthe hy-drologic cycle of the tropical Atlantic during the last glacial. Science 290, 1947–1951.
Pierrehumbert,R.T., 2000. Climate changeand the tropical Pacific: the sleeping dragonwakes.Proc.Natl.Acad.Sci.USA 97,1355–1358.
Pryet,DomínguezC,A.,Tomai,P.F.,Chaumont,C.,d’Ozouville,N.,Villacís,M., Vi-olette, S., 2012. Quantification ofcloud water interceptionalong the wind-wardslopeofSantaCruzIsland,Galápagos(Ecuador).Agric.For.Meteorol. 161, 94–106.
Rasmusson,E.M.,Carpenter,T.H.,1982.Variationsintropicalseasurface tempera-tureandsurfacewindfieldsassociatedwiththeSouthernOscillation/ElNiño. Mon.WeatherRev. 110,354–384.
Richerson,P.J.,Neale,P.J.,Wurtsbaugh,W.,Alfaro,R.,Vincent,W.,1986.Patternsof temporalvariationinLakeTiticaca–ahigh-altitudetropicallake.1.Background, physicaland chemicalprocesses,and primaryproduction.Hydrobiologia 138, 205–220.
Risi,C.,Bony,S., Vimeux,F.,2008.Influenceofconvectiveprocesseson the iso-topic composition (δ18O and δD) of precipitation and water vapor in the tropics:2.Physical interpretationoftheamounteffect.J. Geophys.Res. 113. http://dx.doi.org/10.1029/2008JD009943.
Sachs, J.P., Sachse, D., Smittenberg, R.H., Zhang, Z.H., Battisti, D.S., Golubic, S., 2009.SouthwardmovementofthePacificintertropicalconvergencezoneAD 1400–1850.Nat.Geosci. 2,519–525.
Salau,O.R., Schneider,B.,Park,W.,Khon,V.,Latif,M.,2012.Modelingthe ENSO impactoforbitallyinducedmeanstateclimatechanges.J.Geophys.Res. 117, C05043.http://dx.doi.org/10.1029/2011JC007742.
Sandweiss,D.H.,Richardson,J.B.,Reitz,E.J.,Rollins,H.B.,Maasch,K.A.,1996. Geoar-chaeologicalevidence fromPeru for a5000years BPonset ofElNiño. Sci-ence 273,1531–1533.
Steinitz-Kannan, M., Riedinger, M.A., Last, W., Brenner, M., Miller, M.C., 1998. A 6000-yearrecordofintenseevidenceofElNiñofromsedimentsina Galá-pagosIslandslake.Bull.Inst.Fr.ÉtudesAndines 27,581–592(inSpanishwith Englishabstract).
Taylor,G.T.,et al., 2012. Ecosystemresponses inthe southern CaribbeanSea to globalclimatechange.Proc.Natl.Acad.Sci.USA 109,19315–19320.
Thirumalai, K., Partin, J.W., Jackson, C.S., Quinn, T.M., 2013. Statistical con-straints on the El Niño Southern Oscillation reconstructions using
individ-ualforaminifera:a sensitivityanalysis.Paleoceanography 28.http://dx.doi.org/ 10.1002/palo.20037.
Townsend,S.A.,2001.PerennialdominationofphytoplanktonbyBotryococcus and Peridinium inadiscontinuouslypolymictic reservoir(tropicalAustralia).Arch. Hydrobiol. 151,529–548.
Trenberth, K.E., Guillemot, C.J., 1996. Physical processes involved in the 1988 droughtand1993floodsinNorthAmerica.J.Climate 9,1288–1298.
Trueman,M.,d’Ozouville,N.,2010.CharacterizingtheGalápagosterrestrialclimate inthefaceofglobalclimatechange.GalápagosRes. 67,26–37.
vanLoon,H.,Meehl,G.A.,2011.Theaverageinfluenceofdecadalsolarforcingonthe atmosphereintheSouthPacificregion.Geophys.Res.Lett. 38.http://dx.doi.org/ 10.1029/2011GL047794.
Vonmoos,M.,Beer,J.,Muscheler,R.,2006.LargevariationsinHolocenesolar activ-ity:constraintsfrom10BeintheGreenlandIceCoreProjecticecore.J.Geophys.
Res. 111.http://dx.doi.org/10.1029/2005JA011500.
Wake,L.V.,Hillen,L.W.,1980.Studyofabloomoftheoil-richalgaBotryococcus braunii intheDarwinRiverReservoir.Biotechnol.Bioeng. 22,1637–1656. Zhang,Z.H.,Sachs,J.P.,2007.Hydrogenisotopefractionationinfreshwateralgae:I.
Variationsamonglipidsandspecies.Org.Geochem. 38,582–608.
Zhang,Z.H.,Metzger,P.,Sachs,J.P.,2007.Biomarkerevidencefortheco-occurrence ofthreeraces(A,BandL)ofBotryococcusbraunii inElJuncoLake,Galapágos. Org.Geochem. 38,1459–1478.
Zhang,Z.,Sachs,J.P.,Marchetti,A.,2009.Hydrogenisotopefractionationin freshwa-terandmarinealgae:II.Temperatureandnitrogenlimitedgrowthrateeffects. Org.Geochem. 40,428–439.
Zhang,Z.H.,Metzger,P.,Sachs,J.P.,2011.Co-occurrenceoflong-chaindiols,keto-ols, hydroxyacidsandketoacidsinrecentsedimentsofLakeElJunco,Galápagos Islands.Org.Geochem. 42,823–837.
Zhang,Z.H.,Metzger,P.,Sachs,J.P.,2013.Unprecedentedlong-chain1-chloroalkenes and1-chloroalkanesintheHolocenesedimentsofLakeElJunco,Galápagos Is-lands.Org.Geochem. 57,1–6.
Zhang,Z.H.,Metzger,P.,Sachs,J.P.,2014.Boundlipidbiomarkersinsedimentsfrom ElJuncoLake,GalápagosIslands.Org.Geochem. 75,122–128.
Zheng, W., Braconnot, P., Guilyardi, E., Merkel, U., Yu, Y., 2008. ENSO at 6 ka and21 kafromocean–atmospherecoupledmodelsimulations.Clim.Dyn. 30, 745–762.