2010/008
Pore space analysis of beech wood: The vessel network
Philipp Hass1, *, Falk K. Wittel1 , Sam A. McDonald2,3,a , Federica Marone2 , Marco Stampanoni2,4 , Hans J. Herrmann1
and Peter Niemz1
1Institute for Building Materials, ETH Zurich, Zurich, Switzerland
2Swiss Light Source, Paul Scherrer Institut, Villigen, Switzerland
3Department of Radiology, University of Lausanne Medical School, Lausanne, Switzerland
4Institute for Biomedical Engineering, University of Zurich and ETH Zurich, Zurich, Switzerland
*Corresponding author.
Institute for Building Materials, ETH Zurich, Schafmattstrasse 6, CH-8093 Zurich, Switzerland
E-mail: [email protected]
Abstract
Water transport in wood is vital for the survival of trees. With synchrotron radiation X-ray tomographic microscopy (SRXTM), it has become possible to characterize and quan-tify the three-dimensional (3D) network formed by vessels that are responsible for longitudinal transport. In the present study, the spatial size dependence of vessels and the organ-ization inside single growth rings in terms of vessel-induced porosity was studied by SRXTM. Network characteristics, such as connectivity, were deduced by digital image analysis from the processed tomographic data and related to known complex network topologies.
Keywords: beech wood; image analysis; synchrotron
radiation X-ray tomographic microscopy (SRXTM); vessel network.
Introduction
Knowledge of the anatomical structure of wood is crucial towards understanding various biological processes in trees and physical properties of wood. To describe transport proc-esses, e.g., a characterization of the three-dimensional (3D) wood structure is needed. It is still not fully understood how a tree is able to transport water from the roots to the crown at a height of more than 100 m (Koch et al. 2004; Koch and Sillett 2009; Netting 2009). It has also since been realized that the cohesion tension theory, proposed in the late 19th century, does not sufficiently explain water transport via the capillary network in the xylem (Becker et al. 2000; Meinzer
Present address: School of Materials, University of Manchester,
a
Manchester, UK.
et al. 2001; Ho¨ltta¨ 2005). The structure of wood also has a strong impact on its technological applications, such as bonding with adhesives, impregnation with preservatives, or coating (Kamke and Lee 2007).
With the advent of microscopy in the 17th century began the description of basic components of wood such as fibers, vessels, wood rays, and pits between the cells (Bosshard and Kucˇera 1973; Wagenfu¨hr 1999). In the 19th century, bor-dered pits and cell wall layers became visible (Preston 1965; Coˆte 1967; Carlquist 1988). In the 20th century, X-ray dif-fraction or electron microscopy led to a profound knowledge of the cellular ultrastructure. For example, the crystalline structure of the cellulose, the fine pits in the cell walls, and the cell wall structure could be studied with high resolution (Harada 1962; Preston 1965; Coˆte 1967; Carlquist 1988; Wagenfu¨hr 1999). Chaffey (2002) gives an overview on this topic.
Pits are interconnections between tracheids and vessels and permit fluid transportation between water conducting structure elements. The spatial organization of this 3D net-work determines the functionality and robustness of water transport. The analytical power of two-dimensional (2D) observations in this field is limited. The 3D vessel structure became accessible via the ‘‘optical shuttle method’’ of Zim-mermann and Tomlinson (1965, 1966). Bosshard and Kucˇera (1973) went on to investigate the 3D spatial distribution of the vessel network in beech (Fagus sylvatica L.). They found that vessels are deflected mainly in the tangential direction from their longitudinal orientation and that they build a fully connected network with a mean contact length of 1.75 mm. With a similar method, Fujita and Sakai (1996) analyzed the vessels in Japanese horse chestnut (Aesculus turbinata). But-terfield (1993) found that recordings of individual cross-sec-tions proved to be the best means of observing the vessel pathway. Modern computer technology and digital image analysis permits the conversion of 2D images to 3D models (e.g., Bardage and Daniel 2004). Today, spatial investigations of wood are even easier by means of modern micro-com-puted tomography (m-CT). For example, Steppe et al. (2004) analyzed vessel characteristics of two wood species by desktop X-ray m-CT. These authors demonstrated the high potential of a computer-assisted evaluation based on image analysis. Mannes et al. (2010) showed that spatial investi-gation of anatomical features is possible with synchrotron radiation with a resolution of a few micrometers. Bucur (2003) also gave an overview on such non-destructive methods.
To quantify the pore space of wood with high resolution, modernm-CT is the method of choice. In combination with image processing and image analysis it is possible to deter-mine complete network characteristics beyond single vessel properties. The present work aims at the collection of high
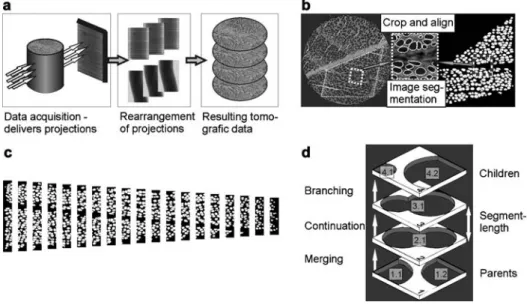
Figure 1 Schematic workflow (a) and details of the experiments (b–d). (b) Transformation of the selected growth ring in the original cross-section to a binary image; the subset demonstrates the quality of the segmentation method. (c) Binning of a growth ring for porosity measurements. (d) Principle of connectivity analysis.
resolution SRXTM data from beech wood and their evalua-tion as 3D images.
Materials and methods
Clear beech wood samples, without any red heartwood, were inves-tigated using SRXTM methodology at the TOMCAT beamline (Stampanoni et al. 2006) at the Swiss Light Source (PSI Villigen, Switzerland), following the experimental setup by Mannes et al. (2010). A cylindrical specimen was chosen to reduce the risk of artifacts during reconstruction. Samples were turned with a lathe chisel until reaching a diameter of 3 mm along the longitudinal axis, and were kept at ambient room climate (approx. 208C and 40–50% RH) to minimize dimensional changes. Before turning, the speci-mens were assembled by bonding two pieces of wood, because the same set of samples will be used for an investigation of the pene-tration behavior of adhesives into beech wood. Thus, the investi-gated growth ring sections do not range over the whole sample diameter and the samples contain a bond line in the middle of the specimen. For each sample, a data set of 1501 projections over 1808 was acquired at a photon energy of 10 keV. The X-rays were con-verted to visible light by a 25-mm-thick Eu-doped LAG scintillator, magnified (4=) by an optical microscope and detected by a 14-bit CCD camera (2048=2048 chip). Two-fold on-chip binning was used, giving a nominal pixel size of 3.7mm.
The tomographic data set was reconstructed based on a Filtered Back Projection algorithm. Finally, the tomographic data were con-verted to a stack of axial slices (i.e., cross-section images), repre-senting layers with a thickness equal to a voxel size of 3.7 mm (Figure 1a).
A series of image enhancement and processing operations were performed: first, the gray scale values were adjusted to increase the contrast in all individual cross-sections. For data reduction, single growth ring sections were isolated. The selected regions were rotat-ed to align all samples parallel to the three major wood directions (xstangential; ysradial; zslongitudinal). To increase the precision
of the image segmentation, the resolution of the images was dou-bled, before a two-step image segmentation was applied.
The first step was based on local gray value thresholds of certain regions. This step already delivers reasonable results because the gray values of the wood substance and the air in the pores differ distinctly. However, some regions are incorrectly segmented, because the cells in the wood rays are also identified along with the vessels. Because these regions are significantly smaller than the ves-sels and because they do not extend over multiple layers, they can be eliminated easily by morphological image processing steps of the binarized data. In this case, a morphological opening with a circular structuring element was used. At the end of the process, the pores of the selected growth ring were obtained (Figure 1b).
To analyze the vessel network, a so-called layer-wise blob anal-ysis was performed. A blob analanal-ysis is an image analanal-ysis technique that is used to identify connected regions in a binarized image. First, all white areas in the cross-sections were labeled and their areas, equivalent diameters, and positions were stored. By normalizing the radial position of the vessels by the growth ring width, all values were expressed in relative coordinates for comparison. To measure the relative porosity, the selected area was binned (Figure 1c). The porosity of each bin equals the ratio of white pixels to black ones. In a second step, those planes had to be identified, where the vessels merge or branch. Note that merging of vessels does not necessarily mean that two vessels become a single one. In many cases, merging means that vessels only touch each other. Pits are visible in cross-sections as channels that connect two vessels. In reality, pits have a diameter of 4–11mm (e.g., Harada 1962; Wagen-fu¨hr 1999). Note that the resolution of our measurement is not high enough to resolve pits accurately. The gray value of a voxel repre-sents the average value of the attenuation coefficient in a 3.7=3.7=3.7mm3 volume. Therefore, regions containing pits are
closer to the gray value distribution of the pore space and are also segmented.
The process is further demonstrated in Figure 1d. The labeled, adjacent layers were projected onto each other and the related pores are identified. For example, the pore 2.1 in layer 2 is projected onto layer 1. Because this pore is directly linked to pores 1.1 and 1.2, those pores must have merged in layer 2. The projection of layer 3 onto layer 2 only matches one pore (3.1 matches 2.1), because the vessel continues. An example for branching occurs when layer 4 is
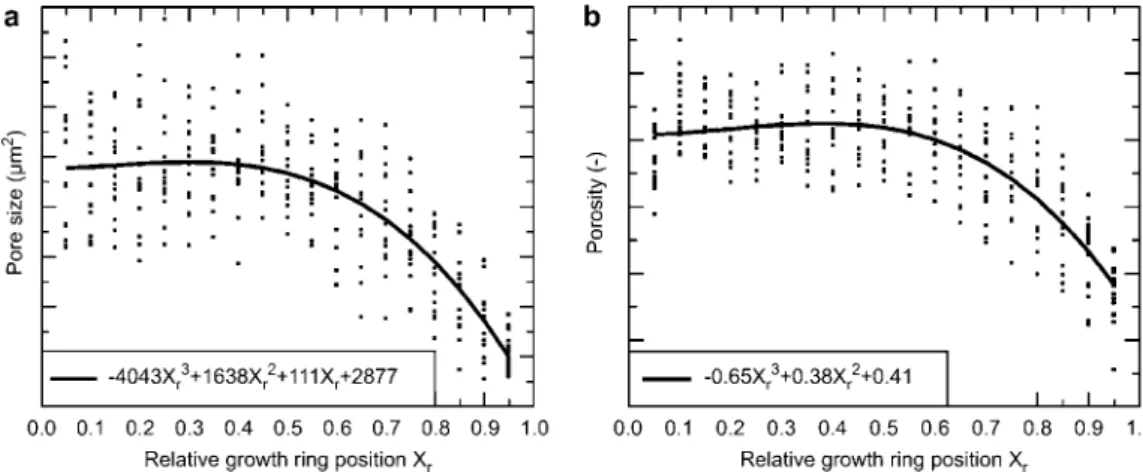
Figure 2 Pore sizes (a) and porosities (b) as a function of a dimensionless relative position in the growth ring (in which: 0.0 represents earlywood and 1.0 represents latewood). The polynomial equations describe the correlation curves presented.
projected onto layer 3, because pores 4.1 and 4.2 match the single pore 3.1 in layer 3. Pores without counterparts on neighboring layers mark either starting or ending vessels. The number of layers in between determines the segment length. For example in Figure 1d, the segment length would be 2, as it reaches across two layers. The pores, from which a segment emerges, are called parents, whereas the branching ones are named children. With such a family tree structure, the connectivity of the whole network can be identified.
Results and discussion
Pore size and porosity
The porosity arising from vessels and their characteristic size was analyzed in individual segmented cross-sections with a longitudinal distance of 300mm. Owing to the finite length of the samples (3 mm), the results can be considered as being invariant in the longitudinal direction. To compare the data from the 16 evaluated growth rings with different widths (between 728 mm and 2022 mm), the growth ring width (GRW) was normalized. Thereby, the GRW can be described using dimensionless coordinates ranging from zero for ear-lywood to one for latewood. In Figure 2, the average values for each sample in the respective region of the growth ring is shown (dots in Figure 2).
The average vessel diameter of beech should be less than 50mm (Wagenfu¨hr 1999). However, the vessel diameters of all investigated growth rings gave a mean value of 55.3" 11.7 mm. Certainly, pore sizes greatly vary, depending on their radial position. The high variance in vessel size and the differences in GRW are partly owing to environmental fac-tors (Sass and Eckstein 1995; Pumijumnong et al. 2000). The samples in the present work were selected randomly, thus the pore size variation reflects the natural scattering of this ana-tomical feature. Essentially, the results of the present study are in agreement with those of Sass and Eckstein (1995), who investigated the vessel size distribution of one growth ring of beech wood from the ecophysiological approach.
In addition, values for pore size and porosity depending on growth ring position are fitted using a cubic polynomial function. As expected for a diffuse-porous wood such as
beech, no abrupt change within one growth ring from ear-lywood to latewood can be observed. The functional form of those fits is similar for all specimens; they differ mainly in their individual axis intercepts. By averaging all fits, it is possible to describe the relation between relative position inside the growth ring and pore size or porosity with one final expression (solid line in Figure 2). In the end, it illus-trates that, rather than the GRW, it is the relative position inside the growth ring that determines the mean pore size and the porosity. Hence the construction plan of a beech tree seems to follow the principle of keeping relative pore sizes and porosities more or less constant, which makes sense in terms of keeping the water transport distribution constant. Only the GRW is adapted as a reaction to the yearly chang-ing growth conditions (Sass and Eckstein 1995; Pumijum-nong et al. 2000).
Connectivity and network topology
Water transport to the crown is mainly influenced by pore sizes and capillary forces, as well as porosity influence on the flow rates. In addition, the way the vessels are intercon-nected is also crucial. The reconstructed vessel network shows several important characteristics, such as missing vessel contacts across growth ring borders (Figure 3a) or the weaving around of wood rays (Figure 3b).
As a consequence of the deflection around rays, vessels contact each other more frequently in the tangential, rather than in the radial direction. At contact zones, transport between vessels takes place through pits, leading to a homo-geneous distribution of water throughout the entire growth ring. This tangential orientation of the vessels is common in all tree species and allows the tangential spreading of the water throughout the whole growth ring during the transport in the axial direction. In addition, the vessels develop heli-cally around the stem (Zimmermann 1983).
To characterize the vessel network, connectivity analysis was performed as described in the Materials and methods (Figure 1d). Each segment is labeled, thus the first and final layer is obtained, as well as the labels of parent and children segments, if present. Knowing the connectivity, a cluster
Figure 3 Vessel network of beech wood looking along T-direction (a) and R-direction (b). Sample height is 3 mm. Note that the dis-played vessel discontinuities are mainly as a result of to vessels moving in and out of the extracted volume.
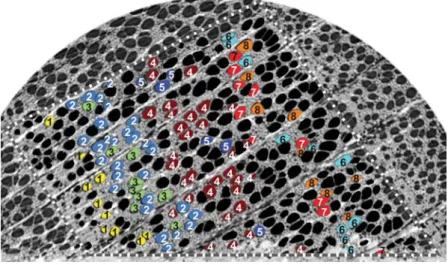
Figure 4 Projection of the eight largest clusters in one exemplary cross-section. Cluster numbers are printed for clarity.
analysis is performed to identify interconnected vessel seg-ments (cluster). Note that the cluster number depends on the size of the sample. Unlike softwoods and some ring porous hardwoods, beech builds up a vessel network in each growth ring without any vessel contacts across growth ring borders (Bosshard 1976). The transport in the radial direction over growth ring boundaries is managed by wood rays (Kucˇera 1975). Therefore, the analysis of a complete growth ring would have resulted in one single cluster, presuming the
sys-tem has not been damaged. Because the samples used in the present study depict only a small section of the growth ring, numerous clusters with differing sizes can be identified. However, the orientation of clusters is evidently in the tan-gential direction as a consequence of the waviness of the vessels (Figure 4).
By setting boundary vessels, it is also possible to calculate the invasion paths from the outside into the network. These paths describe, how a fluid would penetrate the vessel net-work and where the fluid would be after a given time. This will be very useful for the investigation of the penetration behavior of adhesives that will be conducted on the same set of samples in a later study.
Transporting water inside a network can ensure transport even in the case of partial damage to the network. Dujesief-ken et al. (1989) and Schmitt and Liese (1995) investigated the wound reactions of beech wood following an injury and showed how the tree encapsulates the affected area to protect itself from the inflow of air and possible attack by fungi. Zimmermann (1983) reports that trees are even able to main-tain water transport when a large part of the network is destroyed, as has been demonstrated in the ‘‘double saw-cut experiment’’, where the stem of a tree was cut halfway across the trunk from opposite sides at different heights.
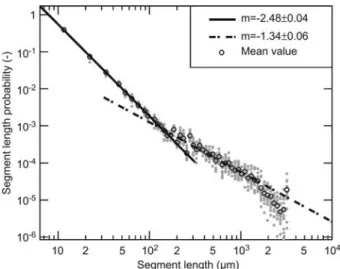
However, robustness depends on the topology, extent, and type of damage. The allocation of segment lengths allows for characterization of the network topology. After the con-nectivity analysis described in the Materials and methods, the number of layers for each segment, and therefore its seg-ment length, is known. Figure 5 shows the segseg-ment length distribution of the identified segments in all samples in dou-ble logarithmic scale. It is astonishing that no evidence for a characteristic length of segment can be found; rather two distinct regimes are observed that can be described by power laws with two different exponents. The authors suppose that the exponent for small segment lengths arises from the pit distances inside vessel contact zones with distances up to approximately 120 mm and the second exponent describes the inter-contact zones that spans over more than one order of magnitude (Figure 5).
Figure 5 Log-log plot of the normalized distribution of segment length probability.
The decline on the right hand side results from the finite size of the sample and is not considered a regime in itself (size effects). Accordingly, characteristics of a scale-free net-work are observed. Those netnet-works are known to be robust against random attacks (Albert et al. 2000).
Because it is vital for trees to maintain water supply even when damage is done to the transport system, a scale-free network seems to be the best solution: this combines trans-port in the radial direction via rays and longitudinally through the vessel network. Owing to a high connectivity of vessels in the tangential direction, the entire growth ring is involved in the transport from the root to the crown (Boss-hard 1984). By building a network with scale-free charac-teristics, trees have found a way to protect the transport of water against random attacks.
Conclusions
The 3D pore space in wood can be quantified in a straight-forward way by means of SRXTM data combined with advanced image analysis. Owing to the automatized routine evaluation, an investigation on large data sets is possible, which strengthen the information value. Important findings are:
• Pore size as well as porosity are similar as a function of the relative position inside one growth ring in the radial direction and can be fitted by a cubic polynomial function.
• The well-known tangential vessel orientation was con-firmed and is enforced by wood rays, which induce the vessels to deviate from the strong axial direction and weave around the rays. Hence the vessel network shows a greater connectivity in the tangential rather than the radial direction.
• In the segment length distribution, no characteristic length was recognized. Furthermore, two distinct regions can be observed that can be expressed via power laws with two
different exponents. By building such a network, which presents the characteristics of a scale-free network, beech trees protect their transportation system in a very robust way against random attacks.
Further studies could be dedicated to the question whether scale-free networks are a common strategy in woody plants, particularly in species with vessel systems that are not iso-lated in growth rings. The technical application of the find-ings on the vessel network topology, e.g., on the penetration of fluids into wood, is a subject of further studies in our laboratory.
Acknowledgements
The financial support of this work under SNF grant 116052 as well as the advice of Anders Ka¨stner (NIAG/ASQ, PSI, Villigen) for the image processing are gratefully acknowledged.
References
Albert, R., Jeong, H., Barabasi, A.L. (2000) Error and attack tol-erance of complex networks. Nature 406:378–382.
Bardage, S.L., Daniel, G. (2004) Three-dimensional morphological aspects of spruce wood and pulp fibres. Eds. Schmitt, U., Ander, P., Barnett, J.R., Emons, A.M.C., Jeronimidis, G., Saranpa¨a¨, P., Tschegg, S. Wood Fibre Cell Walls: Methods to Study their Formation, Structure and Properties, COST action E20. pp. 217–229.
Becker, P., Meinzer, F.C., Wullschleger, S.D. (2000) Hydraulic lim-itation of tree height: a critique. Funct. Ecol. 14:4–11. Bosshard, H.H., Kucˇera, L. (1973) 3-Dimensional structure-analysis
of wood. 1. Network of vessel system inFagus sylvatica L. Holz
Roh-Werkst. 31:437–445.
Bosshard, H.H. (1976) Jahrringe und Jahrringbru¨cken. Schweiz. Z. Forstwes. 127:675–693.
Bosshard, H.H. (1984) Holzkunde – Band 2: Zur Biologie, Physik und Chemie des Holzes. In: Lehrbu¨cher und Monographien aus dem Gebiete der exakten Wissenschaften: Reihe der experimen-tellen Biologie, 19. Birkha¨user Verlag, Basel, Boston, Stuttgart. Bucur, V. (2003) Nondestructive characterization and imaging of wood. In: Springer Series in Wood Science 760. Ed. Timell, T.E. Springer-Verlag, Berlin, Heidelberg.
Butterfield, B.G. (1993) The structure of wood: an overview. In: Primary Wood Processing. Ed. Walker, J.C.F. Chapman and Hall, London.
Carlquist, S. (1988) Comparative wood anatomy. In: Springer Series in Wood Science. Ed. Timell, T.E. Springer-Verlag, Berlin, Heidelberg.
Chaffey, N. (2002) Wood Formation in Trees – Cell and Molecular Biology Techniques. Ed. Chaffey, N. Taylor & Francis, London, New York.
Coˆte, W.A. (1967) Wood Ultrastructure – an Atlas of Electron Micrographs. University of Washington Press, Seattle, London. Dujesiefken, D., Ebenritter, S., Liese, W. (1989) Wound reactions in the wood of birth, beech and basswood. Holz Roh-Werkst. 47:495–500.
Fujita, M., Sakai, H. (1996) Three-dimensional analysis of vessels inAesculus turbinate. In: Recent Advances in Wood Anatomy.
White-house, L.J. New Zealand Forest Research Institute Limited. pp. 45–46.
Harada, H. (1962) Electron microscopy of ultrathin sections of beech wood (Fagus crenata BLUME). Mokuzai Gakkashi 8:
252–258.
Ho¨ltta¨, T. (2005) Dynamics of water and solute transport in trees. In: University of Helsinki Report Series in Physics HU-P-D125. University of Helsinki, Helsinki.
Kamke, F.A., Lee, J.N. (2007) Adhesive penetration in wood – a review. Wood Fiber Sci. 39:205–220.
Koch, G.W., Sillett, S.C. (2009) A response to: Limitations within ‘‘the Limits to Tree Height’’. Am. J. Bot. 96:545–547. Koch, G.W., Sillett, S.C., Jennings, G.M., Davis, S.D. (2004) The
limits to tree height. Nature 428:851–854.
Kucˇera, L. (1975) 3-Dimensional structure-analysis of wood 2. Ves-sel-ray-network in beech (Fagus sylvatica L). Holz Roh-Werkst.
33:276–282.
Mannes, D., Marone, F., Lehmann, E., Stampanoni, M., Niemz, P. (2010) Application areas of synchrotron radiation tomographic microscopy for wood research. Wood Sci. Technol. 44:67–84. Meinzer, F.C., Clearwater, M.J., Goldstein, G. (2001) Water
trans-port in trees: current perspectives, new insights and some con-troversies. Environ. Exp. Bot. 45:239–262.
Netting, A.G. (2009) Limitations within ‘‘the Limits to Tree Height’’. Am. J. Bot. 96:542–544.
Preston, R.D. (1965) Interdisciplinary approaches to wood structure. In: Cellular Ultrastructure of Woody Plants. Ed. Coˆte, W.A. Syracuse University Press, Syracuse, NY.
Pumijumnong, N., Eckstein, D., Sass, U., Park, W.-K. (2000) Tree-ring network on teak (Tectona grandis L.) and its use for climate
reconstruction. In: New Horizons in Wood Anatomy. Ed. Kim,
Y.S. Chonnam National University Press, Kwangju, Korea, S278–S281.
Sass, U., Eckstein, D. (1995) The variability of vessel size in beech (Fagus sylvatica L.) and its ecophysiological interpretation.
Trees 9:247–252.
Schmitt, U., Liese, W. (1995) Wound reactions in the xylem of some hardwoods. Drevarsky Vyskum 40:1–10.
Stampanoni, M., Groso, A., Isenegger, A., Mikuljan, G., Chen, Q., Bertrand, A., Henein, S., Betemps, R., Frommherz, U., Bohler, P., Meister, D., Lange, M., Abela, R. (2006) Trends in synchro-tron-based tomographic imaging: the SLS experience. In: Devel-opments in X-Ray Tomography V (Proceedings of the Society of Photo-Optical Instrumentation Engineers (Spie)). Ed. Bonse, U. Spie-International Society of Optical Engineering, Bellingham. Steppe, K., Cnudde, V., Girard, C., Lemeur, R., Cnudde, J.P., Jacobs, P. (2004) Use of X-ray computed microtomography for non-invasive determination of wood anatomical characteristics. J. Struct. Biol. 148:11–21.
Wagenfu¨hr, R. (1999) Anatomie des Holzes. Leinfelden-Echterdin-gen, DRW-Verlag Weinbrenner GmbH & Co.
Zimmermann, M.H., Tomlinson, P.B. (1965) Anatomy of the palm
Rhapsis excelsa, 1: Mature vegetative axis. J. Arnold Arboretum
46:160–180.
Zimmermann, M.H., Tomlinson, P.B. (1966) Analysis of complex vascular systems in plants-optical shuttle method. Science 152: 72–73.
Zimmermann, M.H. (1983) Xylem structure and the ascent of sap. In: Springer Series in Wood Science. Ed. Timell, T.E. Springer Verlag, Berlin, Heidelberg.
Received January 18, 2010. Accepted May 10, 2010. Previously published online July 29, 2010.