HAL Id: inserm-00654827
https://www.hal.inserm.fr/inserm-00654827
Submitted on 2 Jan 2012
HAL is a multi-disciplinary open access
archive for the deposit and dissemination of
sci-entific research documents, whether they are
pub-lished or not. The documents may come from
teaching and research institutions in France or
abroad, or from public or private research centers.
L’archive ouverte pluridisciplinaire HAL, est
destinée au dépôt et à la diffusion de documents
scientifiques de niveau recherche, publiés ou non,
émanant des établissements d’enseignement et de
recherche français ou étrangers, des laboratoires
publics ou privés.
followup.
Virginie Le Rolle, David Ojeda, Alfredo Hernández
To cite this version:
Virginie Le Rolle, David Ojeda, Alfredo Hernández. Embedding a cardiac pulsatile model into an
integrated model of the cardiovascular regulation for heart failure followup.. IEEE Transactions on
Biomedical Engineering, Institute of Electrical and Electronics Engineers, 2011, 58 (10), pp.2982-6.
�10.1109/TBME.2011.2159715�. �inserm-00654827�
Abstract—The analysis of follow-up data from patients suffering from heart failure is a difficult task, due to the complex and
multifactorial nature of this pathology. In this paper, we present a coupled model, integrating a pulsatile heart into a model of the short to long-term regulations of the cardiovascular system. An interface method is proposed to couple these models, which present significantly different time scales. Results from a sensitivity analysis of the original and integrated models are proposed, with simulations reproducing the main effects of the short and long-term responses of an acute decompensated heart failure episode on a patient undergoing cardiac resynchronization therapy.
Index Terms—Computational modeling. Heart Failure. Cardiac resynchronization therapy.
I. I
NTRODUCTIONEART failure (HF) is a multifactorial pathology presenting one of the highest prevalence worldwide. In HF, cardiac output is reduced by pathological modifications of the mechanical properties of the heart and, in some cases, an altered cardiac electrical activation (intra or inter-ventricular desynchronization). A variety of neurohumoral regulatory mechanisms are triggered during the early stages of HF, covering a wide range of time scales (from seconds to weeks). Although these mechanisms can compensate for the consequences of HF in the short term, they become deleterious in the mid to long terms and may accentuate ventricular dysfunction and cause a permanent increase in pre-load and afterload, a structural remodeling of the heart, pulmonary or peripheral edema, decreased renal output and dyspnea on exertion.
Different therapies are offered to patients suffering from HF, including changes in lifestyle, pharmacological agents (vasodilators, diuretics, beta-blockers) or the implant of a bi-ventricular pacemaker or defibrillator (cardiac resynchronization therapy - CRT) [1]. In all cases, the optimal follow-up of this population is a major concern, since the main cause of hospitalization and health care expenditure in HF is due to acute decompensated heart failure (ADHF) [1].
In past works, we have studied a population of HF patients undergoing CRT, focusing on a multivariate analysis of a set of physiological variables acquired by the CRT device during the 6 months following the implant, for the early-detection of ADHF [2]. This work revealed complex interactions between the acquired variables. A model-based analysis of these data would thus be useful to better understand the events leading to an ADHF and to improve the early detection of these episodes.
Although a number of lumped-parameter models of the cardiovascular system (CVS) have been proposed in the literature, only a few provide the multi-organ integration and the representation of both short- and long-term cardiovascular regulations that are required for the analysis of ADHF [3]. The pioneering models of Guyton, Coleman, and Granger [4] propose a lumped-parameter, multi-organ representation of the cardiovascular system and its regulation, which can be used to analyze events over time scales ranging from seconds to weeks or months. In past works we have implemented these models under an object-oriented multiformalism modeling tool (M2SL) that eases the integration of heterogeneous models [5]. However, the Guyton models, as well as their more recent versions [6], do not include a pulsatile cardiac function. This is a major limitation when studying HF, since i) the model cannot represent the systolic and diastolic characteristics of HF, or a biventricular desynchronization, ii) some useful clinical variables, such as the maximum of the arterial pressure derivative cannot be simulated and iii) a more realistic representation of short-term regulatory loops (such as the baroreflex) requires these pulsatile variables.
This paper presents an example of model integration at different time scales in which the non-pulsatile ventricles of the original Guyton model are replaced by a pulsatile, elastance-based model of the heart, including inter-ventricular interaction through the septum. Sensitivity analyses and simulation results are presented and discussed in the context of CRT.
II. I
NTEGRATION OFP
ULSATILEV
ENTRICLESThe original Guyton model is built around a central ‘Circulatory Dynamics’ module, which interacts with 17 peripheral modules corresponding to various physiological functions (autonomic control, renal function, renine angiotensine system,…). Ventricular function is represented by a static algebraic equation, providing mean ventricular outputs (QLO and QRO for the left and right
Manuscript received April 11, 2011. This work was partly supported by the ANR BioSys SAPHIR project. V. Le Rolle, D. Ojeda and A.I. Hernández are with INSERM U642, Rennes, F35000, France and with Université de Rennes 1, LTSI, Rennes, F35000, France. (email: virginie.lerolle, david.ojeda, alfredo.hernandez@univ-rennes1.fr).
Embedding a cardiac pulsatile model into an
integrated model of the cardiovascular
regulation for heart failure follow-up
Virginie Le Rolle, David Ojeda and Alfredo I. Hernández
including the mean arterial pressure (PA), pulmonary pressure (PPA) and the autonomic effect on cardiac contractility (AUH0).
In order to integrate a pulsatile heart, the left (LV) and right (RV) ventricles of the Guyton model were substituted with pulsatile ventricular models. To our knowledge, the first attempt to integrate a pulsatile heart into the Guyton model was proposed by Werner et al. [7]. However, their work focused on analysing the short-term response of the system, and no details on coupling with all the Guyton components were given. In addition, simulation results were not compared to Guyton’s results. This substitution process is not simple, for it requires i) the definition of coupling transformations in order to preserve the numerical and physiological properties of the original model, ii) parameter identification for the proposed coupling transformations and iii) a sensitivity analysis providing information on the impact of integrating the new pulsatile model.
A. Coupling the Guyton and the Pulsatile Models
The first coupling interface concerns the hemodynamic variables. This coupling can be performed directly (without any transformation), since the physical units used in both models for these variables are the same. Atrial and arterial pressures of the Guyton model are connected as inputs to the pulsatile models and trans-valvular flows obtained from the pulsatile model are connected to the Guyton model.
In order to obtain pulsatile variables, a time-varying elastance formalism, including ventricular interaction as proposed by Smith [8] was used. Ventricular elastances vary between values obtained from the End Systolic Pressure-Volume Relationship and the End Diastolic Pressure-Volume Relationship (EDPVR). End systolic (Pes) and end diastolic (Ped) pressures are defined as:
Pes(V)=Ees(V-Vd) (1)
Ped(V)= P0(exp(λ(V-V0 )-1)) (2)
where Ees is the end systolic elastance; Vd is the volume at zero pressure; P0, λ, and V0 are the parameters defining the EDPVR.
The pressure-volume relationship of each ventricle is calculated by:
P(V) = e(t) Pes(V)+(1-e(t)) Ped(V) (3)
where e(t) represents the elastance function that will be defined later on. The septum is represented by a flexible common wall between the LV and the RV. The LV free wall volume (Vlvf) and the RV free wall volume (Vrvf) are defined as:
Vlvf = Vlv – Vspt and Vrvf = Vrv – Vspt (4)
where Vspt, Vlv and Vrv are respectively the septum, LV and RV volumes. The computation of the septum volume is the solution of
the equation linking the septum pressure to the difference between left and right ventricular pressures:
Psept = Plv − Prv (5)
Psept=e(t)Ees,sept(Vsept-Vd,sept)+(1-e(t))P0,sept(eλ(V-Vo)-1) (6)
The heart valves are represented by modulated resistances.
A second coupling interface deals with the modulation of the cardiac activity through continuous variables of the Guyton model representing the autonomic control of the chronotropic and inotropic effects (AUR0 and AUH0 respectively). Since AUR0
and AUH0 are dimensionless variables, the following linear transformations are applied:
AUR = SAUR(AUR0 - 1) + BAUR (7)
AUH = SAUH(AUH0 - 1) + BAUH (8)
where SAUR and SAUH are sensitivity controllers and BAUR and BAUH are baseline controllers. These controller parameters have to be
tuned to adjust the level of autonomic regulation.
A transformation based on an Integral Pulse Frequency Modulation (IPFM) model [9] has been further defined to convert
AUR into a series of pulses that will activate ventricular elastances. Each emitted pulse of the IPFM generates a variation of the
ventricular elastance, which depends on AUR as follows:
e(t)=A·exp(B(t·AUR-C)2) (9)
where t is the time elapsed since the last activation pulse and A = 1; B = 80s-2 and C = 0.27s are the elastance parameters
proposed in [8]. Finally, the end-systolic elastance Ees is modulated by:
Ees=AUH·Ees0 (10)
where Ees0 is the basal value for the end-systolic elastance.
B. Identification of the controller parameters
Controller parameters P=[SAUR, BAUR, SAUH, BAUH] were identified by comparing the simulations obtained from the original
Guyton model with those obtained from the proposed integrated, pulsatile model, during the 5 minute-simulation of a sudden severe muscle exercise, which is an original experiment described in the 1972 Guyton et al. paper [4] and presented in detail in [10]. This simulation is obtained by changing the exercise parameter (EXC) to 60 times its normal value at t = 30 sec. This effect generates approximately a 15-fold increase in the whole-body metabolic rate, triggering a regulatory response. Then, at t=2 min, the value of EXC is reset to normal.
The error function ε, which is minimized during the identification process, is computed as:
€ ε = Yjpulsatile(n) − Yjoriginal(n) n=1 N
∑
j=1 6∑
(11)variables and correspond to detrended and scaled versions of the j-th output variable, obtained from the original and pulsatile versions of the model, respectively. The six output variables presented in Figure 1, which were validated against published data in [4], have been selected to calculate ε. In order to identify P, an evolutionary algorithm (EA) has been applied, as in our previous works [11]. EA are stochastic search methods, inspired by the theories of evolution and natural selection, which can be employed to find an optimal configuration for a given system [12]. The repeatability of the obtained optimal parameters was assessed applying the identification method four times, with different initial conditions.
C. Sensitivity Analysis
In order to assess the impact of integrating pulsatile ventricles, an input/output sensitivity analysis of the ‘Circulatory Dynamics’ module was performed. The screening method of Morris [13] was chosen because it provides information on nonlinearities and interactions between variables, with limited computational costs. In this method, each model output y can be expressed as a function of k factors, , where xi is the i-th input, which has been scaled in the interval [0,1]. Several
realizations m=1,..,M, of xi ( ) can be defined, taking values in {1,1/(p-1),2/(p-1),…,1-Δ}, with equal probability, where
Δ=p/2(p-1) and p is the number of levels dividing the input-variable space. The Elementary Effect ( ) of output y, with respect to is defined as:
€
EEi,m= y x
(
1,..., x i,m+ Δ,..., xk)
− y x(
1,..., x i,m,..., xk)
Δ (12)The mean (µi) and standard deviation (σi) of (for all m) are calculated. A large value of µi indicates a significant overall
effect of xi on y, while a large value of σi indicates either non-linear or strong interactions with other inputs. All EEi for a given y
can be analyzed in the σi-µi plane.
III. R
ESULTSTable 1shows the mean values and the standard deviations of the identified parameters obtained with the EA. TABLE 1
SAUR 0.71(+/-0.017) BAUR 0.87(+/-0.009)
SAUH 0.33(+/-0.028) BAUH 0.29(+/-0.006)
Identified values for the sensitivity (S) and baseline (B) controllers for four realizations of the identification algorithm.
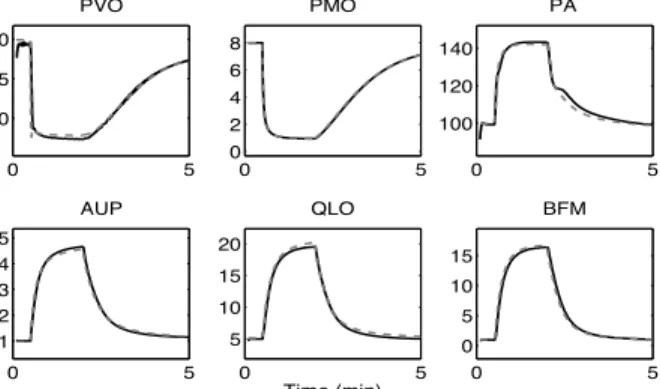
Using these mean parameter values, Figure 1 shows the comparison of the output of the pulsatile and original models for the simulation of a sudden severe muscle exercise, used during the identification process. In order to facilitate the comparison between both model outputs, pulsatile variables have been low-pass filtered. A close match is observed between both simulations. The mean relative root mean squared error (rRMSE) equals 0.0025.
Fig. 1: Comparison of the output of the pulsatile model (black curves) with the original Guyton model (dashed curves) during a 5 minute-simulation of sudden severe muscle exercise. PVO (muscle venous oxygen pressure in mmHg), PMO (muscle cell oxygen pressure in mmHg), PA (mean arterial pressure in mmHg),
AUP (sympathetic stimulation, ratio to normal), QLO (cardiac output in l.min−1) and BFM (muscle blood flow in l.min−1). Black lines are filtered versions of the
pulsatile signals, obtained by integrating these signals on each cardiac cycle and dividing by the cardiac period.
The proposed model provides simulations of pulsatile pressures and volumes for RV and LV. These variables do not exist in the original model. An example of these pulsatile variables is presented in Figure 2, with the simulation of ventricular Pressure-Volume (PV) loops, obtained by changing systemic resistance. The end-systolic PV relation has been found to be linear. These simulations are consistent with clinical observations [14].
Fig. 2: Simulations obtained from the pulsatile model on LV and RV pressures, systemic (PA) and pulmonary (PPA) arterial pressures. PV loops are simulated using different values for the systemic resistance of the Guyton model (R1= 11, R2 = 23 and R3 = 46 mmHg.min/l).
Figure 3 shows the Morris input/output sensitivity results on the mean PA with p = 20 and M = 5⋅k (k = 16 and k = 17
respectively for the original and pulsatile models). In both cases, the most influential inputs are the plasma volume (VP), the autonomic regulation of vasoconstriction on arteries (AUM) and the vascular volume caused by relaxation (VVR). A slightly higher sensitivity to inputs that modulate the systemic resistance (ANM, ARM and AMM) is observed on the pulsatile model. These factors are more influential than AUH0, which is on the same sensitivity level in both models. This is mainly due to the
more realistic response of the pulsatile model to changes in afterload.
A) Original Guyton Model B) Pulsatile Model
Fig. 3: Morris sensitivity results for the arterial pressure obtained by the original (A) and pulsatile (B) models. The inputs are: HPL (hypertrophy effect on LV),
HPR (hypertrophy effect on RV), VP (plasma volume), VVR (basic venous volume), AUH0 (autonomic effect on heart strength), AUM (sympathetic
vasoconstrictor effect on arteries), ARM (non-muscle global autoregulation multiplier), AMM (muscle autoregulation multiplier), RBF (renal blood flow), VRC (volume of red blood cells), VV7 (vascular volume due to short-term stress relaxation), ANM (general angiotensin multiplier effect), PC (capillary pressure), AUY (sensitivity of sympathetic control of veins), VIM (blood viscosity effect on resistance), HMD (cardiac depressant effect of hypoxia)
IV.
S
IMULATION OF ANADHF
Figure 4 presents the main hemodynamic and regulatory variables represented in the proposed pulsatile model for the simulation of a stable HF state. At t = 24 hours of simulated time, parameter values Ees0 and Vd where reduced (Ees0,LV = 0.7 mmHg/ml,
Ees0,RV = 0.5 mmHg/ml and Vd,LV = 20 ml) to correspond to those observed from HF patients [14]. This reduced ventricular
function causes a sudden decrease of PA and cardiac output and a significant increase in atrial pressures and ventricular preload, leading to an accumulation of fluid on the systemic and pulmonary spaces. In order to compensate for this hemodynamic response, neurohumoral regulations are initiated with a fast autonomic modulation (AU), combined with the slower response of the renin-angiotensin system (ANM). A stable HF state is reached, with an increased sympathetic tone, fluid retention and reduced PA and cardiac output.
Fig. 4: Simulation of a heart failure state. PA (arterial pressure in mmHg), PRA (mean right atrial pressure in mmHg), QLO (cardiac output in l.min−1), VEC
Finally, the simulation of an ADHF event is shown in Figure 5. The simulation starts from a stable HF state obtained, for example, after implanting a CRT device. A sudden desynchronization of both ventricles (inter-ventricular delay = 200 ms) is simulated at time t = 5 min. This event reproduces a sudden loss of capture of the LV lead that can be observed on CRT patients due to lead displacement. The model response presents a decreased PA and a regulatory response which are in accordance with clinical observations [15].
Fig. 5: Simulation of a HF state. PA (mean arterial pressure in mmHg), QLO (cardiac output in l.min−1), AU (autonomic activity, ratio to normal).
V. DISCUSSION AND CONCLUSION
This paper presents an example of temporal multiscale integration in which the non-pulsatile ventricles of the original Guyton model are replaced by a pulsatile, elastance-based model of the cardiac function. In order to perform this integration, an interfacing method applied to couple these heterogeneous models is presented. Although the proposed model is already useful for analyzing the main interaction effects that may be considered for the development of new ADHF detection methods, it still has to be improved and validated. To that end, an initial validation of some model components, such as the reproduction of patient-specific trans-valvular flows for different CRT pacing configurations using the time-varying elastance model with pulsatile atria and ventricles [16], has been undertaken. Moreover, the proposed interfacing approach has been applied to integrate improved versions of other important components of the model, such as the renin angiotensin system [17]. The validation of the global, interconnected model is a challenging task, mainly because of observability limitations in long-term monitoring. The data captured from new-generation CRT devices will be useful to tackle this issue.
R
EFERENCES[1] K. Dickstein, et al., "ESC guidelines for the diagnosis and treatment of acute and chronic heart failure 2008," European Journal of Heart Failure, vol. 10, p. 933, 2008.
[2] M. Guéguin, et al., "Exploring Time-Series Retrieved From Cardiac Implantable Devices for Optimizing Patient Follow-Up," IEEE Transactions on
Biomedical Engineering, vol. 55, pp. 2343-52, 2008.
[3] R. L. Hester, et al., "Systems biology and integrative physiological modelling," The Journal of Physiology, vol. 589, pp. 1053-1060, 2011. [4] A. Guyton, et al., "Circulation: overall regulation.," Annu Rev Physiol, vol. 34, pp. 13-46, 1972.
[5] A. Hernández, et al., "A multiformalism and multiresolution modelling environment: application to the cardiovascular system and its regulation,"
Philosophical Transactions Mathematical Physical & Engineering Sciences, vol. 367, pp. 4923-4940, 2009.
[6] J. Montani and B. Van Vliet, "Understanding the contribution of Guyton's large circulatory model to long-term control of arterial pressure.," Exp Physiol, vol. 94, pp. 382–388., 2009.
[7] J. Werner, et al., "Simulation and prediction of cardiotherapeutical phenomena from a pulsatile model coupled to the Guyton circulatory model," IEEE
TBME, vol. 49, pp. 430-439, 2002.
[8] B. Smith, et al., "Simulation of cardiovascular diseases by including the autonomic nervous system into a minimal model.," Comput. Methods Programs
Biomed. , vol. 86, pp. 153–160 2007.
[9] O. Rompelman, et al., "Measurement in heart-rate variability: Part1 – Comparative study of hear-rate variability analysis methods.," Med. Biol. Eng.
Comput., vol. 15, pp. 233-9 1977.
[10] S. R. Thomas, et al., "SAPHIR: a physiome core model of body fluid homeostasis and blood pressure regulation," Philosophical Transactions of the Royal
Society, vol. 366, pp. 3175–3197 2008.
[11] V. Le Rolle, et al., "Model-Based Analysis of Myocardial Strain Data acquired by Tissue Doppler Imaging," Art Intel in Med, vol. 44, pp. 201-19, 2008. [12] Z. Michalewicz, Genetic algorithms + data structures = evolution programs. . New York, 1994.
[13] M. D. Morris, "Factorial Sampling Plans for Preliminary Computational Experiments.," Technometrics, vol. 33, pp. 161-174, 1991.
[14] C. Aroney, et al., "Linearity of the left ventricular end-systolic pressure-volume relation in patients with severe heart failure.," J Am Coll Cardiol., vol. 14, pp. 127-34, 1989.
[15] Z. I. Whinnett, et al., "Haemodynamic effects of changes in atrioventricular and interventricular delay in cardiac resynchronisation therapy show a consistent pattern: analysis of shape, magnitude and relative importance of atrioventricular and interventricular delay," Heart, vol. 92, pp. 1628-34, Nov 2006.
[16] K. Tse Ve Koon, et al., "Atrioventricular Delay Optimization in Cardiac Resynchronization Therapy Assessed by a Computer Model " in Computers in
Cardiology Belfast, Ireland 2010 p. 333−336.
[17] F. Guillaud and P. Hannaert, "A computational model of the circulating renin-angiotensin system and blood pressure regulation," Acta Biotheor, vol. 58, pp. 143-70, Sep 2010.