HAL Id: inserm-02893740
https://www.hal.inserm.fr/inserm-02893740
Submitted on 8 Jul 2020
HAL is a multi-disciplinary open access archive for the deposit and dissemination of sci-entific research documents, whether they are pub-lished or not. The documents may come from teaching and research institutions in France or abroad, or from public or private research centers.
L’archive ouverte pluridisciplinaire HAL, est destinée au dépôt et à la diffusion de documents scientifiques de niveau recherche, publiés ou non, émanant des établissements d’enseignement et de recherche français ou étrangers, des laboratoires publics ou privés.
Pooling individual participant data from randomized
controlled trials: Exploring potential loss of information
Lennard van Wanrooij, Marieke Hoevenaar-Blom, Nicola Coley, Tiia Ngandu,
Yannick Meiller, Juliette Guillemont, Anna Rosenberg, Cathrien Beishuizen,
Eric Moll van Charante, Hilkka Soininen, et al.
To cite this version:
Lennard van Wanrooij, Marieke Hoevenaar-Blom, Nicola Coley, Tiia Ngandu, Yannick Meiller, et al.. Pooling individual participant data from randomized controlled trials: Exploring potential loss of information. PLoS ONE, Public Library of Science, 2020, 15 (5), pp.e0232970. �10.1371/jour-nal.pone.0232970�. �inserm-02893740�
RESEARCH ARTICLE
Pooling individual participant data from
randomized controlled trials: Exploring
potential loss of information
Lennard L. van WanrooijID1*, Marieke P. Hoevenaar-Blom1,2, Nicola Coley3,4,
Tiia Ngandu5, Yannick Meiller6, Juliette GuillemontID7, Anna Rosenberg8, Cathrien R.
L. Beishuizen1, Eric P. Moll van CharanteID9, Hilkka Soininen8,10, Carol Brayne11,
Sandrine Andrieu3,4, Miia Kivipelto5,8,12,13, Edo Richard1,2
1 Department of Neurology, Amsterdam UMC, University of Amsterdam, Amsterdam, The Netherlands, 2 Department of Neurology, Donders Institute for Brain, Cognition and Behaviour, Radboud University
Medical Center, Nijmegen, The Netherlands, 3 Department of Epidemiology and Public Health, Toulouse University Hospital, Toulouse, France, 4 INSERM, University of Toulouse UMR1027, Toulouse, France,
5 Chronic Disease Prevention Unit, National Institute for Health and Welfare, Helsinki, Finland, 6 Department
of Information and Operations Management, ESCP Europe, Paris, France, 7 INSERM, University of Toulouse, Toulouse, France, 8 Department of Neurology, Institute of Clinical Medicine, University of Eastern Finland, Kuopio, Finland, 9 Department of General Practice, Amsterdam UMC, University of Amsterdam, Amsterdam, The Netherlands, 10 Neurocenter, Neurology, Kuopio University Hospital, Kuopio, Finland,
11 Department of Public Health and Primary Care, Cambridge Institute of Public Health, University of
Cambridge, Cambridge, United Kingdom, 12 Aging Research Center, Karolinska Institutet, Stockholm University, Stockholm, Sweden, 13 Karolinska Institutet Center for Alzheimer Research, Stockholm, Sweden
Abstract
Background
Pooling individual participant data to enable pooled analyses is often complicated by diver-sity in variables across available datasets. Therefore, recoding original variables is often necessary to build a pooled dataset. We aimed to quantify how much information is lost in this process and to what extent this jeopardizes validity of analyses results.
Methods
Data were derived from a platform that was developed to pool data from three randomized controlled trials on the effect of treatment of cardiovascular risk factors on cognitive decline or dementia. We quantified loss of information using the R-squared of linear regression models with pooled variables as a function of their original variable(s). In case the R-squared was below 0.8, we additionally explored the potential impact of loss of information for future analyses. We did this second step by comparing whether the Beta coefficient of the predic-tor differed more than 10% when adding original or recoded variables as a confounder in a linear regression model. In a simulation we randomly sampled numbers, recoded those<= 1000 to 0 and those>1000 to 1 and varied the range of the continuous variable, the ratio of recoded zeroes to recoded ones, or both, and again extracted the R-squared from linear models to quantify information loss.
a1111111111 a1111111111 a1111111111 a1111111111 a1111111111 OPEN ACCESS
Citation: van Wanrooij LL, Hoevenaar-Blom MP, Coley N, Ngandu T, Meiller Y, Guillemont J, et al. (2020) Pooling individual participant data from randomized controlled trials: Exploring potential loss of information. PLoS ONE 15(5): e0232970. https://doi.org/10.1371/journal.pone.0232970 Editor: Orestis Efthimiou, Universitat Bern, SWITZERLAND
Received: November 28, 2019 Accepted: April 24, 2020 Published: May 12, 2020
Copyright:© 2020 van Wanrooij et al. This is an open access article distributed under the terms of theCreative Commons Attribution License, which permits unrestricted use, distribution, and reproduction in any medium, provided the original author and source are credited.
Data Availability Statement: Data will be provided on a request accompanied by an analysis and research plan that has been approved by the HATICE Executive Management Board. Data used in this study are not freely available because of restrictions imposed by data providers and the ethical approval and research goals governing the study. Requests for data access would be subject to scrutiny by researchers from the steering groups of the individual studies. Applications will only be granted and data provided after agreement from our contributing providers and – if applicable
Results
The R-squared was below 0.8 for 8 out of 91 recoded variables. In 4 cases this had a sub-stantial impact on the regression models, particularly when a continuous variable was recoded into a discrete variable. Our simulation showed that the least information is lost when the ratio of recoded zeroes to ones is 1:1.
Conclusions
Large, pooled datasets provide great opportunities, justifying the efforts for data harmoniza-tion. Still, caution is warranted when using recoded variables which variance is explained limitedly by their original variables as this may jeopardize the validity of study results.
Introduction
The sample size in individual cohort studies and randomized controlled trials (RCTs) is often too small to answer specific (secondary) research questions. Pooling individual participant data (IPD) from multiple studies increases the sample size and statistical power to perform subgroup analyses and enable assessment of consistency of findings across different studies. To enable IPD meta-analyses it is necessary to harmonize data from different studies, which is often complicated by diversity across the available datasets.
Differences in data collection include, but are not limited to, data in multiple file formats and languages, the use of different instruments or scales to measure the same domains and use of different units of measurement. When syntaxes to recode data are developed ad hoc, with-out detailed information on the data collection procedure, misinterpretation may lead to a decrease of validity of the data [1].
For this reason much attention is given to state-of-the-art data harmonization techniques, as evi-denced by the development of software such as DataSHAPER and ViPAR [2,3]. These initiatives facilitate data pooling from different studies while overcoming differences in the collection of the data. Regardless of whether data harmonization is performed using specific software or by hand, lit-tle is known on the extent of information that is lost during the data harmonization process.
The aim of this study was to quantify the consequences of recoding variables for data pool-ing with regards to loss of information and the resultpool-ing loss of validity of study results. We therefore explored how much information was lost after recoding of variables, expressed as the proportion of the variance in the pooled variables that is explained by the data in the original datasets. We hypothesized most variance was lost when variables were recoded from continu-ous to discrete, which is in line with previcontinu-ous studies. We used data that were pooled from three clinical trials as well as simulated data to study our hypothesis. When a substantial loss of information occurred for a non-simulated variable, we additionally explored the potential impact on the validity of analyses outcomes. In a simulation study, we explored the influence of the range of continuous variables and ratio of dichotomous variables on information loss. Finally, we share all recoding schemes that we used for pooling variables relevant for research on cardiovascular risk factors and cognitive decline.
Methods
Data collection
Individual participant data from three recently completed RCTs on multi-domain interven-tions to prevent cognitive decline or dementia with a total of 6435 participants, were pooled.
PLOS ONE Pooling individual participant data from randomized controlled trials
- after ethical approval by the national Ethics Committees. For further enquiries, please contact Dr J.W. van Dalen ([email protected]). The datasets cannot be uploaded, but requests for data sharing will be evaluated by the respective data access committees of the three studies. Funding: This work was supported by the European Union’s Seventh Framework Program (FP7, 2007-2013) [grant number 305374] as part of the collaborative project HATICE (www.hatice. eu). The preDIVA trial was supported by the Dutch Ministry of Health, Welfare and sport (grant 50-50110-98-020), the Dutch Innovation Fund of Collaborative Health Insurances (grant 05–234), and the Netherlands Organisation for Health Research and Development (grant 62000015). MAPT was funded by the “Multimodal preventive trials for Alzheimer´s Disease: towards multinational strategies-programme: MIND-AD”. FINGER was funded by the Academy of Finland (291803) and VTR, Kuopio University Hospital (5772815).
Competing interests: The authors have declared that no competing interests exist.
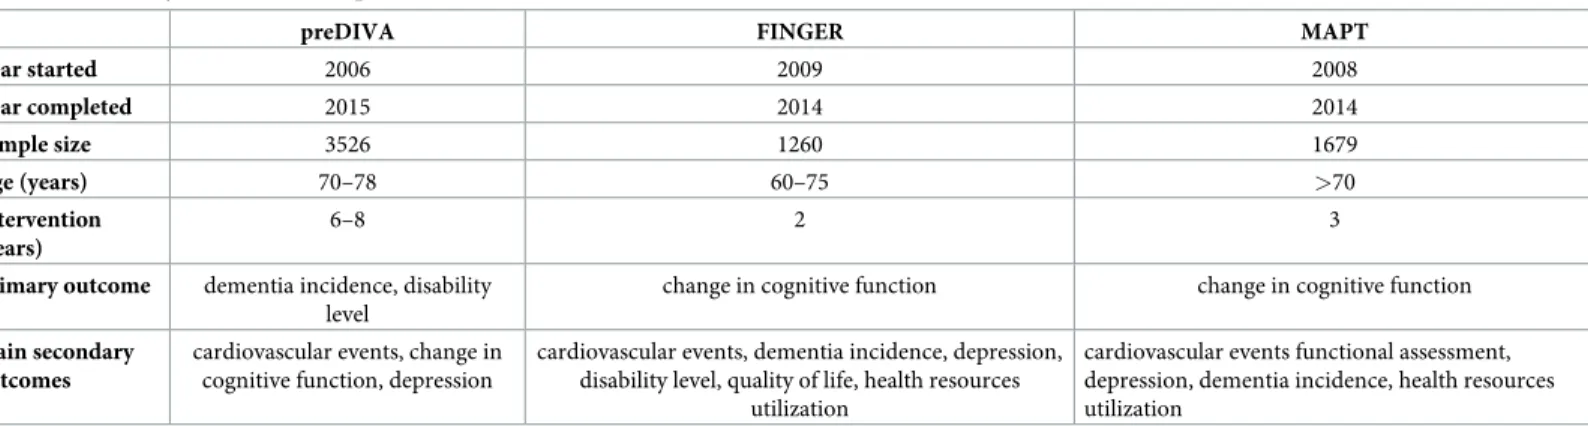
These were the Prevention of Dementia by Intensive Vascular Care trial (preDIVA, ISRCTN 29711771 [4]), the Finnish Geriatric Intervention Study to Prevent Cognitive Impairment and Disability trial (FINGER, NCT 01041989 [5]) and the Multidomain Alzheimer Preventive Trial (MAPT, NCT 00672685 [6]). The study teams of these three clinical trials collaborate in the HATICE consortium (www.hatice.eu), and are dedicated to share data amongst each other. All data had been pseudonymized prior to access for analysis. InTable 1the study char-acteristics are shown.
Recoding schemes
The pooled dataset consisted of 170 variables, of which 101 were available for the original FIN-GER subset of the database, 137 for the MAPT subset and 91 for the preDIVA subset. This sums to a total 329 recoding schemes that were necessary to create the pooled variables. For 238 recoding schemes an algorithmic transformation of the original variable was not necessary to create the pooled variable. We did not perform analyses for these recoding schemes, since these would be redundant by definition. This means we conducted analyses only for those 91 recoding schemes in which an algorithmic transformation of the original variable(s) was required to create the pooled variable. Three different algorithmic transformations were used: (1) Continuous variables that were recoded into discrete variables (Noriginal= 8); (2) Discrete
variables that were recoded into discrete variables with a different number or order of catego-ries (Noriginal= 44); and (3) Recoded variables that were based on multiple original variables
(Noriginal= 39).
Statistical analyses
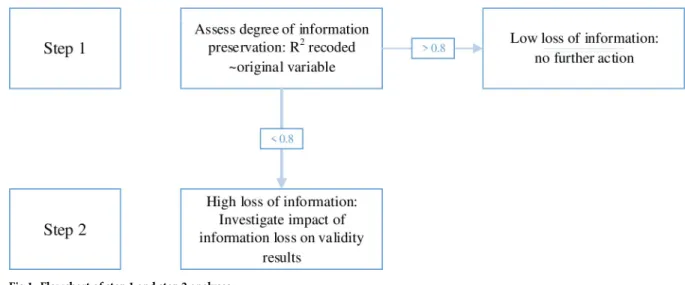
For the current analyses we focus on available baseline data. Handling missing data with con-text-free data encoding has been described previously [7,8]. We used a stepwise procedure to first quantify the information loss of pooled variables, and subsequently explored the potential impact on future analyses by using variables that had lost most information (Fig 1).
Step 1: We used linear regression models with the recoded variables as dependent variables and the original variables as independent variables and extracted the R-squared as measures for explained variance. In case a recoded variable was based on multiple original variables, we used these as predictors in a single linear regression model. When the R-squared was at least 0.8, an arbitrarily set threshold, we considered the amount of information that was lost accept-able, else we continued with step 2.
Table 1. Main study characteristics of pooled studies.
preDIVA FINGER MAPT
Year started 2006 2009 2008 Year completed 2015 2014 2014 Sample size 3526 1260 1679 Age (years) 70–78 60–75 >70 Intervention (years) 6–8 2 3
Primary outcome dementia incidence, disability level
change in cognitive function change in cognitive function Main secondary
outcomes
cardiovascular events, change in cognitive function, depression
cardiovascular events, dementia incidence, depression, disability level, quality of life, health resources
utilization
cardiovascular events functional assessment, depression, dementia incidence, health resources utilization
Step 2: To explore the potential impact of the information loss, in a linear regression model we assessed whether the Beta coefficient of an independent variable changed by more than 10% when using the pooled variable instead of the original variable as a confounder. A Beta coefficient is the degree of change in the dependent variable for each one unit increase of the independent variable [9]. This is analogous to commonly applied criteria for confound-ers [10]. For these regression models we chose an independent and dependent variable which we, based on literature, expected to be associated to each other as well as to the con-founder. Therefore, we used various independent and dependent variables for these step 2 analyses.
In our simulation study we randomly generated continuous variables and recoded these to dichotomous variables. For these simulated variables we explored how much information was lost with varying range of the continuous variable (type 1a), varying ratio of recoded ones to recoded zeroes (type 1b) and a combination of both (type 2). For all simulations we sampled two sets of numbers. The sampling method for the first set was the same across iterations, while the second set differed in range of continuous numbers, ratio of recoded ones to recoded zeroes (by differing sample sizes recoded to 1 while the amount recoded to 0 remained the same), or both. For the first set 1000 numbers between 0 and 1000 were sampled. For the sec-ond set we sampled K numbers between 1001 and N. For type 1a K was kept at a constant of 1000, while N was a factor of between 1 and 34 as high or low compared to 1000. Therefore, the lowest N was 1030 (1000/34+1001) and the highest N was 35001 (1000�34+1001). For type 1b N was kept at a constant of 1000, while K was a factor of between 1 and 34 as high or low compared to 1000. The lowest K was therefore 29 (1000/34) and the highest K 34000 (1000�34). For type 1a and 1b each of the 67 simulations (a factor of 1 as high or low is the
same) was replicated 100 times. For our type 2 simulations, all combinations of K and N from type 1a and 1b were used, therefore yielding 4489 (67�67) combinations. Each of these
combi-nations was replicated 10 times. With this latter simulation type we tested to what extent infor-mation loss caused by a difference in range for set 1 and set 2 numbers can be compensated for or exaggerated by varying the ratio of ones to zeroes. For all three types of simulations num-bers between 0 and 1000 were recoded to 0 and those above 1000 to 1. We then could use the same linear models as in the Step 1 analyses, in which the recoded zeroes and ones were the dependent variables and the sampled numbers the independent variables. From these models we again extracted the R-squared to explore to what extent the R-squared changed depending
Fig 1. Flowchart of step 1 and step 2 analyses. https://doi.org/10.1371/journal.pone.0232970.g001
on the difference in range of numbers, the ratio of ones to zeroes or a combination of both. The full syntax of this simulation is available in the supplement.
Normality and homoscedasticity of residuals have been checked for the linear regression models. The impact of violations of assumptions are discussed at the end of the results section. All analyses have been conducted using R Studio [11], specifically the built-in package ‘stats’ [12] for the linear models and the additionally loaded packages ‘ggplot2’ [13] and ‘gridExtra’ [14] for the visualizations.
Participants gave written informed consent prior to their baseline visit. The preDIVA study was approved by the Medical Ethics Committee of the Academic Medical Center, Amsterdam. The MAPT trial protocol was approved by the French Ethical Committee located in Toulouse (CPP SOOM II) and was authorized by the French Health Authority. FINGER was approved by the coordinating ethics committee of the Hospital District of Helsinki and Uusimaa.
Results
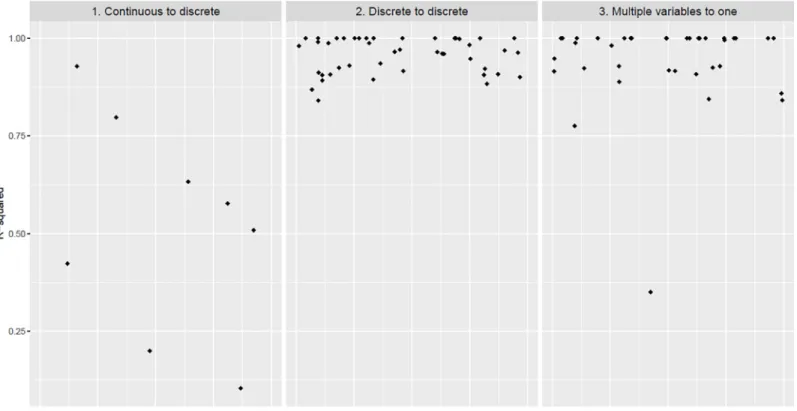
For the eight continuous-to-discrete recoded variables, the median R-squared of the regression models, as described as the first step of our analyses, was 0.54 (IQR: 0.37–0.67). For the 44 dis-crete-to-discrete recoded variables it was 0.97 (IQR: 0.92–1.00) and for the 39 multiple-to-sin-gle recoded variables 0.98 (IQR: 0.92–1.00) (Fig 2). All individual R-squareds and the recoding schemes, listed by content category, are provided in theS1 File.
Eight regression models yielded an R-squared of below 0.8. For these we performed explor-atory analyses as described for our step 2 method (Table 2). The Beta coefficient of the inde-pendent variable changed by more than 10% in four out of eight models depending on
Fig 2. Pooling accuracy for three data recoding categories. https://doi.org/10.1371/journal.pone.0232970.g002
whether recoded or original confounders were used. In other words, in half of the models the Beta coefficient changed considerably when using the recoded instead of original variables as confounders, which may lead to a different interpretation of the results.
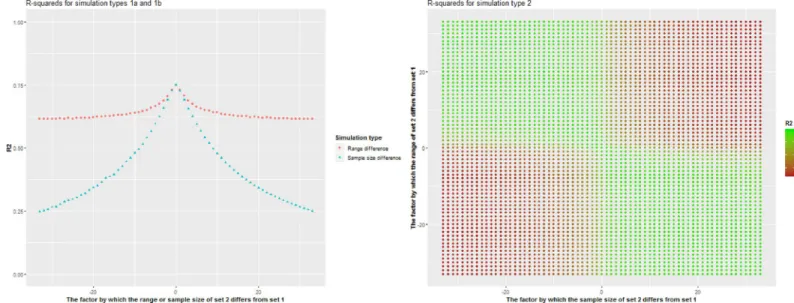
The type 1a simulation study, in which the range of numbers recoded to 1 differed from the range of numbers recoded to 0, yielded a median R-squared of 0.63 (IQR: 0.62–0.64). The median R-squared of the type 1b simulation, in which the ratio of ones to zeroes varied, was 0.38 (IQR: 0.30–0.51). This means the R-squared is more negatively impacted by differences in amount of ones compared to zeroes than by difference in ranges between numbers that were either recoded to 0 or 1. When combined, in type 2 of our simulation study, the median squared was 0.54 (IQR: 0.16–0.74). When the range of the set 2 numbers increased, the R-squared increased when the ratio of ones to zeroes decreased, while the R-R-squared decreased even more when the ratio of ones to zeroes also increased (Fig 3).
For most linear regression models the assumptions of normality and homoscedasticity of residuals were met. We exploratively assessed to what extent the R-squared changed when log-transformed dependent and independent variables were used instead of unlog-transformed vari-ables. We did this for all 91 linear regression models in which pooled variables were modelled that had not been pooled directly. We observed a median change of 0.03 (IQR: 0.00–0.06) and a maximum change of 0.27 in the R-squared when this procedure was used. This suggests using log-transformed variables for this purpose generally does not considerably alter the R-squared.
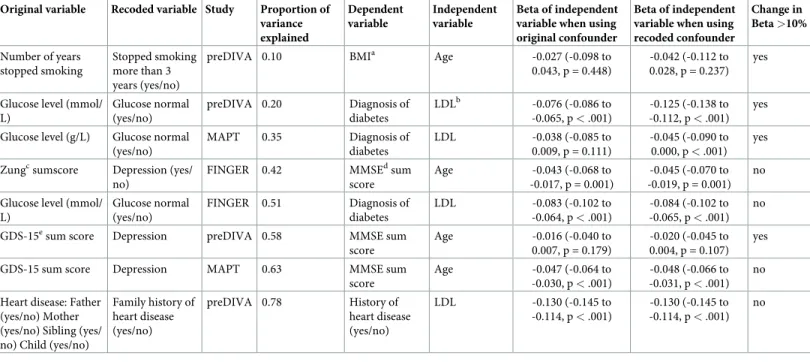
Table 2. Change of the beta coefficient of an association when using the recoded variable as a confounder compared to the original variable for the variables with less than 80% explained variance after recoding to assess the impact of information loss on the validity of associations.
Original variable Recoded variable Study Proportion of variance explained Dependent variable Independent variable Βeta of independent variable when using original confounder
Βeta of independent variable when using recoded confounder Change in Beta >10% Number of years stopped smoking Stopped smoking more than 3 years (yes/no)
preDIVA 0.10 BMIa Age -0.027 (-0.098 to
0.043, p = 0.448)
-0.042 (-0.112 to 0.028, p = 0.237)
yes
Glucose level (mmol/ L) Glucose normal (yes/no) preDIVA 0.20 Diagnosis of diabetes LDLb -0.076 (-0.086 to -0.065, p < .001) -0.125 (-0.138 to -0.112, p < .001) yes Glucose level (g/L) Glucose normal
(yes/no) MAPT 0.35 Diagnosis of diabetes LDL -0.038 (-0.085 to 0.009, p = 0.111) -0.045 (-0.090 to 0.000, p < .001) yes Zungcsumscore Depression (yes/
no)
FINGER 0.42 MMSEdsum
score Age -0.043 (-0.068 to -0.017, p = 0.001) -0.045 (-0.070 to -0.019, p = 0.001) no Glucose level (mmol/
L) Glucose normal (yes/no) FINGER 0.51 Diagnosis of diabetes LDL -0.083 (-0.102 to -0.064, p < .001) -0.084 (-0.102 to -0.065, p < .001) no GDS-15esum score Depression preDIVA 0.58 MMSE sum
score Age -0.016 (-0.040 to 0.007, p = 0.179) -0.020 (-0.045 to 0.004, p = 0.107) yes GDS-15 sum score Depression MAPT 0.63 MMSE sum
score Age -0.047 (-0.064 to -0.030, p < .001) -0.048 (-0.066 to -0.031, p < .001) no Heart disease: Father
(yes/no) Mother (yes/no) Sibling (yes/ no) Child (yes/no)
Family history of heart disease (yes/no) preDIVA 0.78 History of heart disease (yes/no) LDL -0.130 (-0.145 to -0.114, p < .001) -0.130 (-0.145 to -0.114, p < .001) no
aBody mass index blow-density lipoprotein
cZung Self-Rating Depression Scale dMini-Mental State Examination eGeriatric Depression Scale
https://doi.org/10.1371/journal.pone.0232970.t002
Discussion
In pooling data from three RCTs, recoding of 91 variables resulted in a loss of explained vari-ance of more than 20% in 8 variables. Most substantial loss was observed for variables that were recoded from continuous to discrete. Exploratory analysis suggested that the impact of recoded variables with substantial loss of explained variance on multivariate analyses might not be trivial.
To our knowledge, this study is the first to explore the degree of information in original data that is lost when harmonizing data, including analyses to assess potential consequences for the validity of findings using recoded variables from a pooled dataset. Although most of the recoded variables within the harmonized database appear to be valid and reliable, those vari-ables that lost a substantial part of the explained variance following their recoding should per-haps be left out of future analyses or be handled with caution. These include important areas of study that are measured as continuous such as cognitive and depressive symptomatology.
Using data dictionaries such as CDISC when designing studies is recommended. Within a specific research field, a certain level of harmonization of assessment instruments would also reduce the need for recoding. However, even if agreement will be attained, recoding variables is sometimes inevitable, for example when pooling data from trials from countries with differ-ent standard measures. Specific attdiffer-ention should be paid to assessing of the potdiffer-ential altered findings when analyzing data with variables that were recoded from a continuous to a discrete scale. We encourage other researchers conducting pooled analyses to include a quantification of the information that was lost due to the recoding process. Also, we recommend that when data has been recoded for a pooled analysis, the analysis should be repeated in the original dataset with both the original and the recoded variable, and results should be reported (at least in a supplement), to illustrate the impact of recoding. Using the R-squared of linear regression models is appropriate as a crude summary to quantify information loss of pooled variables. When the dependent variable is nominal, a linear regression may not be the appropriate
Fig 3. R2s for simulations in which numbers between 0 and 1000 are recoded to 0 and those above 1000 to 1. For all iterations, 1000 numbers between 0 and 1000 were sampled and recoded to 0. Numbers that were recoded to 1 originated from sampling numbers between 1001 and N with sample size K. Left: K was a constant of 1000, N was between 1 and 34 times as high or low as 1000 (simulation type 1a, red circles); N was a constant of 2001, K was between 1 and 34 times as high or low as 1000 (simulation type 1b, blue triangles). Right: N was between 1 and 34 times as high or low as 1000 and K was between 1 and 34 times as high or low as 1000 (simulation type 2).
analysis. For consistency and enhancement of comparability of the R-squareds as a crude sum-mary of information loss, we decided to use linear regression models for all types of recoded variables. More generally, this method may be less valid in case of violations of assumptions for linear models. However, exploratory analysis showed that using log-transformed variables instead of untransformed variables has only limited impact on the R-squared (median change in R-squared after transformation of all 91 non-directly pooled models: 0.03 (IQR: 0.00–0.06)). Adding the R-squared of key variables in pooled analyses in summary results allows readers to assess the full impact of harmonization of data on research findings.
The impact of data harmonization is most substantial in case a continuous variable is recoded into a dichotomous variable, as hypothesized. This in line with findings of previous studies [15,16] and followed both from our main analyses as well from our simulation study. Our different types of simulations showed that the R-squared is more influenced by differences in ratio of ones to zeroes than by differences in ranges between numbers that have been recoded to 0 or 1. Also, it followed that increasing differences in ranges between two sets, can be compensated for by decreasing the size difference between the two groups of numbers that have been recoded to either 0 or 1, and vice versa. We do not recommend excluding variables that have been recoded from continuous to dichotomous from pooled analyses for the purpose of increasing overall explained variance of pooled variables.
To conclude, large, pooled datasets provide important opportunities, justifying the efforts for data harmonization. However, caution is warranted when using recoded variables whose variance is poorly related to that of the original variables as this may jeopardize the validity of study results.
Supporting information
S1 File. Recoding schemes and R-squareds for all pooled variables. (DOCX)
Acknowledgments
The authors would like to thank the ‘Prevention of dementia by intensive vascular care’ (pre-DIVA) team, the ‘Finnish Geriatric Intervention Study to Prevent Cognitive Impairment and Disability’ (FINGER) team and the ‘Multidomain Alzheimer Preventive Trial’ (MAPT) team.
Author Contributions
Conceptualization: Lennard L. van Wanrooij, Marieke P. Hoevenaar-Blom, Yannick Meiller, Carol Brayne, Edo Richard.
Data curation: Marieke P. Hoevenaar-Blom, Nicola Coley, Tiia Ngandu, Yannick Meiller, Juliette Guillemont, Anna Rosenberg, Cathrien R. L. Beishuizen, Eric P. Moll van Charante, Hilkka Soininen, Carol Brayne, Sandrine Andrieu, Miia Kivipelto, Edo Richard.
Formal analysis: Lennard L. van Wanrooij. Funding acquisition: Edo Richard.
Methodology: Lennard L. van Wanrooij, Marieke P. Hoevenaar-Blom, Yannick Meiller, Carol Brayne, Edo Richard.
Software: Lennard L. van Wanrooij.
Supervision: Marieke P. Hoevenaar-Blom, Edo Richard.
Visualization: Lennard L. van Wanrooij.
Writing – original draft: Lennard L. van Wanrooij.
Writing – review & editing: Lennard L. van Wanrooij, Marieke P. Hoevenaar-Blom, Nicola Coley, Tiia Ngandu, Yannick Meiller, Juliette Guillemont, Anna Rosenberg, Cathrien R. L. Beishuizen, Eric P. Moll van Charante, Hilkka Soininen, Carol Brayne, Sandrine Andrieu, Miia Kivipelto, Edo Richard.
References
1. Fortier I, Raina P, Van den Heuvel ER, Griffith LE, Craig C, Saliba M, et al. Maelstrom research guide-lines for rigorous retrospective data harmonization. Int J Epidemiol. 2016; 0:1–13
2. Gaye A, Marcon Y, Isaeva J, LaFlamme P, Turner A, Jones EM, et al. Datashield: Taking the analysis to the data, not the data to the analysis. Int J Epidemiol. 2014; 43:1929–1944https://doi.org/10.1093/ije/ dyu188PMID:25261970
3. Carter KW, Francis RW, Carter KW, Francis RW, Bresnahan M, Gissler M, et al. Vipar: A software plat-form for the virtual pooling and analysis of research data. Int J Epidemiol. 2015; 45:408–416https://doi. org/10.1093/ije/dyv193PMID:26452388
4. Moll van Charante EP, Richard E, Eurelings LS, van Dalen J-W, Ligthart SA, van Bussel EF, et al. Effec-tiveness of a 6-year multidomain vascular care intervention to prevent dementia (prediva): A cluster-randomised controlled trial. The Lancet. 2016; 388:797–805
5. Ngandu T, Lehtisalo J, Solomon A, Leva¨lahti E, Ahtiluoto S, Antikainen R, et al. A 2 year multidomain intervention of diet, exercise, cognitive training, and vascular risk monitoring versus control to prevent cognitive decline in at-risk elderly people (finger): A randomised controlled trial. The Lancet. 2015; 385:2255–2263
6. Andrieu S, Guyonnet S, Coley N, Cantet C, Bonnefoy M, Bordes S, et al. Effect of long-term omega 3 polyunsaturated fatty acid supplementation with or without multidomain intervention on cognitive func-tion in elderly adults with memory complaints (mapt): A randomised, placebo-controlled trial. The
Lan-cet. Neurology. 2017; 16:377–389https://doi.org/10.1016/S1474-4422(17)30040-6PMID:28359749
7. Hoevenaar-Blom MP, Guillemont J, Ngandu T, Beishuizen CRL, Coley N, Moll van Charante EP, et al. Improving data sharing in research with context-free encoded missing data. PLoS One. 2017; 12: e0182362https://doi.org/10.1371/journal.pone.0182362PMID:28898245
8. Meiller Y, Guillemont J, Beishuizen CR, Richard E, Andrieu S, Kivipelto M. An is approach for handling missing data in collaborative medical research. Twenty-second Americas Conference on Information
Systems. 2016:1–10
9. Freedman DA. Statistical models: Theory and practice.: Cambridge University Press; 2009.
10. Lee PH. Is a cutoff of 10% appropriate for the change-in-estimate criterion of confounder identification?
Journal of Epidemiology. 2014; 24:161–167https://doi.org/10.2188/jea.JE20130062PMID:24317343
11. Rstudio: Integrated development for r. 2016
12. Team RC. R. A language and environment for statistical computing. 2019
13. Wickham H. Create elegant data visualisations using the grammar of graphics. 2016
14. Auguie B. Gridextra: Miscellaneous functions for "grid" graphics. 2017
15. Diniz MA, Tighiouart M, Rogatko A. Comparison between continuous and discrete doses for model based designs in cancer dose finding. PLoS One. 2019; 14:e0210139https://doi.org/10.1371/journal. pone.0210139PMID:30625194
16. Shaw DG, Huffman MD, Haviland MG. Grouping continuous data in discrete intervals: Information loss and recovery. Journal of Educational Measurement. 1987; 24:167–173