uNrvERSrrÉ
DUeuÉBnc
ÀRruousxl
Nature
et
origine
des
sédiments
de
surface
de
I'estuaire du
Saint-Laurent
mémoire présenté
dans le cadre du programme de maîtrise en océanographie
eu vue de I'obtention du srade de maître ès science
PAR
O
MATTHIEU
JAEGLE
Composition du
jury
:Urs Neumeier, président du
iury,
UQAR-ISMBR
Guillaume St-Onge, directeur de recherche,
UQAR-ISMBR
Jean-Carlos Montero-Serrano, codirecteur de recherche,
UQAR-ISMBR
Patricko Lajeunesse, codirecteur de recherche, U.Laval
John T. Andrews. examinateur externe. INSTAAR. Université du Colorado
UNIVERSITE DU QUEBEC A RIMOUSKI
Service de la bibliothèoue
Aveftissement
La diffusion de ce mémoire ou de cette thèse se fait dans le respect des droits de son auteur,
qui a
signéle
formulaire <<Aulorisation
de
reproduireet
de
dffiser
un
rapport,
unméntoire
ou
une thèse >>.En
signantce
formulaire, I'auteur concèdeà
I'Université du Québec à Rimouski une licence non exclusive d'utilisation et de publication de la totalité olr d'une partie importante de son travail de recherche pour des fins pédagogiques et non commerciales. Plus précisén,ent, I'auteur autorise l'Universitédu
Québec à Rimouski àreproduire, diffuser, prêter, distribuer ou vendre des copies de son travail de recherche à des
fins non commerciales sur quelque support que ce soit,
y
compris I'Internet. Cette licenceet cette autorisation n'entraînent pas une renonciation de la part de l'auteur à ses droits moraux
ni
à ses droits de propriété intellectuelle. Sauf entente contraire, l'auteur conserve la liberté de diffuser et de commercialiser ou non ce travail dontil
possède un exemplaire.Je ne suis pour
toi
qu'un renard semblableà
centmille
renards. Mais, si tu m'apprivoises, nous aurons besoinI'un de
I'autre.Tu
seraspour
moiunique
au
monde.Je
seraipour
toi unique au monde...Le
petit
prince
-
Antoine Saint-ExupéryREMERCIEMENTS
Je
tiens
en
premier
lieu
à
remercierGuillaume
St-Ongepour
la
qualité
sonencadrement, sa disponibilité, ses nombreux conseils et opportunités offertes au cours de ma maitrise. Mais surtout,
je
tiens à souligner sa capacité à transmettre sa passion pour la sédimentologie, véritable clé de voute pour la réussite d'une maitrise. Je souhaite également remercier chaleureusement Jean-Carlos Montero-Serrano pour sa gentillesse exemplaire, pour avoir rejoint l'équipe en cours de route et pour avoir donner un nouvel élan au projet. Mes remerciements vont également àPatrick
Lajeunesse pour son encadrement et pourl'accessibilité au
N/R
Louis-Edrnond-Hamelin. J'aimerais également apporter toute magratitude
à
Urs
Neumeierpour
l'évaluationde mon
mémoireet
également pour
les nombreuses discussions scientifiques partagées lors de oours ainsi que pour la confiance accordée lors de la mission stage en 2013. Je remercie aussi le membre externe de monjury
d'évaluation, professeur John T. Andrews.Je souhaite également remercier I'ensemble des personnes ayant rendu mon projet et mes travaux de terrain possibles.
Merci à Adrien
Bénard, capitainedu
Louis-Edmond-Hamelin
et
merci
à
I'ensemblede
l'équipagedu
N/R
Coriolis
II.
Merci
à
Alexandre Normandeau, Gabriel Joyal, Marie-Pier St-Onge et Jacques Labrie pour votre aide sur le terrain ou en laboratoire.Merci
à
l'ensembledu
laboratoirede
géologieet
autres compèresde
I'ISMER, Quentin, Elissa, Pierre-Arnaud, Audrey, Julie, Kevin, Gab, Mélany, Étienne, Colette pour vos précieux conseils, vos sourires et vous encouragements,Merci
pour les bières et les cafes partagés quandla
motivationn'était
plusà
son maximum. Je souhaite égalementVincent, Leuth, Flora pour m'avoir supporté au cours de ma maitrise, pour avoir rendu ma vie extrascolaire si aisée avec une ambiance merveilleuse.
Mes derniers remerciements s'adressent
à
mes parents,à
ma sæuret
ma copine, merci d'avoir toujours cru en moi et d'avoir écouté mes interminables questionnements(
existentielles )) sur le sable.nÉsumÉ
La
composition minéralogique,les
propriétés magnétiqueset la
distribution granulométrique des sédiments de surface de I'estuaire du Saint-Laurent ont été étudiéesafin
d'associerla
nature des sédirnents marins avec les caractéristiques géologiques desprincipales rivières adjacentes, La comparaison de ces propriétés et I'utilisation de I'analyse
en composantes principales ont permis de discriminer deux sources distinctes
:
la
Côte-Nord et la Rive-Sud. La Côte-Nord se caractérise par une forte teneur en feldspath et une intensité magnétique élevée, alors que la Rive-Sud présente des concentrations plus élevées
en
phyllosilicateset
en
quartz,
ainsi qu'une
intensité magnétiqueplus faible.
La discrimination de ces deux sources reflète les differentes lithologies du substratum rocheux respectif : (1) les roches métamorphiques et ignées du Bouclier canadien sur la Côte-Nord, et (2) les roches sédimentaires appartenant aux Appalaches sur la Rive-Sud. Les sédimentsmarins
d'eaupeu
profonde
échantillonnésle
long
de
la
Côte-Nord présentent uncomportement magnétique et une composition rninéralogique similaire aux roches terrestres adjacentes. Des variations sont par contre observées dans le milieu marin profond (200-300 m, chenal Laurentien) avec une diminution en quartz et plagioclases et une augmentation en
mica et en argile, ainsi qu'une diminution de la susceptibilité magnétique par rapport aux sédirnents côtiers. Ces propriétés sont également associées à une dirninution de la taille des
grains, reflétant des conditions hydrodynamiques plus faibles dans
le
chenal Laurentien. D'autre part, les sédiments échantillonnés le long de la marge sud sont caractérisés par despropriétés inattendues, avec une composition minéralogique et des propriétés magnétiques
plus
proches des échantillons Côte-Nordque
des échantillonsde
la
Rive-Sud. Cetteobservation pourrait refléter des épisodes de transport glaciaire ou glaciel qui transporterait
du n'ratériel précambrien,
tel
que suggéré par différentes études antérieures soulignant la présence de blocs précambriensle
long de la Rive-Sud. L'ensemble des résultats suggère que la Côte-Nord est la principale source d'alimentation en sédiments de I'estuaire et dugolfe
Saint-Laurent.Les
variationsde
composition observéesen milieu marin
sontd'oligines hydrodynamiques et la Rive-Sud ne contribue que faiblement dans le système.
Ces observations sont en accord général avec les débits des rivières actuelles dans I'estuaire du Saint-Laurent, qui sont plus importants pour la Côte-Nord qus pour la Rive-Sud.
Mots clés : sédiments, n-rinéralogie, magnétisme, provenance, estuaire et golfe du Saint-Laurent
ABSTRACT
Mineralogical composition, magnetic properties, and grain size distribution of surface sediment samples from
the
St. Lawrence Estuary (eastern Canada) were investigated inorder
to
constrain present-day sediment provenancein
the
marine
environment inagreement
with
the geological characteristicsof
the main rivers. The intercomparisonof
these
propertiesand
the
application
of
principal
component analysis enabled thediscrirnination
of
two
distinct
sources.The
North-Shore sourceis
characterized by increased feldspar content and high values of the magnetic properties, whereas the South -Shore source exhibits higher concentrationsof
phyllosilicatesand
quartz, and weaker magnetic property values. The discriminationof
thesetwo
sources reflects the differentbedrock lithologies predominant
in
both
shores:(l)
the
Grenvillian metamorphic and igneous rocksof
the Canadian Shield on the North-Shore, and(2)
the Early Palaeozoic sedimentary rocks belonging to the Appalachians Mountains on the South-Shore. Shallow water marine sediments sampled along the North-Shore depict a magnetic behavior and amineralogical composition
similar
to
the
adjacent terrestrial coastal rocks. However,different properties can be observed in the deep marine Laurentian Channel (200-300 m) sediments with a decrease
in
quartz and an increase in mica and clay, as well a decrease in magnetic susceptibility compared to coastal sediments. These properties are also associatedwith
a decreasein
grain size, possibly reflecting weaker hydrodynamic conditionsin
the deep Laurentian Channel. On the other hand, the shallow water sediments sampled alongthe
South-Shoreare
characterizedby
unexpected properties,with
a
mineralogical composition and magnetic properties closer to the compositionof
the North-Shore ratherthan
the
South-Shore source.This
observationcould reflect
pastor
recent ice-rafting episodes which transported Precambrian material from the Northto the
South-Shore, assuggested
by
several previous studies highlightinga
significant numberof
Precambrian blocs and pebbles along the South-Shore. Finally, our results suggest that the North-Shoreis
the
primary
source-areaof
present-day terrigenous sedimentsin
the
St.
Lawrence Estuary,with the
South-Shore contributing weaklyto
the
global sedimentation. These observations arein
general agreementwith
the
present-dayriver
dischargesin
the
St.Lawrence Estuary, which are more important on the North-Shore than on the South-Shore.
TABLE
DESMArÈnns
REMERCIBMENTS.
...ixnÉsutvtÉ
...xi48STRACT...
TABLB
DESMATIÈR8S...
...xvLISTE
DESTABLBAUX...
...xviiLISTE
DESFIGURES...
...xixTNTRODUCTION
CÉNÉnAlE
...
...1CHAPITRE
1TRACING SEDIMENT
SOURCBSIN THE
ST.LAWRBNCB
ESTUATY (EASTERNCANADA) FROM
MINBRALOGICAL
AND\{AGNETIC
SIGNATURES
...111.1
INrRooucuoN...
.,.,,.,..,.,...121.2
GBolocrcAl
SBTTTNG
...13Geology
...13Sedimentology...
... 14Hydrology
...151.3
MlrnRrrl
AND METHoDS...
... 16 SampleCollection
...16Analytical
techniques
...18Statistical approach: compositional
biplot
...201.4
Rrsums...
...21Sediment grain
size..
...21XVI
Intercomparison of the
bulk
mineralogy, grain size and magnetic properties1.5
Drscusston
...39Two distinct sources related to the adjacent
geology
...39Provenance of the marine
sediments..
...401.6
CoNcr,ustoN...
...44CHAPITRE 2
CONCLUSION...
....,.41LISTE DES TABLEAUX
Table
l.
PCA scores for North-Shore and Souh-Shoresamples
...28LISTE
DESFIGURES
Figure
L
Localisation de lazone d'étude et des échantillons associés. L'ensemble deséchantillons sont divisés en cinq régions
:
Côte-Nord (bleu foncé), Côte-Sud (vert foncé), Marge-Nord (bleu clair), Marge-Sud (vert clair), et chenal Laurentien (rouge).La
zone d'étude est bordée par deux formations géologiques differentes. Au nord, leBouclier canadien avec la province de Greenville (orange), et au Sud, la chaine des
Appalaches
(Jaune)...
...4Figure 2. Navire de recherche Coriolis IL
...
...8Figure 3. Échantillonnage à bord du navire de recherche Louis-Edrnond-Hame1in...8
Figure 4. Vue d'une flèche littorale à l'embouchure d'une rivière de la Côte-Nord...9
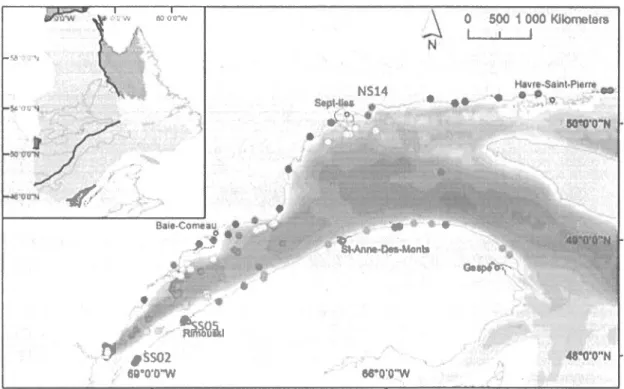
Figure 5. Location of the study area.
All
the samples were divided into five regions according to their geographic position: North-Shore (darkblue),
South-Shore (dark green), North-Margin(light
blue), South-Margin(ligth
green), and the Laurentian Channel (red). The study area is boarded by two distinct geologic provinces with the Greenville province (Orange) in the North and the Appalachian province in the South (Yellow). Figure6.
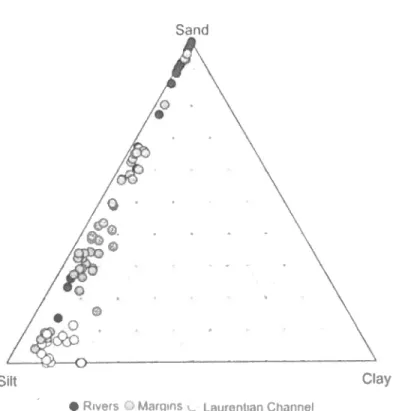
Sand,silt
and clay ternary diagramof
the studied surface sediments. The grain size distribution of the Laurentian Channel sediments consits of fine silt (white circles). Margins are composed of sand and silt (grey circles). River sediments consist of sand and coarse silt (blackcircles).
...22Figure
7.
Box
plotsof
the minerals presentin
the different regions (North-Shore, South-Shore, North-Margin, South-Margin, LaurentianChannel).
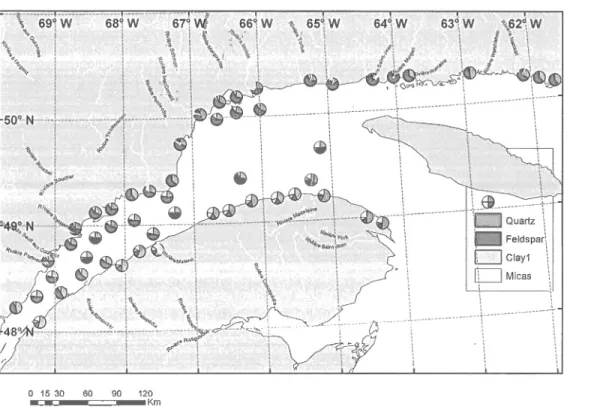
...24Figure 8. Map of pie charts for quartz, feldspar (alkali and plagioclase), mica and clay content
in
the St. Lawrence Estuary andGulf.
(Samples located too closeto
each other were removedto
improve thelisibility
of the frgure and avoid overlappingof
data...
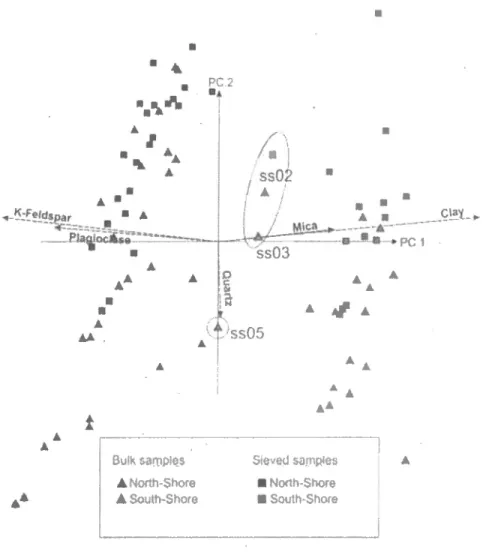
...25Figure 9. Biplot of the
PCI
versus PCZ of the main minerals from the North-Shoreand the
South-Shore
'...'...28Figure 10. Biplot of the
PCI
versus PC2 of the main minerals from The North-Shore, North Margin, Laurentian Channel, SouthMargin
and South-Shore. '.."...'...'...30Figure 11. Hysteresis loops and high-temperature dependent magnetic susceptibility heating (black) and cooling (grey) curves
for 3
representative samplesin
South-Margin sample, in Laurentian Channel sample and in North-Margin sample. For the hysteresis measurements, the grey curve reflects the raw data and the black curve the
corrected data.
...
'.'.-...'.33Figure 12. Day
plot for
North-Shore (dark blue), South-Shore (dark green), and all marine sediments (red). Adapted from Day (1977). North-Shore and marine samples are perfectly aligned on a mixing line suggesting a common magnetic assemblage...34Figure 13. Comparison
of
the magnetic properties (k,ARM, IRM,
SIRM) befween the different environments. The North-Shore source is characterizedby high valuesof
the magnetic properties such as magnetic susceptibility, anhysteretic, isothermal and saturated isothermal remanent magnetizations, whereasthe
South-Shore exhibitsweaker magnetic property
values.
...35Figure 14. Comparison
of IRM
demagnetization curves. The red curve illustrates classical demagnetization faciesin
the
study area. Black continued curves depictsmall gyroremanance
for the
Sept-Iles marine sediments, wheras the black dashed curve hints at a very strong GRM for the Moisie River Deltasediments.
...36Figure 15. Intercomparison
of
marine (red), North-Shore (blue) and South-Shore (green) sediments. PC2 versus grain size(A); PCI
versus grain size'(B); Grain size versus magnetic susceptibility(C);
grain-size versus magnetic suceptibility (D). Regression lines and equations are calculatedfor
all
samplesih
A
andC
and formarine samples only in B and
D...
..'...'...38INTRODUCTION GENERALE Problématique
Une définition usuelle pour décrire un estuaire provieirt de Pritchard (1967)
:
<< Anestuary
is a
semi-enclosed coastal bodyof
water which have afree
connectionwith
the open sea and within which sea water is measurably diluted with fresh water derived fromland drainage >. Un estuaire se définit donc comme une zone de mélange entre le milieu terrestre et le milieu marin ouvert. Cette transition rapide entre ces deux domaines distincts
se traduit par une
variabilité
drastique dansles
processus physiques, chimiques et biologiques influençant directementla
sédimentologiedu milieu
tel
que les vitesses de sédimentation,la
taille
des grains,la
naturedu
sédirnentet
les
possibles structures sédimentaires associées(Dalrymple
et
Choi,
2007).
De
plus, les
fortes
vitesses de sédirnentationen lien
avecles
apports terrigènes importantsfont de
cesmilieux
devéritables archives climatiques à haute résolution (Dalryrnple
et
al, 1992). Autrement dit,l'étude de
la
dynamique sédimentaireen milieu
estuarienest
riche en
information, complexeet
feral'objet
de ce mémoire. D'autre part, les études surla
provenance dessédiments sont elles aussi d'un grand intérêt en sédimentologie, car elles nous renseignent d'une paft sur
l'origine
des sédiments, et d'autre part sur les conditions de transport et de déposition (e.g., Nesbitt etal.,
1996; Morton and Hallsworth, 1999). Ce type d'études, enparticulier l'approche quantitative, connaissent un véritable essor grâce à l'avancement des
technologies (Welje and Eynatten, 2004). Dans ce contexte,
la
diffraction des rayonsX
(XRD)
est reconnue commeun
outil
efficace pouridentifier et
quantifier I'assemblageminéralogique
d'un
échantillon
brut
de
sédiments.Il
s'agit donc d'une
méthode performante pour les études de provenance (e.g., Eberl, 2004; Andrews et al.,2011; Dou etal.,2014). Moins communément utilisé, le magnétisme environnemental est également un
Maher and
Thompson,1999; Watkins and Maher, 2003; Zhang
et
al.,
2008).
Le magnétisme environnemental connait aujourd'hui un essor certain, car outre son efficacité,cette approche est non destructeur et relativement rapide
(Liu et
al., 2012). L'aspect non destructeurde
la
méthode estun point clé
de cette maitrise:
il
favorise les approches <<multi-proxy> malgréune
quantitélimitée de
matérielet m'a
permisde
coupler la spécialité de deux de mes directeurs.Le Saint-Laurent, un candidut d'exception
Les
caractéristiques physiographiquesde
l'estuairedu
Saint-Laurentfont de
cesystème un candidat idéal pour une étude sur la provenance des sédiments. Premièrement, lazone d'étude (Figure
l)
est bordée par deux formations géologiques differentes en âge et en composition.Au
nord, le Bouclier canadien avec la province de Greenville (2,65 Ga à 970 Ma), et au Sud,la
chaine des Appalaches (570Ma
à 275Ma)
(Piper et a1., 1990). Cette opposition drastique est un atout précieux pour une étude de provenance, car les deux potentielles sources d'alimentation sont de natures et de lithologies différentes et sont donc théoriquement discriminables. Deuxièmement,le
Saint-Laurent est caractérisépar
une dynamique sédimentaire complexe favorisant les variations de composition associées autransport.
Au
sein
de
I'estuaire,les
vitessesde
sédirnentationsont
spatialement très variables:
la
tête
du
chenal
Laurentienest une
zone
d'accumulation sédimentaire importante où les vitesses d'accrétion atteignent 0,70 cmlan (Smith et Schafer, 1999) et où une épaisse séquence sédimentaire de plus de 450m a
été identifiée (Duchesneet
al.,2010). Ces vitesses sont ensuite réduites le long du chenal Laurentien et ne dépassent pas
les 0,2 cm/andans le golfe du Saint-Laurent.La granulométrie des sédiments de surface est
également extrêmement variable reflétant I'impact marqué des processus hydrodynamiques
et
gravitaires (Pinetet
al.,
2011). L'estuaire est également caractérisé par une érosion côtière significative, de grands systèmes de dérive littorale (Bernatchez et Dubois, 2004; Bernatchez etal.,
2012)et
une prédisposition aux risques naturels (e.g., St-Onge et al.,20ll).
De
plus,
certains canyonset
chenaux bordantla
Côte-Nord exacerbent cette dynamiqueen
favorisantle
transfertde
sédimentsdu
domaine côtier aumilieu
marinprofond (Gagné
et
al,2009;
Normandeauet
al., 2013). Par ailleurs,la
grande amplitude thermique de l'eau de surface avec des températures inferieures à OoC en hiver permet la création de glace de mer saisonnière (Saucier,2003; de Vernaletal.,20ll).
Cette glace de mer peut déplacer des sédiments de toute taille allant du bloc métrique à l'argile et participe ainsi au budget érosion/déposition annuel (Dionne, 1988; Drapeau et a1.,1990; Neumeier,2011).
Le
retraitde
I'Inlandsis laurentidien estun
dernier attrait pour une étude sur le traçage des sources sédimentaires, car les icebergs ont transporté une grande quantité dematière précambrienne jusqu'à la Rive-Sud entre 10 000 et 13 000 avant aujourd'hui (e.g., Dionne et Potras, 1998., Dionne, 2007). La Rive-Sud devient donc également une source secondaire de matériel précambrien et peut possiblement les redistribuer vers
le
milieu marin. Finalement, ces deux principales sources potentielles sont drainées par des basins versantsde tailles très
différentes.Le
débit
total
des rivièresde la
Côte-Nord étant beaucoup très supérieur au débittotal
des rivièresde
la
Rive-Sud (Centre St-Laurent, ree6).* f,r;r!,,.r}:-,ri A lrrc @ Eo rlc 1f, - r----,{/t.dt r tli;r,.!]rl .i:tê1ili.it..È.ilts;r f.!:r ;.: li'-? I | ! .. f t i :
Figure
l.
Localisation de lazone d'étude et des échantillons associés. L'ensemble des échantillons sont divisés en cinq régions : Côte-Nord (bleu foncé), Côte-Sud (vert foncé), Marge-Nord (bleuclair),
Marge-Sud (vert clair),et
chenal Laurentien (rouge).La
zoned'étude est bordée
par
deux formations géologiques différentes.Au
nord,le
Bouclier canadien avecla
province de Greenville (orange), et au Sud,la
chaine des Appalaches (Jaune).Objectifs
Considérant les caractéristiques sédimentaires actuelles
de
la
zone d'étudeet
lesgéologies adjacentes,
une
étude
sur
la
provenancedes
sédimentsde
l'estuaire
estprimordiale afrn de caractériser les
flux
sédimentaires. L'objectif principal de cette maitrise est donc de déterminerla
minéralogie etle
comportement magnétique des sédiments desurface de l'estuaire du Saint-Laurent et de ses possibles sources adjacentes.
L'hypothèse à tester est que le couplage de données minéralogiques et magnétiques permet de discriminer I'opposition drastique entre le Bouclier canadien et les Appalaches ainsi que de caractériser la contribution de chacune de ces sources dans les sédiments de
surface du chenal Laurentien et sur les marges adjacentes.
De façon plus spécifique, les objectifs sont de :
Mesurer et analyser les propriétés magnétiques et la composition minéralogique des
sédiments de surface des sédiments de l'estuaire du Saint-Laurent afin
d'v
décelerdes variations spatiales;
Mesurer et analyser les propriétés magnétiques et la composition minéralogique des
sources potentielles de sédiments afin de les discriminer;
Adapter
et
améliorer une méthode de traceurs baséesur
la
combinaisonde
la composition minéralogiqueet
du
comportement magnétique des sédiments pour caractériserles
flux
sédimentaires alimentant auiourd'hui I'estuairedu
Saint-Laurent.Organisation du mémoire et communications scientifiques
Ce mémoire est présenté sous la forme d'un article scientifique rédigé en anglais et qui sera soumis prochainement à la revue internationale Marine Geologt.
Jaegle,
M.,
St-Onge,
G.,
Montero-Serrano,J-C.,
Lajeunesse,P.
sera
soumis prochainement.Tracing
sediment sourcesin
the St.
Lawrence Estuary (eastern Canada) from mineralogical and magnetic signatures. Marine geologt.Par ailleurs, au cours de ma maîtrise,
j'ai
présenté mes travaux à quelques reprises aux congrès ci-dessous :Jaegle,
M.,
St-Onge, G., Lajeunesse, P.,2013. Nature andorigin of
magnetic minerals presentin
the St. Lawrence Estuary. Poster lors du congrès annuel des étudiants duGEOTOP, 1-3 fevrier 2013, Wentworth-Nord, Qc.,Canada.
Jaegle,
M.,
St-Onge, G., Montero-Serrano, J-C., Lajeunesse,P.,2014.
Tracing sediment sourcesin
the
St. Lawrence Estuaryfrom
mineralogical and magnetic signatures. Présentation orale lorsdu
congrès annuel des étudiantsdu
GEOTOP, 14-16 marsMéthodologie et
contribution
C amp ag nes d' éc It antillo nnag e
Contenu de son étendue spatiale, ce projel de maitrise m'a offert des opportunités de 5 campagnes d'échantillonnage.
Au
cours de l'été 2012, deux missions en mer auxquellesj'ai
participé, ont été réalisées dans l'estuaire du Saint-Laurent a{in d'échantillonner dessédiments de surface aux abords de
la
Côte-Nord.La
première mission,à
bord du N/R CoriolisII
(Figure2),
m'a principalement permis de récolter des échantillons en milieu relativement profond. La deuxième mission à bord du N/R Louis-Edmond-Hamelin (Figure 3) m'a permis d'échantillonner des sédiments de surface en eau peu profonde à I'aide d'une benne grâce au faible tirant d'eau du navire. Au cours de l'été 2013, une nouvelle mission à bord du N/R Louis-Edmond-Hamelin m'a permis d'étoffer ma base de données. Cependant, les conditions de mer ayant été particulièrementdifficile,
cette troisième missionn'a
pas permis d'échantillonner les sédiments tant convoités au large dela
rivière Moisie et de récolter des données à l'aide du magnétomètre marin.J'ai
également profité des missions stages de2012 (en tant qu'étudiant) et de 2013 (en tant qu'auxiliaire d'enseignement) pourrécolter
de
nouveaux échantillonsde
surface, notammentaux
abordsde la
Rive-Sud, Finalement, deux campagnes d'échantillonnage enmilieu
terrestreont
été effectuées àl'été2013 pour échantillonner les potentielles sources à I'embouchure des rivières le long de la Côte-Nord et de la Rive-Sud (Figure 4).
Figure 2. Navire de recherche Coriolis II.
10
Analyses de laboratoire et contribution
L'ensemble des analyses de laboratoire ont été effectuées par mes soins à I'exception
de
6
analyses granulométriques(MSl1-17,
MSll-19,
MSll-20 MSll-23
MSll-24,
MS11-25)
effectuéespar les
étudiantsde
la
mission
stagede
2011.
Les
mesuresgranulométriques ont été réalisées
à
I'aide du granulomètre laser Beckman Coulter LS-13320 deI'ISMER.
Les propriétés magnétiques ont été mesurées dansle
laboratoire de paléoniagnétisme du professeur Guillaume St-Onge à I'aide du magnétomètre cryogéniqueSRM-755 de 2G Enterprises, du magnétomètre
à
gradient alternatif MicroMag 2900 dePrinceton Measurements
Corp.
et
de
la
sondede
susceptibilité magnétique Bartington MS2. La minéralogie par diffraction des rayonsX
a été réalisée dans le nouveau laboratoire du professeur Jean-Carlos Montero-Serrano avec un diffractomètre à rayonsX
PANalyical X'Pert. Finalement, la rédaction et l'ensemble des figures del'article
ont été réalisés par mes soins et révisés par mes trois codirecteurs et co-auteurs de cet article : Guillaurne St-Onge (ISMER), Jean-Carlos Montero-Serrano (ISMER) et Patrick Lajeunesse (Université Laval).Écoles d'été
Au
cours de ces deux années de maitrise,j'ai
également eu la chance de participer àdes
formations externesau
programme.En
2012,j'ai
participé
à
une
école
d'été internationale organisée par IODPÆCORD/GEOTOP à Montréal. Cette formation a permis de me familiariser avec les outils et techniques usuels en géologiemarine. En2013,
j'ai
suivi une formation organisée par I'Université de Minneapolis (États-Unis). Cette école
d'été
spécialiséen
magnétisme environnementalm'a
permis
de
développer desconnaissances spécifiques dans ce domaine, me permettant ainsi
de
mieux appréhendermon sujet de
maitrise.
Outre les
connaissances scientifiques acquiseslors
de
cesformations, ces expériences ont été des opportunités uniques de rencontrer des chercheurs du monde entier travaillant avec les mêmes outils dans des projets connexes.
CHAPITRE
1TRACING SBDIMENT
SOURCESIN THE
ST.LAWRENCE
ESTUARY
(EASTERN
CANADA)
FROM
MINBRALOGICAL
AND
MAGNETIC
SIGNATURES
Matthieu
Jaeglet't,
Guillaume St-Onge 1'3, Jean-Carlos Montero-serrano 1'3, PatrickLajeunesse
'''
I
Canada Research Chairin
Marine Geology, Institut des sciences de la mer de Rimouski(ISMER), Université du Québec à Rimouski
'Centre d'études nordiques,
&
Eépartement de géographie, Université Laval3
GPOTOP Research Center
Highlights
First source to sink approach in the St. Lawrence Estuary and Gulf.
Coupling of mineralogical composition, magnetic properties and grain size. Identification of the maior sediment sources.
Abstract
Mineralogical composition, magnetic properties, and grain size distribution of surface sediment samples from
the
St. Lawrence Estuary (eastern Canada) were investigated inorder
to
constrain present-day sediment provenancein
the
marine
environment inagreement
with
the geological characteristicsof
the main rivers. The intercomparisonof
these
propertiesand
the
applicationof
principal
component analysis enabled thediscrimination
of
two
distinct
sources.The
North-Shore sourceis
characterized by increased feldspar content and high valuesof
the magnetic properties such as magnetic susceptibility, anhysteretic, isothermal and saturated isothennal.remanent magnetizations,I2
whereas
the
South -Shore source exhibits higher concentrationsof
phyllosilicates and quartz, and weaker magnetic property values.The
discriminationof
thesetwo
sources reflects the different bedrock lithologies predominantin
both shores: (1) the Grenvillian metamorphic and igneous rocksof
the Canadian Shield on theNorth
Shore, and (2) the Early Palaeozoic sedimentary rocks belonging to the Appalachians Mountains on the South Shore. Shallow water marine sediments sampled along the North Shore depict a magneticbehavior
and
a
mineralogical compositionsimilar
to
the
adjacent terrestrial coastal sediments. However, different properties can be observedin
the deep marine Laurentian Channel (200-300 m) sediments with a decrease in quartz and an increase in mica and clay,as
well
a
decreasein
magnetic susceptibility comparedto
coastal sediments. These properties are also associatedwith a
decreasein
grain size, possibly reflecting weaker hydrodynamic conditions in the deep Laurentian Channel. On the other hand, the shallow water sediments sampled along the South Shore are characterizedby unexpected properties,with a mineralogical composition and magnetic properties closer to the composition of the
North
Shore rather thanthe
South-Shore source.This
observation could reflect past or recent ice-rafting episodes which transported Precambrian material from the North to the South Shore, as suggested by several previous studies highlighting a significant numberof
Precambrian blocs and pebbles along the South Shore. Finally, our results suggest that theNorth
Shoreis
the primary source-areaof
present-day terrigenous sedimentsin
the
St. I.awrence Estuary, with the South Shore contributing weakly to the global sedimentation. These observations are in general agreement with the present-day river discharges in the St. Lawrence Estuary, which are more important on the North Shore than on the South Shore.I.l
ININONUCTIONTracing
the
provenanceof
sedimentsis
one
of
the most
studied subjects in sedimentology and is crucial to a complete understanding of the various factors controllingcomposition of basin
fill,
such as parent lithology, weathering, transport, and depositionof
sediments (e.g, Nesbittet
a1.,1996; Morton and Hallsworth, 1999). Moreover, the tracing of sources has been intensively developed due to advancements in measurement technology13
(Welje
and Eynatten, 2004).In
this
approach,X-ray
diffraction
(XRD) is a
versatile techniqueto
identify and quantify the mineral assemblagesof
matrix sediment samples. These mineralogical data areuseful
in
determiningthe
surface sediment provenance, sediment dispersal, and paleoclimate variability (e.g., Eberl, 2004; Andrewset
al., 2073;Dou
et
al., 2014).In
addition,bulk
grain size analyses have also been usedto
decipher changes in sediment sources and transport processes (e.g.,Xu
et a1.,2009; Andrews et al.,20ll;
Dietze et al., 2012; Hein et al., 2013; Andrews and Vogt, 2014). Similarly, previous studies have shown that the magnetic properties of the sediments can also be used to trace sediment sources (e.g., Thompson and Oldfield, 1986; Watkins and Maher, 2003; Zhang et al., 2008). Magnetic analysesof
sediments are a powerful tool because the techniques areefficient, nondestructive, and sensitive
to
fine variationin
mineralogy, concentration and grain size of magnetic minerals (Liu et a1.,2012).In
this
study,the
mineralogical composition, magnetic properties, and grain size distributionof
surface sediment samples frorn the St. Lawrence Estuary and Gulf (eastern Canada) and adjacent rivers were investigated and integrated in order to constrain present-day sediment provenance in this large marine system.1.2
GnolocrcAI,
SETTTNGGeology
The St. Lawrence Estuary and
Gulf
is
boardedby two
distinct geologic provinces(Piper,
1990):the
Greenville Provinceof
the
Canadian Shieldto
the North
and the Appalachian Province to the South. These two geologic provinces are drastically differentin
age and petrographic composition. The Canadian Shield consistsof
Precambrian and Cambrian igneous and metamorphic rocks, whereas the Appalachians mainly consistof
Paleozoic sedimentary rocks (Hocq, 1994 and Dubé, 1994). Moreover, according
to
the geological mapof
Quebec (Thériault and Beauséjour,2012), the Greenville province is characterized by a medium to high degreeof
metamorphism and composed principallyof
14
granitoids (granite, gneiss and migmatite), whereas the most common rocks on the South-Shore are sandstone, mudrock and conglomerate.
In
addition, there are many anorthosite intrusionsin
the
Greenville province,which
increasesthe variability
of
the
study area(Hocq, Igg4). The Sept-Îles area is
for
example oneof
the major intrusive suitesin
the Canadian Shield (Guillou-Frottieret
a1., 1995; Higgins and van Breemen, 1998; Higgins, 2005). The mafic Sept-Îles Intrusive Suite (SIIS) comprises the Precambrian and Cambrian igneous and metamorphic rocks of the Grenville province and is composed of anorthosite, gabbros, monzogabbros and otherFe-Ti
oxide rocks. Moreover, a concentrationof
iron placers has been located in this area (Hein et al., 1993)'Sedimentology
The St.
Lawrence Estuaryand
Gulf
is
a
key
location
for
paleoenvironmental reconstructions dueto
its very thick Quaternary sediment sequence and its position at the margin of the former Laurentide Ice Sheet during the last glaciation and deglaciation. (e.g., Syvitski and Praeg, 1989; de Vernalet
al., 1996; Shaw et a1.,2006; St-Onge et al., 2008; St-Onge and Long, 2009; Barlettaetal.,2010; Duchesne et al., 2010). Also, these differentglacial periods created
a
deep incision (>300m)
calledthe
Laurentian Channel which incises the Estuary andGulf
from Tadoussacto
the Cabot Strait (Figure 5). Today, this estuaryis
characterizedbyhigh
sedimentation rates reaching0.70
cm/yr at the headof
Laurentian Channel (Smith and Schafer, 1999). Moreover, an increasein
sedimentation rates is observed from the late Holocene to the present day (St-Onge et a1., 2003). Likewise,significant coastal erosion and longshore drift are repofted in various studies (Bernatchez et Dubois, 2004; Bernatchez et Fraser, 2012). Some submarine canyons and channels have been reported as contributing
to
sediment transport from the coastto
the deeper marine environment (Gagnéet
aI.,2009; Normandeau et al., 2013; Normandeau et a1.,2014). The seafloorof
the region is characterizedby
a
great variabilityin
grain size and landforms,including megadune and mass transport deposits (Pinet
et
a1.,2011).The
Laurentian Channel is mainlyfilled of
fine
silts, whereas its margins,in
shallow water, are mainlyl5
composed of coarser sediments varying from sands to fine silts. The grain size distribution
of these sediments can be explained by the turbulence from the tides and waves which are stronger
in
shallow waters (Pinetet
a1.,2011).A
first
study aboutthe
provenanceof
surficial sediments by semi-quantitative X-ray analysis was conducted by Loring and Nota (1973). According to these authors, coarse surface sediments (>50 pm) of the Laurentian Channel system are essentially derived from the Canadian Shield and are mainly composed
of
plagioclase (44Yo), k-Feldspar (16%)and
quartz (30%), Moreover, the St. Lawrence Estuaryis
proneto
geohazards.Different
geomorphological and geophysical evidence suggests the recurrence of slope instability and possible tsunamis throughout the Holocene (Cauchon-Voyer et al., 2008; 2011; Campbell et a1.,2010; Poncet et a1.,2070; St-Onge etal.2011). Finally, sea ice is another parameter influencing the sedimentary dynamics. The St. Lawrence Estuary is considered as a sub-arctic region with temperatures below freezing
during winter, allowing the fonnation
of
sea ice (Saucier, 2003; Anne de Vernalet
al., 2011). Sea ice plays a major role in nearshore sediment dynamics in the estuary.It
has the capacityto
transport sedimentsof all
sizes from clayto
boulders and participatesto
the regional erosion budget (Drapeau et al., 1990). Studies have shown that the displacementof
debris along the shore can be annual, even for boulders which can move for short distance
(Dionne, 1988;
Neumeier,20ll).
Lithologic studies mentioned the great concentrationof
Precambrian boulders and pebble in the intertidal zone of the South-Shore of the estuary
which implies that they have been ice-rafted from the North. Because most boulders are found
in
glacial marine clay deposits, the transport of these blocs and pebbles is related to active ice rafting episodes during the retreat of marine-based ice sheet whick took place in the region betweenl3
and 10 ka (Dionne 1998, 2007, Occhretti et al., 201l).Hydrology
According
to
St. Lawrence Center (1996), large rivers from the North-Shore and the South-Shore contribute to the global water and sediment transport in the study area. Major difference in water discharse is noticeable between these two shores. The main rivers of theT6
North-Shore are characterized by a combined mean annual discharge of 3250 mi/s of water, whereas on the South-Shore, combined annual mean discharge is only <150 ml/s.
1.3 MarnnIEL AND METHoDS
Sample Collection
A
totalof
80 marine surface sediment samples were collected from the St. Lawrence Estuary (Figure 5 and Table in background dataset). The surface sediments were obtained from box core and Van Veen grab samplers. Occasionally, surface sediments were obtained from a trigger weight core when the surface was perfectly conserved. Surface samples weremainly sampled on board the
R/V
CoriolisII
between 2002 and 2012, bttt some shallowwater samples were collected from the
R/V
Louis-Edmond-Hamelinin
the
summersof
2012
and2013.
The
sedimentswere
collectedat
different
depthsand
in
differentenvironments (coastal, deep marine. canyons). Tn order
to
identify the different sedirnent sources in the St. Lawrence Estuary and Gulf, 42 bedload samples r,vere also collected atthe mouth
of all
the rivers between Tadoussac and Natashquanfor
the North-Shore and between Trois-Pistoles and Gaspé for the South-Shore (Figure 5 and Table 1 in background dataset). Samples were collected near the mouthsof
rivers, where sediments represent a mixture of materiel from the drainage basin that is transferred to the marine environment. Some isolated samples also came from beaches. To avoid localized hydrodynamic effects, each sample consistsof
a
combinationof 4 or 5
sites that were spaced several tensof
meters. The samples were divided into five regions according to their geographic position: (1) North-Shore and (2) South-Shore, corresponding to terrestrial and river sediments fromthe North and
South geologic
provinces;(3)
North-Margin
and
(4)
South-Margin, comprising rèlatively shallow marine sediments from either side of the Laurentian Channel; and (5) the Laurentian Channel, which includes deep water sedimentsin
the Laurentian Channel itself.t7
Figure
5.
Locationof the
study area.All
the
samples were dividedinto five
regions accordingto
their
geographicposition:
North-Shore(dark
blue),
South-Shore (dark green), North-Margin (light blue), South-Margin (ligth green), and the Laurentian Channel (red). The study areais
boardedby two
distinct geologic provinceswith
the Greenville province (Orange) in the North and the Appalachian province in the South (Yellow).l8
Analytical techniques
XRD
measurements were carriedout on bulk
samplesof
terrestrial and marine sediments. Terrestrial sediments were also sieved at< 63 prn. This fraction was analyzed inorder
to
gain
a
better
understandingof
grain
size
dependency.Before
the
bulkmineralogical analysis and
in
orderto
isolatethe
detrital
fractionfrom the
sediment samples, organic matter and biogenic carbonate were removedwith
l0
ml
of peroxide and 10ml
of
hydrochloric acid, respectively.Next,
sediment samples were groundwith
aMcCrone micronizing
mill
with agate grinding elements to obtain a consistent grain sizeof
<10 pm by using 10 mL of ethanol and grinding times of 5-10 min to obtain a homogenous powder. The slurry \ /as oven dried overnight at about 60"C and then slightly homogenizedwith an agate mortar to avoid the possible agglomeration
of
finer particles during drying. The random powder samples were side-loaded into the holders and analyzed by XRD using a PANalyticalX'Pert
Powder diffractometer. This instrument is fittedwith
a copper tube (Cu K-alpha=
1.54178Â), operating at 45kV
and 40mA
and. a post-diffraction graphite monochromator. Samples were scanned from 5o to 65o two-theta in steps of 0.02o fwo-theta and a counting time of 2 seconds per step.For the
semi-quantificationof
the'major
mineralogical components,the
bulk sedimentXRD
scans obtained were processed in the software package X'Pert High-Score Plus (PANalytical) using the Rietveld full-patternfitting
method. This method permits the semi-quantificationof
whole-sediment mineralogywith
a
precisionof
5
-
l0
%
for phyllosilicates and 5 %o for grain rninerals. The quality of the Rietveld fitting procedure wasevaluated
for
two
statistical agreement indices: R-profile and goodness-of-fit (GOF).R-profile quantifres the difference between the observed and calculated patterns, whereas the GOF is the ratio between R-weighted profile (RWP; best least square
fit
between observed and calculated patterns) and R-expected theoretical (Rexp; best possible valuefor
the residual). R-values profile between 20-30 o and GOF less than 3 are typically adequate int9
rnineralogical components that were quantified
by
this technique are: quartz, potassiumfeldspar (rnicrocline
*
orthoclase), plagioclase feldspar(albite
+
anorthite), amphibole (homblende), pyroxene (augite), magnetite, hematite, pyrite, and phyllosilicates (biotite,muscovite,
illite,
chlorite,
smectite,and kaolinite).
The
phyllosilicatesgroup can
beseparated into three sub-groups according
to
the basal spacing(or
d-values)of
the sheet silicate families: micasl0 Â
(biotite, muscovite,illite),
clay 14Â
(chlorite, smectite), and kaolinite 7 Â.For magnetic measurements, samples were prepared by packing sediments into
non-magnetic
8
cm3plastic
cubes.
Measurementsof
the low field
volumetric magneticsusceptibility
were
carriedout with
a
BartingtonMS2
at
low
frequency(kt).
Lowfrequency magnetic susceptibility
is
the
most
widely
used magnetic property. This parameter reflects the contribution of different kind of rnagnetic behavior of minerals suchas
ferrimagneticmineral
(e.g., magnetite) antiferromagnetic minerals(e.9.,
hematite), paramagneticminerals
(e.g.,
silicate)
and
diamagneticminerals
(e.g.
quartz).
Low frequency susceptibilityis
thus an efficient proxyto
observed variationin
the magnetic concentrationand
compositionof
sediments(Liu et
al.,
2012).
Different
magnetic remanence measurernents were also acquiredin
orderto
identify
and characterize the magnetic concentration, mineralogy and grain size: anhysteretic remanent magnetization(ARM),
isothermal remanence magnetization(lRM)
and saturated isothermal remanent magnetization(SIRM)
measurements. TheARM, IRM
andSIRM
were measured after progressive altemating field (AF) demagnetization from 0 to 80 mT in 5 mT steps using a2G Enterprises SRM 755 cryogenic magnetometer. For susceptibility versus temperature experiments-,
a
small
quantityof
sediment was air-dried beforethe
measurement andmeasured using a Bartington MS2 high temperature apparatus. This measurement is used to deterrnine the Curie ternperature of the samples, which allows determining the mineralogy
of the magnetic carrier (Tauxe,2010). Finally, hysteresis properties were measured using
an
alternating gradientforce
magnetometer(AGM)
MicroMag 2900
from
Princeton Measurements Corporation on some representative samples. The shape of the loop and the derived properties (Ms,Mrs,
Hc,Hcr)
reflect the magnetic mineralogy, the domain state20
and
the
magneticparticle size (Day
et
â1,,1977; Tauxe, 2010).
For
hysteresis measurements,to
obtain stable results, the coarse terrestrial sediments were previously sieved at63 pmGrain size analyses
of
sediment samples were performedwith
a Beckman CoulterLSl3320 laser sizer on wet bulk sediment. Prior to measurement, sediments were sieved at
2
mm. The distribution parameters reported here - mean (pm), sorting and sediment grain-size composition(%)
of
clays(<2
pm), silts
(2-63
pm),
and sands(>63 pm)
-
were extracted usingthe GRADISTAT
4
software(Blott
and Pye, 2001). Calculations were achieved using the geometric method of the moments.Statistical approach: compositional
biplot
The
mineralogical data obtained areof
a
compositional nature,that is, they
are vectorsof
non-negative values subjectedto
a constant-sum constraint. Namely, they aremeasured in units like wt.% (weight percent). This fact implies that relevant information is contained in the relative magnitudes, so statistical analysis must focus on the ratios between
components (Aitchison, 1986). The suitability of the log-ratio approach for the analysis
of
data representing parts of a whole is supported from a theoretical viewpoint as well as from a practical one (see e.g., Weltje, 2002; von Eynatten,2004; Barbera et a1.,2009; Tolosana-Delgado and von Eynatten, 2009). The covariance biplot is used here as a graphical tool for exploring the relationships between the different variables and samples. The axes
of
the biplot correspond to the first two principal components (PCs) of the log-centered data, and both the samples and the components are simultaneously represented. Similar componentsare clustered together into a single part in the biplot. More details on the interpretation of a
compositional biplot are discussed in von Eynatten et al. (2003) and Montero-Serrano et al. (2010).
All
statistical calculations (log-ratio transform and biplot) were conducted with2l
1.4
Rnsulrs
Sediment grain size
Sediment samples are characterized by unimodal or bimodal grain-size distribution in most cases. The sediment grain-size composition
of all
samples is illustrated on a ternary diagram (Figure6).
The Laurentian Channel margins depicta
greatvariability
and aremainly composed
of
sandto
siltwith
mean values included betweenl0
pm and 480 pm.The grain
size distributionof
the
Laurentian Channel sedimentsis
more constant andmainly consits
of
finesilt with
mean values ranging between5
pmto
l8
pm. Terrestrial sediments are relatively coarse and composed of sand and silt with mean values betweenl6
22
Rivers O Margins O Lsurenlian Channel
Figure 6. Sand,
silt
and clay ternary diagramof
the studied surface sediments. Thegrain size distribution
of
the
Laurentian Channel sediments consitsof
fine silt
(white circles). Margins are composedof
sand andsilt
(grey circles). River sediments consistof
sand and coarse silt (black circles).23
Bulk
mineralogical compositionThe
five
main minerals presentin
our
samples are: quartz (15-59 o/o), potassium feldspar (1-22 %), plagioclase (12-65 Yo), mica (2-37 %), and clay (0-24%),
However, several other minerals were also frequently foundin
smaller quantities, such as pyroxene, amphibole, magnetite, hernatite and calcium carbonate. Fe-Ti oxide content shows a highvariability (0 Yo
to
14 o/o), whichwill
be discussed below (Figure 7). Biogenic carbonateswere
removedby
acid
treatment,while
dolomite
was
not
detectedin
the
XRDdiffractograms in the studied samples due to its low content. Figure 8 illustrates the spatial
distribution
of
quartz, feldspar, clay and micain
the formof
pie charts.To
improve the readability some closely-spaced samples were removed. Great variability between the two shores andthe
deep marine environment areas can be observed andwill
be described below.24 North-Shore T
F
'l
? tvFlo
T-I-ô
Elô-I-_
o ^TIIE
=-t
I X 'T-N0rth-Margln -IUËËEË
t +-'- urtEr$ltFd({rÊ le$td vùtut
Ùilrd qinrilâ to3,7596) ...
i mtl6 Ût& 03 + t.5'(o8411
I I arsr ntçxec ttmlbâ{ lon G
t|€frai ""'::
ç .,.-' tsgfi ûBn or . t.5IOg.O{
nr{sndr.or.259É}
-''
. +,,- .or,ÉÊrFigure
7.
Box plots of the minerals present in the different regions (North-Shore, South-Shore, North-Margin, South-Margin, Laurentian Channel)...'h'g'
'*'P'.8
sËËsssËËËE
25
o-gryP,n
Figure 8. Map
of
pie
chartsfor
quartz, feldspar(alkali
and plagioclase), mica and clay contentin
the St. Lawrence Estuary andGulf.
(Samples locatedtoo
closeto
each other were removed to improve thelisibility
of the figure and avoid overlapping of data.26
Composition
of
the
teruestrial
samplesBox-plots
of
the
42
bedloadriver
sediment samples reveala
drastic difference between the North and the South-Shores (Figure 7). Plagioclase and K-feldspar are more abundant along the North-Shore whereas clay, mica and quartz are more present along the South-Shore. Pyroxene, amphibole, magnetite and hematite are regularly presentin
limited percentages along the North-Shore and almost entirely absent from the South-Shore. To gain a better understandingof
the mineral composition andto
distinguish each shore, aprincipal component analysis (PCA) was conducted using the centered log-ratio method
(Aitchison, 1986) (Figure 9). Only the
five
most dominant minerals (quartz, mica, clay, plagioclase and K-feldspar) were consideredin
this
statistical approach.This
analysis indicates that thePCI
is positively associated with clay and mica and negatively associatedwith K-feldspar and plagioclase, while the PC2 is negatively associated with quartz (Table
2).
The PCA results clearly distinguishfwo
clusters: the North-Shore and South-Shore sources. Greater K-feldspar and plagioclase content along the North-Shore and greater mica and clay content along the South-Shore is very pronounced along thePCI
and can be usedto
effectively distinguish thetwo
sources. Moreover, comparison between thebulk
andfiner fraction along the PCZ reveals that
the
qvaftz contentis slightly
reducedfor
both shores in the <63 pm fractionSamples SS02 (muddy foreshore near Trois-Pistoles) and SS03
(tidal
march near Rimouski) located on the South-Shore, are very interesting samples because they indicate arelative increase in total feldspar content and a relative decrease in total phyllosilicate and quartz content compared to the adjacent rivers (Figure 9). This composition approaches that
of the North-Shore samples despite its geographic position. Unlike the other samples, these
samples were
not
collectedfrom
a river or
exposed beach,but
ratherfrom a
muddy foreshore area.Similarly,
sample SS05 (collectedin
a
beach behind thetidal
marchof
Rimouski)
yield a
similar situationwith
a
composition more typicalof
the North-Shore samples.27
Sample
NS14 (Moisie
River
Delta)
is
anotheroutlying
sample,having
a
bulk compositionrich in
Fe-Ti
oxides.NSl4
has 15%of
magnetiteand
l2Yoof
hematite. Another sample (NS15) was collected 3 km upstream from the Moisie River Delta sample and its composition is totally different and shows a weak hçavy mineral content, suggesting the increase in Fe-Ti oxides in the delta occurs over a short distance.28 I
I
I.T
at
^
PC.2il
A,
t
t
I Irl
-]i.î
-i
o"t'
PC.tI
l
a^
A^^
1Ât!
I
Bulh sampfe-s Sievqd,sa,qçlesI
Nofih-Shor€I
South-Shorei
t*nn-snor"
l'
Soulh-ShoreFigure 9. Biplot of the
PCl
versus PC2 of the main minerals from the North-Shore and the South-ShoreTable 1. PCA scores for North-Shore and Souh-Shore samples
l
tl
PC1 PC2Quatn
X-spar0.0082
-0,5503-0.8896
0.2860 Plag -0.4147 0.1431 Mlca 0.2949 0.2202Clay
Cum.Prop.Exp.0.6619
0.91130.2403
0.955629
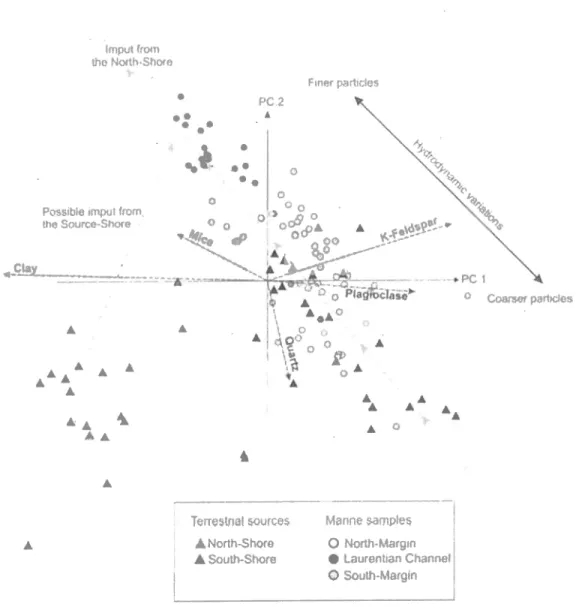
Composition of marine sediments and comparison with tewestrial sources
The
PCA
of
the bulk
mineralogical dataof
marine and terrestrial sediments also reveals severaldifferences between the North and the South-Shores (Figurel0).
Indeed, the PC1 is positively associated with K-feldspar and plagioclase and negatively associated withclay and mica, while the PC2 is negatively associated with quartz and positively associated
with
feldspar and clay (Table 3). Figurel0
illustrates a clusterof
South-Shore sediments and a more extensive group, cornprising North-Shore sediments, North-Margin sediments, South-Margin sediments and Laurentian Channel sediments, suggesting a relative similarityin composition between all these sectors compared to the South-Shore cluster. According to the PCA analyses and box plots (Figure 7 Figure
l0),
the North-Margin sediments depict a mineralogical composition similar to the adjacent terrestrial sediments. However, variations can be detected for the sediments farthest offbhore, as illustrated by a decrease in quartz and plagioclase content, and an increasein
rnica content. K-feldspar content doesnot
show clear variation, mean values are conserved. The same patternof
variation can be more easily observed in the deep marine Laurentian Channel sediments with a decrease in quartz and plagioclase content, and an increase in mica and clay content. South-Margin sedimentsare
very
closeto
thoseof
the North-Marginin
composition,with
only
a
few
samples showing relatively lower plagioclase content and relatively high mica content.30 lmÊ,rl ftom ûrB North-Snore l. Finer padicles
'1E..
'tl.
û o a aeat
oPossibl€ tnpul f'om.'
lhe Source.-Shoce . o
e
ôo
tfp"^
^^i
^
r1
^^
quemPCl
0.0730PCe
-0.8198A
:'o
-
e.r-?
;''" o
."
"t
^t:.
^^ llX-spar Plag
Mlca0.4923
0.3935
-0.21690.46æ -0.0618
0.3038Clay
Cum.Frop.Exp.-0.7rt1!t
0.82240,1æ9
4.9U7iI
"'i.
^.
Isrrgsl{inl.spsrÊgs MarinçsampfeîÂNorlh€hore
Q È{orth-ùtarginÀSouùrshors I
Laurentbn Chetrpl-
O South.ll|arginFigure 10. Biplot of the
PCl
versus PC2 of the main minerals from The North-Shore, North Margin, Laurentian Channel, SouthMargin
and South-Shore.Table 2.PCA scores for all samples
4
\.
\g,
31
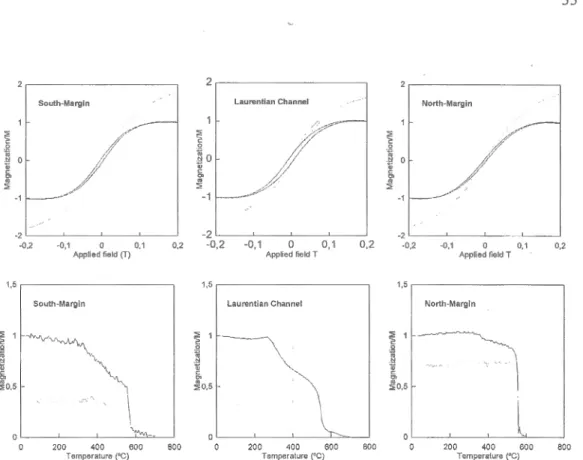
Magnetic properties
Magnetic properties are also used
to
distinguish significant differences between thetwo
shores andthe
marine environment. Accordingto
the
hysteresisloop from
three representative samples (Figure1l),
the assemblage of the magnetic grains of NS2 (North-Shore), SS4 (South-Shore) and COR0503-40 (Laurentian Channel)is
dominatedby
low coercivity minerals as indicatedbythe
saturation of the IRM acquisition below 300 mT. In addition, the thermomagnetic curve obtained from theses sample illustrates a sharp dropof
nagnelization at about 580"C which correspondsto
the Curie temperatureof
magnetite(Figure 11), suggesting magnetite as the dominant magnetic carrier.
A
continuous loss in susceptibilityis
also visiblefrom
300"C.
This
decreasein
magnetic susceptibility from300'C could be associated
with
the alterationof
maghemite to hematite (Dearing, 1999). This is especially noted in Laurentian Channel sediment and South-Shore sediment becausethe magnetite signal is weaker.
A
Day-plot (Figure 12)is
usually usedto
determine the domain state and magnetic grain size of samples (Dayet
al., 1977).In
our study, because the terrestrial samples were sieved at 63 pmto
obtain stable resultswith
the alternating gradient force magnetometer, the results cannot be directly compared in terms of grain sizechanges with the other bulk samples from the marine environment. Nonetheless, Figure
l2
reveals a trend where North-Margin and Laurentian Channel samples are perfectly aligned
on
a
mixing line
suggestinga
cornrnon magnetic assemblage dorninatedby
magnetite. South-Shore samples also show a trend, butit
is slightly shifted to the right of theNorth-Margin/marine
trend.
This
trend, along
with
the
hysteresisloop and
temperature experiment, indicate the predominanceof
magnetite as the main magnetic carrier, but thesmall
shift
hints
at a
minor
contributionof
other magnetic mineralsfor
the
southern sedirnents. Despite sirnilaritiesin
the magnetic assemblagefor all
sectors,ARM,
IRM, SIRM, and k11 are much lower in South-Shore rivers than in North-Shore rivers (Figure 13).This dissimilarity can reflect variations
in
concentration and grain size(Liu et
a1.,2012).Moreover,
k11is
not
only
affected
by the
ferrimagnetic content,but
also
by
theconcentration
of
antiferromagnetic(e.g.,
hematite), paramagnetic(e.g.,
silicate), and diamagnetic (e,g., quartz) minerals (Dearing, 1999).This
dissimilarityis in
accordanceJZ
with
mineralogical results from this study where pyroxene and amphibole (paramagnetic)are more abundant along the North-Shore,
while
qvaîtz is abundant along the South-Shore (diamagnetic). The magnetic susceptibility of the marine samples depicts a high variabilitywith
mean values close to North-Shore values (Figure 13).ARM, IRM
and SIRMof
the marine sediments are characterized by well-grouped data with mean values again close to the ones of the North-Shore sources (Figurel3).
Despite the fact that magnetite dominates the mineral assemblage, unusual demagnetization curves/behaviorwith
an increasing IRMover the first demagnetization few steps (Figure 14) is observed
in
samples collected in or near the Moisie River Delta.This
remagpetizationof
the
IRM
during alternating fielddemagnetizaton is interpreted as a gyroremanent magnetization (GRM).
A
similar behaviorwas recently detected
and
interpretedas
a
pedogeniciron
mineral
signature such ashematite or goethite (Lisé-Pronovost et al.,2Al4). Similarly, GRM observed in the samples
from the Moisie River delta suggests the presence
of
such high coercivity minerals in the assemblage. XRD data confirm this hypothesis in demonstrating the presence of hematite in sample NS14.In
other cases, the concentrationof
high coercivity minerals is too low for XRD measurements and is only detected by magnetic analyses.33 ,| € .90 =-l 1 E I .90 ù c o = Sourh-Margln -0,1 0 q1 Applied field G) 9outh-Margln -2