HAL Id: hal-01530975
https://hal.archives-ouvertes.fr/hal-01530975
Submitted on 1 Jun 2017HAL is a multi-disciplinary open access archive for the deposit and dissemination of sci-entific research documents, whether they are pub-lished or not. The documents may come from
L’archive ouverte pluridisciplinaire HAL, est destinée au dépôt et à la diffusion de documents scientifiques de niveau recherche, publiés ou non, émanant des établissements d’enseignement et de
Synchronizing atomic force microscopy force mode and
fluorescence microscopy in real time for immune cell
stimulation and activation studies
Séverine Cazaux, Anais Sadoun, Martine Biarnes-Pelicot, Manuel Martinez,
Sameh Obeid, Pierre Bongrand, Laurent Limozin, Pierre-Henri Puech
To cite this version:
Séverine Cazaux, Anais Sadoun, Martine Biarnes-Pelicot, Manuel Martinez, Sameh Obeid, et al.. Synchronizing atomic force microscopy force mode and fluorescence microscopy in real time for immune cell stimulation and activation studies. Ultramicroscopy, Elsevier, 2016, 160, pp.168-181. �10.1016/j.ultramic.2015.10.014�. �hal-01530975�
Author edited manuscript
Synchronizing atomic force microscopy force mode and fluorescence microscopy
in real time for immune cell stimulation and activation studies.
Séverine Cazaux 1,2,3, Anais Sadoun 1,2,3, Martine Biarnes-Pelicot 1,2,3 , Manuel Martinez 1,2,3, Sameh
Obeid 1,2,3,4, Pierre Bongrand 1,2,3,5, Laurent Limozin 1,2,3, Pierre-Henri Puech 1,2,3,*
1Aix Marseille Université, LAI UM 61, Marseille, F-13288, France.
2 Inserm, UMR_S 1067, Marseille, F-13288, France.
3 CNRS, UMR 7333, Marseille, F-13288, France.
4 (present adress) Institut FEMTO-ST, UMR6174-CNRS, UFC – 32, Av. de l'Observatoire, F-25044
Besancon, Cedex – France
5APHM, Hôpital de la Conception, Laboratoire d’Immunologie, Marseille, F-13385, France.
* (corresponding author) : [email protected]
Abstract
A method is presented for combining atomic force microscopy (AFM) force mode and fluorescence
microscopy in order to (a) mechanically stimulate immune cells while recording the subsequent
activation under the form of calcium pulses, and (b) observe the mechanical response of a cell upon
photoactivation of a small G protein, namely Rac. Using commercial set-ups and a robust signal
coupling the fluorescence excitation light and the cantilever bending, the applied force and
activation signals were very easily synchronized. This approach allows to control the entire
mechanical history of a single cell up to its activation and response down to a few hundreds of
milliseconds, and can be extended with very minimal adaptations to other cellular systems where
mechanotransduction is studied, using either purely mechanical stimuli or via a surface bound
specific ligand. 1 2 3 4 5 6 7 8 9 10 11 12 13 14 15 16 17 18 19 20 21 22 23 24
Introduction
Atomic force microscopy (AFM) is a surface probe technique that uses a soft cantilever to image
surfaces or to measure or apply forces while interacting with them [1]. Over the last 20 years, AFM
in force mode has been largely developed for quantitating molecular interactions, from single
molecule unbinding or unfolding events [2]–[4] to single cell detachment from a substrate or from
another cell [5]–[7].
Recently, force measurements have attracted the attention of many immunologists, in particular in
the field of adaptive immunity. A key step of the immune response is the detection by T
lymphocytes, thanks to their T cell receptor (TCR), of foreign peptides bound to major
histocompatibility complex molecules (pMHC) and displayed on the surface of antigen presenting
cells (APCs) [8]. AFM has been applied to the determination of the forces that single TCR/pMHC
[9] or BCR/antigen [10] can stand, since force has been recently suspected to be a possible regulator
of the antigen discrimination by those molecules [11]–[16]. Alternative techniques, such as
Biomembrane Force Probe [17] and flow chamber [18], were also used to dissect the contribution of
forces to single molecule recogntion of the TCR/pMHC complex, helping to understand the
exquisite sensibility and reliability of this molecular system [19], [20]. Further, AFM helped to
determine the forces that the immune synapse between a T cell and an APC can create or sustend
[21], [22]. In the recent years, such techniques have become a very important set of tools to dissect
the relationship between cellular mechanics, forces and function, in particular in immune cells [23].
Moreover, immune cells are increasingly recognized to have mechanosensory behaviours [24],
which may contribute to their remarkable capabilities of foreign peptide detection [25], [26]
A delicate issue in examining the relationship between the receptor binding events (i.e. the
TCR/peptide/MHC encounter in the context of T cell recognition [8]) and the early biochemical 1 2 3 4 5 6 7 8 9 10 11 12 13 14 15 16 17 18 19 20 21 22 23 24 25
consequences is to detect the precise moment when the molecules contact with sufficient temporal
resolution, let alone controlling when that contact takes place (ie. the initial encounter). In most
biological assays, this question is not addressed otherwise than taking as zero time the initial
combination of the relevant components, while even in video microscopy experiments cell contact
is determined by visual examination of the images or in the case of lymphocyte stimulation, by the
detection of a Ca2+ increase [27], [28] or Zap70 phosphorylation [29], among other possibilities.
In the field of mechanotransduction, it has become more and more evident that the consequences of
a stimulation event have to be followed simultaneously to the stimulation [30], in order to decipher
not only the magnitude of the response, but also to describe the entire history of the stimulation
[19], [31], where potential delays and time modulations of the response in regard to the stimulation
could be affected specifically by mutations or drugs, bringing detailled information about the
mechanisms at play. One way of following the signalling activity, in real time, is to visualize it
using fluorescent reporters (see above).
In this context, AFM has been very rarely reported, to our knowledge, to be used simultaneously to
optical fluorescence imaging in cell biology. These techniques are usually combined by successive
applications and led to the implementation of new modalities in commercial AFM (such as JPK
Overlay, JPK Instruments, or MIRO, Bruker) to allow easy image superpositions. Potential causes
of such a non simultaneous use in imaging / force mode are of two main origins : (a) a common
knowledge in the AFM community is that gold coated levers are « reacting » to fluorescence
excitation light, whether HBO lamps or lasers are used, and (b) that shutters or advanced optical
systems such as confocal scanning heads are producing vibrations that may perturb the AFM
measurements. A handful of reports present experiments where AFM indentation is performed while
recording a fluorescent signal, eg. calcium fluxes, but no detail is provided about the exact coupling 1 2 3 4 5 6 7 8 9 10 11 12 13 14 15 16 17 18 19 20 21 22 23 24 25
of the two techniques and their synchronization [30], [32], [33].
In the literature, reports can be found where force measurements are made concomitantly with
fluorescence imaging, but they have been mainly performed using micropipette derived systems
such as dual micropipette manipulation [34] (where forces are estimated) or Biomembrane Force
Probe [19], [31] (with a limitation of the maximal forces that can be applied). The problem of
external vibrations is essentially the same as for AFM experiments. In micropipettes, the
observation of the cellular system is made from the side and far from any optically flat surface. As a
consequence, it suffers from two experimental limitations as compared to AFM : (a) it limits the use
of high resolution microscopies and high magnification / NA lenses ; (b) the positionning of the
probe onto the cell's surface is made with a poor lateral accuracy. As a consequence, only whole cell
fluorescence signals can be currently studied. In some seminal experiments, the time resolution of
the measurements is also relatively low [31] but this was sufficient to reveal very interesting
features of the response of cells to mechanical signals such as delays and recovery times. Due to
their lower force range, the application of optical tweezers was not considered here and, as such, is
not presented.
A major strength of AFM stems from the possibility of using several modalities on the same set-up :
imaging, force indentation to investigate cell mechanics and adhesion force measurements over a
great range of force values, from single molecules to cell / cell separation [1]. Aside, it can be
coupled to advanced surface microscopies such as reflection interference contrast microscopy
(RICM, [35] ) or total internal reflection fluorescence microscopy (TIRFM, [36]), or to other high
resolution microscopies such as confocal [37], allowing to use the power of fluorescence imaging,
with a broad range of dyes or reporter molecules, in order to follow a structure (membrane, nucleus,
receptor), its dynamics or a cytosolic signal (calcium fluxes, pH variations) in conjunction to the 1 2 3 4 5 6 7 8 9 10 11 12 13 14 15 16 17 18 19 20 21 22 23 24 25
stimulating signal. While the determination of the moment of contact of the lever tip with the tested
cell is relatively simple (by detecting a variation of the force felt by the lever), coordinating the
signals from fluorescence and AFM can be complicated and complex synchronization could be
necessary. To our knowledge, this point was never clearly reported in literature.
We have developed an original technique allowing us to use AFM to mechanically and specifically
stimulate, in a controlled manner over time and space, single white blood cells (T cells,
macrophages), while following their activation response simultaneously via conventional calcium
probes. We describe a coupling signal existing between fluorescence microscopy and AFM, and use
it as a timer to synchronize the stimulus and the response of the cell. In a symmetrical approach, we
have used a reverse method that allows to submit T cells to controlled photo-stimulations, gaining
insight in their mechanical properties, when activating a small GTPase, Rac, in realtime. This
method being simple to put in place, and even if limited in terms of temporal resolution, is a first
step toward an easy integration between force mode AFM and signaling studies using flurorescent
reporters. This opens a way to new strategies to investigate different components of immune cell
mechanotransduction. 1 2 3 4 5 6 7 8 9 10 11 12 13 14 15 16
Materials and methods
Cells and cell culture
Two cell types were used : (a) human Jurkat T cells (clone E6-1, ATCC TIB-152), as a model for
lymphocytes, and (b) murine J774 macrophages (clone J774A.1 ECACC, Salisbury UK, gift from
A. Dumêtre, UMD3, AMU, Marseille) as a model for phagocytes. Cells were counted and passaged
three times a week, with a 2 min trypsination step for the macrophages, and their viability assessed
by the use of Trypan Blue labelling. The cell culture medium (RPMI 1640) and complements (7%
FBS, 1% Hepes 1M, Glutamax, Pen/Strep) were obtained from Gibco (Life technologies). Cells
were monthly tested for the presence of mycoplasma.
Reagents
Chemicals were purchased from Sigma-Aldrich : CaCl2 as a salt (# C1016), bovine serum albumin
(BSA) as a powder (# A3294), poly-L-lysine (PLL) as a 0.1% water solution (# P8920). PBS (as
10X sterile solution, w/o Ca++ / Mg++) was purchased from Gibco (Life technologies). Hellmanex
was purchased from Hellma Analytics.
Cells loading with calcium reporter
For calcium imaging, the cells were loaded in suspension with the green fluorescent probe Fluo4
(supplied as Fluo4-AM, #F-14201, Molecular Probes) using protocols adapted from provider's ones
prior to immobilization on PLL-coated glass coverslides. Such markers are known to report
efficiently the intracellular rise of calcium upon stimulation of immune cells by exhibiting an
increase in their fluorescence levels. In short, Fluo4-AM (50µg in 23µL) and Pluronic F127 (20 %
final concentration), purchased from Invitrogen, were dissolved in DMSO and mixed in a 1:1 ratio.
5×10 cells were centrifugated in PBS (1000rpm, 4min, RT) and resuspended in a final volume of⁵ 500µL, in which 1µL of the mixture Fluo4-AM/pluronic is introduced to ensure that DMSO 1 2 3 4 5 6 7 8 9 10 11 12 13 14 15 16 17 18 19 20 21 22 23 24 25
concentration during incubation is <0.1 %. After 30min incubation at 37°C, protected from light,
the cells are gently centrifugated and resuspended in 150µL of PBS before being plated on the PLL
coverslide at RT, where a supplementary resting step of 30 min is respected.
Rac-PA plasmid and cell transfection
The plasmid of photoactivable Rac fused with the fluorophore mVenus (called hereafter Rac-PA)
pTriEx-mVenus-PA-Rac1 was a gift from Klaus Hahn (Addgene plasmid # 22007) [38]. Jurkat cells
were electroporated using Amaxa system (Lonza, program X-001) using 16µg of plasmid for 10⁶ cells. Cells transfected with Rac-PA plasmid were either kept in RPMI 10 % FBS or starved
overnight in RPMI 0,2 % FBS before the experiment. Non transfected and sham-transfected (no
plasmid) cells displayed the same mechanical behaviour as plasmid transfected ones (not shown) ;
the former were used as control in our experiments.
Cells immobilisation
Lymphocytes : Round coverslides (170µm thick) were (a) washed in 1 % Hellmanex solution for
30min at 60°C in an ultrasonic bath (b) successively rinsed with pure ethanol and ultra pure water
three times (c) washed in ultra pure water for 30min at 60°C in an ultrasonic bath (d) successively
rinsed with ethanol and ultra pure water three times (e) dried under an argon flux before storage in
dust-free environment. Prior to use, a coverslide was activated for 1 min in a residual air plasma
cleaner used at maximal power (Harrick Plasma). A puncher-cut reticulated PDMS well (diameter
8mm ; typical height 1mm) was used to delimit a zone on the activated coverslide ; the well was
filled with 100μL of 0.01% poly-L-lysine in ultra pure water and incubated for 30-45 min at RT.
Substrates were gently rinsed three times with PBS before seeding diluted Jurkat cells suspensions
(labelled with Fluo4 or not) and letting them to adhere during 15 to 30 min at room temperature.
The glass coverslides were gently washed with PBS 1 % BSA 1mM CaCl2 to remove unbound cells.
1 2 3 4 5 6 7 8 9 10 11 12 13 14 15 16 17 18 19 20 21 22 23 24 25
After labelling the PLL zone with a felt pen, the PDMS well was then removed and the slide
mounted in a BioCell (JPK Instruments) or Coverslip Holder (JPK Instruments) filled with the same
medium. Note that the use of PLL to immobilize cells has been seen to provoke minimal activation
levels of the cell lines under study (see below).
Macrophages : J774 cells were detached from culture flasks using a 2 min Trypsin/EDTA treatment
at RT, washed by centrifugation and re suspended in culture medium before being seeded onto
ethanol / flame-sterilized glass round coverslides in 6 wells plates. They were made to adhere
overnight, in culture medium, at 37°C. Before the experiments, glass coverslides were rinsed to
remove unbound cells. The pre-adhered cells were eventually loaded with Fluo4 using the same
procedure as for the Jurkat cells, and mounted into the Biocell temperature control system. The final
steps are the same as described above for the lymphocytes.
Atomic force microscope / Fluorescence set-up
AFM : Measurements were conducted with an AFM (Nanowizard I, JPK Instruments, Berlin)
mounted on an inverted microscope (Zeiss Axiovert 200). The AFM head is equipped with a 15 μm
z-range linearised piezoelectric ceramic scanner and an infra-red laser. The set-up was used in
closed loop, constant height feedback mode [9].
Veeco MLCT cantilevers variants (rectangle (B), large triangle (C), small triangle (D) – see Suppl.
Fig. 1) were used in this study, either with tip and gold coating on the back side (MLCT-AU), with
tip and no gold (MLCT-UC) or without tip and with gold (MLCT-0). Since they were not
commercially available, levers without tip and without gold coating were produced by chemical
attack of commercial MLCT-0 levers as described in Supplementary Materials and Methods. When
needed, for levers with non square-base pyramidal tip, the assumption of a regular pyramidal tip of
half angle 15° to the face was used, calculated from provider data. The sensitivity of the optical
lever system was calibrated on the glass substrate and the cantilever spring constant by using the 1 2 3 4 5 6 7 8 9 10 11 12 13 14 15 16 17 18 19 20 21 22 23 24 25
thermal noise method [39]. Spring constant were determined in situ using built-in routines of the
JPK SPM software (JPK Instruments, v3) at the beginning of each experiment, and the same
correction factors were used for all levers types as a first approximation [40]. The calibration
procedure for each cantilever was repeated up to three times to rule out possible errors, and repeated
at the end of some series of experiments. Spring constants were found to be consistently close to the
manufacturer’s nominal values and the calibration was stable over the experiment duration.
Fluorescence microscopy : The inverted microscope was equipped with 10x, 20xNA0.8 and
40xNA0.75 lenses (with a supplementary 1.6 lens), and via a C-mount with a firewire CoolSnap
HQ2 camera (Photometrics). Bright field images were used to select cells and monitor their
morphology during force measurements. The microscope was also equipped with a LED
illumination system (Colibri 2, Zeiss). A PC, separate from the AFM, controlled the camera and
Colibri using Zen 2011 software (Zeiss) with suitable plugins under MS Windows 7 64 bits.
Alternatively, Micromanager software [41] was used to capture simple transmission images on the
same computer when fluorescence imaging was not needed.
Diodes coupled with filters were mounted in the LED illumination system for four simultaneous
configurations : UV = (diode 365nm + filter 387/11) ; B (for blue) = (diode 470nm + filter 485/20) ;
G (for green) = (diode NWhite 540-580nm + filter 560/25) ; R (for red) = (diode 625nm + filter
650/13) ; beams combiners = 395, 490, 600 nm (resp.). A corresponding quadriband filter set was
inserted in the microscope (dichroic and emission filters from F66-888 set, AHF). Alternatively, an
HBO lamp (100W, X-Cite 120) was connected to the LED illumination system via an optical fibre
and was used, together with suitable filters sets for FITC and TRITC excitation (Semrock). The
switch between HBO and LED illumination was made using an internal motorized mirror controlled
by Zen software.
Coupling : No triggering connection is made between the AFM group (AFM head, AFM controller,
AFM computer) and the optical group (optical microscope, camera and imaging computer). 1 2 3 4 5 6 7 8 9 10 11 12 13 14 15 16 17 18 19 20 21 22 23 24 25
Noise and temperature control : The AFM and optical microscopes were isolated from ambient
acoustic and mechanical noises using acoustic foam and an active damping table (Halcyonics). All
experiments were carried out at 25°C (except when mentioned), for no more than an hour and a half
when cells were present, before replacement of the substrate, cells (if any) and cantilever.
Cantilever modification : glueing a bead
9.6µm diameter latex beads (Invitrogen) were glued at the end of MLCT-UC levers using
micro-manipulation techniques on a Biomembrane Force Probe / Micro-micro-manipulation set-up [35]. Briefly,
a diluted ultra pure water suspension was let to dry on a coverslide and an UV curing glue (OP29,
Dymax) was spread close by. A cantilever (attached with double face tape onto a 3D
micro-manipulator (Sutter Instruments)) was first dipped into the glue, then approached from a bead under
constant bright field microscopy observation. After lifting the bead from the surface, the glue was
allowed to pre-polymerize for > 5min under the direct light of the halogen lamp of the microscope
set to its maximum power. Then the lever was collected and cured for 20 min in a UV oven at
maximum power (BioForce Nanosciences). The presence and position of the bead was checked by
microscopic observation of the lever at the end of the process, from a top view and from a side
view, allowing a precise determination of its radius using Fiji software [42] (see Suppl. Fig. 1B).
Note that the chosen glue does not introduce any large auto-fluorescent background as it has been
observed with 2-component epoxy glues (the autofluorescence being slightly present in the B light,
but not in the G or R ones, not shown). The rigidity of the bead/glue/lever link is far greater than the
one of the tested cells as seen as a rigid, linear behaviour when calibrating the modified lever in situ
on glass.
Mechanical characterization of the cells as a function of labelling
In order to measure the local Young modulus of the cells, AFM indentation experiments were 1 2 3 4 5 6 7 8 9 10 11 12 13 14 15 16 17 18 19 20 21 22 23 24 25
performed using non modified MLCT-AU levers. Adhered cells were selected by optical
examination and the pyramid shaped tip was positioned in the centre of the cell. Resulting Young
moduli were found to depend neither on the fine positioning of the lever when indenting the central,
higher part of the cells (excluding any lamellar, thinner structure that may exist at the border of the
cell) nor for the use of MLCT levers with or without gold coating (not shown).
The maximal exerted force was set at 500pN (leading to indentation depths of the order of one µm),
the contact duration at zero seconds, the speed of pressing and pulling at 2µm/s in all cases. At least
10 force curves were recorded for each cell. Each force curve was examined visually and processed
with the JPK DP software (JPK Instruments) : corrections for baseline, possible tilt of the baseline
and a modified Hertz model for pyramidal tips were applied (see above), making the hypothesis that
the cell behaves as an incompressible material [37]. The entire force span (from the baseline to the
maximal contact force) was fitted. A median value per cell was then calculated and tabulated,
leading to the distribution for at least 13 cells in each condition, with or without the Fluo4 labelling.
The resulting box-plots were then plotted using Matplotlib (http://matplotlib.org/) and Seaborn
(http://stanford.edu/~mwaskom/software/seaborn/) Python libraries. No obvious correlation
between the Young modulus and the force curve number (corresponding to the « mechanical
history » of the cell) was observed and, during occasional longer (> sec) contact times experiments,
no large difference in relaxation patterns of different cell types was revealed (not shown).
Study of the coupling signal
Clean coverslides were mounted directly in the Biocell or CoverSlip Holder (JPK Instruments) and
covered with 700µL PBS 1x w/o Ca2+/Mg2+. Unless indicated, the experiments were performed at
room temperature.
After calibrating the desired lever and checking that its spring constant was close to the
manufacturer's nominal value, the lever's end was set at a height of ~ 7.5µm from the coverslip (Fig. 1 2 3 4 5 6 7 8 9 10 11 12 13 14 15 16 17 18 19 20 21 22 23 24 25
1A). This distance is comparable to the typical thickness of a T cell or a macrophage attached to a
substrate (up to 10µm). Focus was adjusted, in bright field, onto the lever end.
Using Zen software (Zeiss), the wavelength, power (in %), duration and interval (in sec) were
chosen and sequences of light pulses (duration 0-500msec, intervals 200msec-several secs) were
flashed using the LED illumination system onto the lever. Simultaneous recording of the lever
deflection was made at 1kHz using the JPK SPM software Real-time option. Data was saved as text
(.csv) files and processed using IgorPro (Wavemetrics) or Python 2.6 for measurements using
built-in procedures or programmed ones. Fbuilt-inal values were stored built-in LibreOffice Calc sheets. The
resulting data graphs were then plotted using Matplotlib.
Light power measurements
The power of the excitation fluorescence light was measured using a PM100D power-meter
(ThorLab) in combination with a S120C probe (ThorLab), directly at the exit of the objective. With
the help of a paper sheet, the focusing of the lens of interest (40x NA0.75 for force measurements or
20x NA0.8 for light stimulation ones) was made using 470nm visible diode (LED configuration B).
Using the microscope stages, the x,y position of the detector was set so that the resulting measured
power did not vary for any minute motion of the detector over the lens. Wavelengths and nominal
power (LED illumination %) were varied using the remote control of the LED system (Zeiss), while
the mean value and SD over an averaging period of 10 sec were measured. No wavelength
correction was applied to the signal detected.
Following the dynamics of the LED system emitted light
A high speed giga-ethernet camera (GE 680, Prosilica), attached to a computer independent of the
AFM / fluorescence set-up, was used in combination with the JAI SDK and Control Tool
(http://www.jai.com) to record the excitation light sequences emitted by the LED system. These 1 2 3 4 5 6 7 8 9 10 11 12 13 14 15 16 17 18 19 20 21 22 23 24 25
sequences were imposed by the Zen software (Zeiss). A semi-reflective filter was used to redirect
part of the light onto the fast camera set to a ROI size that allowed acquisition up to ~ 1000 fps. The
exact frame rate was recorded by JAI SDK while taking the movie. The obtained movies were
processed using Fiji to calculate the mean intensity of the images vs. time. The subsequent data was
plotted and analysed using Matplotlib library for Python (see Suppl. Fig. 3A).
Mechanical stimulation of cells and recording of calcium fluxes
Adherent and Fluo4 loaded lymphocytes, or macrophages, were contacted with bead decorated
levers under a max force of 1nN, with a pressing and pulling speeds of 1µm/s for a total cantilever
travel distance of up to 10µm. Typical contact times were 180 sec for lymphocytes and 120 sec for
macrophages. Fluorescence was simultaneously excited by 200 msec pulses of 50% LED in
configuration B (~ 4.5mW), separated by 2 secs intervals.
Images were saved as .tiff files sequences and processed using Fiji software : the background, the
cell submitted to the mechanical forces and eventually some surrounding cells were ROI-ed using
the circle tool with zones of equal area, then the fluorescence level, F, (as grey levels) was
measured. Ad-hoc Python or IgorPro procedures were then used to automatically (a) subtract the
background, F0, from the cell fluorescences frame per frame (b) calculate the ratio F/ F0 (c)
post-synchronize the fluorescence ratio with the force as a function of time by aligning the first coupling
signal to the first picture data. The synchronization of the other coupling signals / frame
fluorescence signals was carefully inspected along the force vs. time curve. The resulting graphs
were plotted using Matplotlib library for Python 2.6.
Mechanical recording of the effect of activating Rac-PA
Rac-PA transfected cells were selected by imaging them with B light at 100 % for 250ms using a
20x NA 0.8 lens (~ 36.8 mW). After setting the lever above one cell, the sample was kept in dark 1 2 3 4 5 6 7 8 9 10 11 12 13 14 15 16 17 18 19 20 21 22 23 24 25
for a couple of minutes ie. far longer than the half life of the excited state [38].
Before / after experiments : Up to 10 force curves were taken at 1 nN max force and 1 µm/s speed,
with a gold coated lever with a pyramidal tip. Then, a 15 sec light pulse was used to activate the
protein by illuminating the entire field of view. Then, up to 10 additional force curves were taken
subsequently, as soon as the fluorescent light was switched off. Using the same methodology as
described above, we measured the Young modulus for each indentation curve. Median values, for
each cell, before and after the pulse were calculated and plotted as a box-plots, for cells having been
(or not) transfected with the plasmid and (or not) starved overnight.
Real time experiments : A succession of force curves (max force 500pN, speed 1µm/s) were
continuously taken using a lever without gold coating and with a pyramidal tip. The 15 sec pulse
was applied by illuminating the entire field of view. The force data were recorded in real-time at
1kHz together with separate force curves (which were used to obtain the Young modulus). The
post-synchronization of Young modulus vs. time was performed as follows : on the force vs. time plot,
the coupling signal was observed and used, together with the position of the first maximum in force
as obtained using Python. The position of the subsequent maxima was used to position the Young
modulus values versus time. Note that the separation in time is not homogeneous because it depends
on the local value of E (the smallest the E, the longer the time to reach the max force will be) if one
indexes the max value of indenting force to the image time stamp.
Statistics
Data processing was performed using open source softwares on Linux PC machines. Linear fitting
was performed using QtiPlot (http://www.qtiplot.com/) software and cross-checked using
Statsmodel library for Python 2.6, and Calc from LibreOffice 3.5. Box-plots were plotted using
Python Seaborn library using Spyder2, and cross-checked with classical Python Matplotlib and R
procedures. Data were processed using R / Rstudio softwares for statistical analysis using existing 1 2 3 4 5 6 7 8 9 10 11 12 13 14 15 16 17 18 19 20 21 22 23 24 25
packages (http://cran.rstudio.com/, packages asbio and pgirmess for Kruskal-Wallis or Wilcoxon
tests). 1
Results
The fluorescence excitation light causes the AFM lever to bend
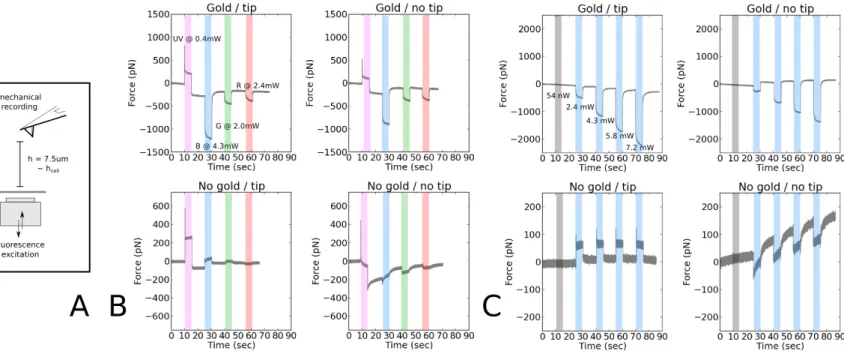
As reported qualitatively in the AFM community (see Discussion), a coupling signal is observed
between cantilever deflection and fluorescence illumination (Fig. 1). Here, the use of a diode
illumination system allowed to vary systematically the wavelength, power, duration and intervals of
the light pulses. Since neither a shutter is used nor a mechanically moving piece attached to the
optical microscope, on which this AFM stands, such an illumination system has no direct
mechanical impact on the entire set-up : as a control, the system was set on / off for a controlled
duration with a diode power of 0 W, and no signal was seen (Fig. 1C, shaded zones). The
characteristic time for the diodes to reach their plateau emission for a given power is < 1 msec (data
from provider and Suppl. Fig. 3A), much lower than the typical illumination durations that are used
for regular fluorescent compounds typically used in biology to get good S/N ratios (~ 100msec).
The coupling signal was verified to be reproducible (Fig. 2A, Suppl. Fig. 3, 4) ; its shape (for
visible excitation wavelengths) and magnitude varied strongly as a function of the presence or
absence of a layer of reflective gold on the backside of the cantilever (Fig. 1B). The magnitude
varied strongly upon the power of the excitation light at a given wavelength when the lever was
coated with gold, and showed very little, if no, variation when no gold layer was present (Fig.
1B,C , Suppl. Fig. 2). For a given lever type, the shape and sign (ie. positive or negative forces)
appeared to be dependent on the wavelength (Fig. 1A, in particular when comparing visible vs. UV
lights, and Suppl. Fig. 2). The relaxation of the lever was slow when gold was present and rapid
otherwise (Fig. 1C). The presence of a glued bead of 10µm in diameter, or its type (polystyrene or
glass) did not modify largely the shapes and magnitudes of the observed signal (for G light, see
Suppl. Fig. 6F,G ; for other wavelengths, the results were similar, not shown). We did not vary
systematically the size of the bead, but from our results one may infer that beads up to 10µm in
diameter do not strongly affect the signal, regardless of their composition. This is also supported by 1 2 3 4 5 6 7 8 9 10 11 12 13 14 15 16 17 18 19 20 21 22 23 24 25
the fact that the effect of the presence of the tip was rather negligible under our experimental
conditions, in regard to chemical treatment or presence of gold (Suppl. Fig. 2). Aside, (i) the
absolute deflections were very large for UV light for all cantilever types and for visible light when
gold coating was present (eg. for commercial levers, ~ -2000pN with gold vs. ~ +50pN without
gold for 470nm excitation at maximal diode power) and (ii) the AFM showed a higher stability in
time (ie. smaller baseline variation) when using gold-less cantilevers (Fig. 1).
The main effect of the absence of gold coating was to abolish the variation of the shape and
intensity of the coupling signal as a function of the excitation power for visible wavelengths, and to
keep the observed deflection at low forces in particular for the 470 nm excitation (Fig. 1C). This
wavelength corresponds to the excitation of calcium reporter molecules of the Fluo4 family that
were of particular interest for the present study. As a consequence, we set out to characterize the
step-like coupling signal observed with commercially available MLCT-UC levers (having a tip but
no gold coating), in order to use it as a timer signal. Such levers have the advantage of not suffering
from harsh acidic treatment that may damage them or be imperfect (Suppl. Fig. 1A).
By inserting an IR filter in the AFM head (780nm, diameter 12.5mm, Edmund optics, maintained
on the JPK glass block using immersion oil), it was verified that the observed signal was not created
by an incoming light from the visible diodes onto the QPD (not shown). Using AFM force mode in
either constant height or constant force mode during the contact with a hard glass substrate, it was
concluded that the signal resulted from an actual bending (potentially with complex modes of
deformation) of the lever by observing its decrease or disparition (Suppl. Fig. 4). Moreover, the
signal did not appear to vary (for gold less levers) when the cantilever travelled towards or away
from the substrate over several micrometers, at various speeds.
The magnification (10x, 20x, 40x) and the NA of the lens (air 40xNA0.5, air 40xNA0.75, oil
40xNA1.20) were varied and the coupling signal was observed in all cases, with variable intensity
but qualitative identical behaviour / shape (not shown). We then chose for the rest of the study the 1 2 3 4 5 6 7 8 9 10 11 12 13 14 15 16 17 18 19 20 21 22 23 24 25
40xNA0.75 air lens since it represented a good compromise between working distance,
magnification and sensitivity for fluorescence measurements for our cell types. Moreover, this air
lens does not introduce any supplementary mechanical coupling between the AFM and the optical
microscope.
Using the coupling signal as a timer
We studied the characteristics of the coupling signal observed in the case of a commercial
MLCT-UC lever (Fig.1C, magnified in Fig.2) in order to determine how to use it to synchronize the AFM
force signal and the fluorescence imaging. The coupling signal is composed of a rapid, almost
instantaneous, spike, followed by a rectangular jump. We submitted a large triangle lever to periodic
illumination of B light of controlled duration and period and quantified the effect in terms of time
(duration, t, and periodicity, T, Fig.2) and magnitude (amplitude, in force) (Fig.3). Keeping the
medium at room temperature (~ 20°C) or imposing the temperature to be 25 or 37°C using a
temperature control system (Biocell, JPK Instruments) did not change the observations reported
below (not shown).
The period, T, varied linearly, as expected, with the imposed illumination period, with a slope of
1.0 (Fig. 2E). Combinations of imposed durations (50, 250, 500 msec) and imposed periods (500,
1000, 5000 msec) are represented as points of different colours (as a function of the value of
duration). They collapse as black dots except for the case of duration = period = 500msec (red dot).
A first conclusion is that the coupling signal could then be used reliably as a timer.
The duration of the lever deflection, t, was measured as a function of the imposed excitation
duration (set via Zen software), on the same lever, with the same combination of duration / period
(coded in colours in Fig. 2D). A linear response is achieved with a slope = 1.0 but with an intercept
of 167.7msec, showing that the recorded response of the lever is longer than the desired excitation.
We found this extra duration to originate from the [camera (firewire) / diode illumination system 1 2 3 4 5 6 7 8 9 10 11 12 13 14 15 16 17 18 19 20 21 22 23 24 25
(USB2) / acquisition software] part of the set-up, and could not be decreased very notably by
playing either on the ROI of the acquisition or on the camera binning (Suppl. Fig. 3). This
introduces a limitation on the shorter excitation / shorter periods that can be used with our system.
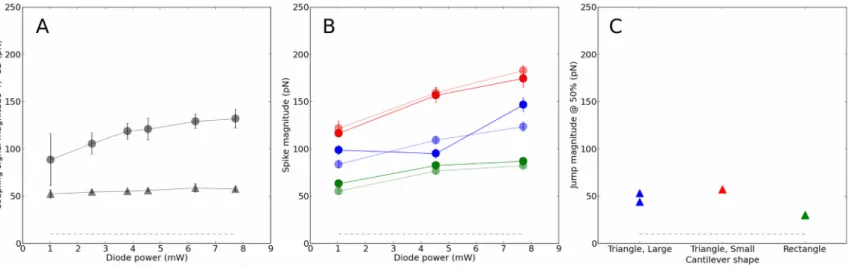
We further examined the force characteristics of the coupling signal on three of the softest levers
commonly used in biology : MLCT-UC 10pN/nm (large, triangle), 20pN/nm (rectangle), 30pN/nm
(small, triangle) (Suppl. Fig. 1A). While the rectangular jump height did not appear to depend on
the excitation power at 470nm (Fig. 3A), the spike seemed to be more variable for a given power
(higher SD) and for varying powers (Suppl. Fig. 3A). The shape of the lever appeared to have a
rather strong influence on the spike height (Fig. 3B) and only a moderate one on the jump height
(Fig. 3C). It is noteworthy that the two signals were always > 5x and ~ 2x (respectively) higher than
the typical noise of our AFM (~ 15 pN). As a consequence, this signal could be always seen and, as
long as forces that are used / measured are on the 500-1000pN range, would be only a moderate
modulation of them. Interestingly, the large triangular and the rectangular levers appear to have to
the smaller signals of all.
In order to extend the use of this signal as a timer, we examined the use of two wavelengths, either
consecutively of simultaneously, and confirmed that the use of gold-less cantilevers can be
efficiently extended to such a situation with similar precautions and restrictions (Suppl. Fig. 5). This
leads to envision the use of this system for dual stimulation dyes or combinations of dyes for
ratiometric measurements (eg. Fluo4 / Fura-Red), in combination with a vibration free, single
camera, dual-detection using eg. a DualView (DV2, Photometrics) system (see Discussion).
As a conclusion, the observed coupling signal for gold-less levers could be efficiently used as a way
to synchronize the fluorescence images and forces in a mechanical stimulation experiment, whilst
perturbing very moderately the applied or measured forces.
Immobilisation of immune cells and activability
1 2 3 4 5 6 7 8 9 10 11 12 13 14 15 16 17 18 19 20 21 22 23 24 25
We selected PLL as a relatively non-activating but efficient binding molecule for Jurkat T cells [9].
To verify cell activability, we used 10µM ionomycin in DMSO to stimulate adherent Fluo4 loaded
cells. The max F/F0 ratio was observed to be ~ 6.2 for populations of Jurkat E6.1 cells (as compared
to 2.6 when DMSO alone was used). For untreated glass adhered J774 macrophages, we found this
ratio to be ~ 5.2 (as compared to 2.6). Experiments were performed at room temperature to avoid
excessive sequestration of the Fluo4 dye in organelles. Using soluble activating anti CD3 antibodies
leaded to calcium fluxes in Jurkat cells, with lower maximal ratio in comparison to ionomycin (not
shown).
Quantification of cell mechanics as a function of cell type and Fluo4 loading
Using the pyramidal tip of soft gold coated levers, the mechanics of immobilized model
lymphocytes and macrophages was investigated. Their Young modulus, E, was measured over the
entire indentation range, using a given max contact force (500pN) and at a given speed (2µm/s)
(Fig. 4). We found E values in the range of 100-1000 Pa, coherent with the values found in the
literature for various types of white blood cells [9], [43], [44]. These values did not vary largely, for
the Jurkat cells, when the temperature was 25°C or 37°C, or when the speed used for pressing the
tip on the cell was varied between 1 and 10 µm/s (not shown), indicating a weak contribution of
cytosol viscosity in this range of stimulation frequencies. The basal mechanics of the two cell lines
was similar for the populations tested, the macrophages being slightly more rigid than the T cells
(which is consistent with Ref. [45]). For the macrophage line, the labelling with Fluo4 did not
exhibited a marked difference to the basal level. Interestingly, the Jurkat cell line exhibited a
significant variation of its Young modulus : the cells were more rigid when loaded with Fluo4 with
no supplementary modification of the cells environment (Fig. 4).
Mechanical stimulation of a single cell
1 2 3 4 5 6 7 8 9 10 11 12 13 14 15 16 17 18 19 20 21 22 23 24 25
The coupling signal was used as a way to synchronize a micro-mechanical stimulation of a single
cell and the simultaneous recording of intracellular calcium fluxes. Experiments were performed, at
25°C, by pressing a bare latex bead, glued to the large triangle of MLCT-UC (no gold, nominal
constant 10pN/nm) onto adhered, Fluo4 loaded cells, while having set the focus for the optical
detection onto the equator of the cell. Two prototype patterns that recapitulate the essential steps
observed for the cells exhibiting visible calcium fluxes are presented on Fig. 5.
Upon reaching a pre-set maximal contact force of 1nN (Fig. 5D#3, 5E#2), the piezo motion was
stopped using closed-loop system, for a purely mechanical, continuous, stimulation. The cell could
relax the stress via its viscoelastic properties (Fig. 5D#4, 5E#3) [46] and even apply pulling
(negative variations) or pushing (positive variations) forces to the stimulating bead (Fig. 5D#4-5,
5E#4-5) [31].
For model T cells, when observed, the calcium signal was showing a single peak, delayed from the
force peak, here ~ 30 sec apart (Fig. 5D). The calcium peak was often observed to synchronize with
some active behaviour of the cell (Fig. 5D, after #4), as monitored by modulations of the force
levels achieved after the partial relaxation of the contact force. Surrounding, non mechanically
stimulated cells were neither showing such a calcium peak, nor fluctuations (Fig. 5D, control). The
observed fluorescence signal eventually plateaued and quickly decreased with different intensity vs.
time slopes (slow then fast, then slow), potentially due to the combined effects of the return of the
cell to its basal calcium level and / or the Fluo4 bleaching. When the bead was finally pulled from
the cell surface, non specific adhesion was recorded (Fig. 5D#5), but total separation was possible
for the accessible piezo pulling range (Fig. 5D#6), the cell staying attached firmly onto the PLL,
with no apparent damage as observed in transmission microscopy. Sometimes tethers that where
pulled from the cell and not fully detached at the end of all processes were observed (not shown).
For model macrophages, the pattern of fluorescence was observed to be more complex, often
exhibiting oscillations in response to mechanical stimulation (Fig. 5E). The fluorescence 1 2 3 4 5 6 7 8 9 10 11 12 13 14 15 16 17 18 19 20 21 22 23 24 25
fluctuations did not seem to be correlated with force fluctuations (Fig. 5E #3). The most prominent
differences with the T cells appeared during the relaxation phase, where negative forces were
recorded, meaning that the cell pulled on the bead (Fig. 5E #4), and during the separation process
where the recorded adhesion forces were exceeding the detectable bending capabilities of the lever /
QPD system (Fig. 5E #5). When moving away the lever from the surface by using AFM head
motors and introducing a lateral motion of the head, the macrophage was always found to have
detached from the substrate and to be bound to the bead, indicating that a potential phagocytosis
event was at play [47].
Mechanical recording of Rac activation in Jurkat cells
A reciprocal approach to the previous experiments consisted in using the coupling signal between
fluorescence and AFM force mode to follow the real-time mechanical modifications of
photoactivable Rac transfected Jurkat cells.
First, mechanical characteristics of cells upon activation of Rac were examined at a population
scale, with a « static » approach, by measuring the elastic modulus before and after an activating
light pulse, using unmodified MLCT-UC levers. Median values, for each cell, before and after the
pulse were calculated and plotted together with descriptive parameters of cell population as
box-plots, for cells having been (or not) transfected and (or not) starved overnight, in combination (Fig.
6A-D). Comparison of the median of the cell population did not show the existence of a strong
effect, but the close examination of the behaviour of individual cells (using the connecting lines on
Fig. 6A-D) showed that, when Rac-PA was present and activated, more tested cells were showing
an increase in their rigidity. This was confirmed by the examen of the fraction of cells exhibiting an
increase in E over the activation of Rac-PA (ie. having a median E after light pulse to median E
before ratio greater than 1), for the different cell conditions (Fig. 6E). This effect appears to be
mainly due to the action of Rac-PA (see Fig.6A vs C, Fig. 6B vs. D, and Fig. 6E) rather than to 1 2 3 4 5 6 7 8 9 10 11 12 13 14 15 16 17 18 19 20 21 22 23 24 25
starvation (see Fig.6A vs B, Fig. 6C vs. D, and Fig. 6E). Aside, the spreading of the distribution
before and after the light pulse did not appear to be different, indicating that cell populations
mechanical heterogeneity was not affected. Interestingly, the starved cells appeared to be
significantly stiffer than the non starved ones. In an other set of experiments (to be reported
elsewhere), the transfection protocol of Jurkat with various plasmids was observed not to largely
modify Young modulus values obtained under moderate indentation forces (500-1000 pN).
In order to dissect the behaviour of individual cells, preliminary experiments were performed to
follow in real-time the Young modulus of a given cell, using a MLCT-UC large triangle lever, when
stimulating the cell with 470nm intense light (~ 37mW for 20xNA0.8). Starved Rac-PA transfected
cells were used since they appeared previously to have a strong response to the stimulation (Fig.
6E). The coupling signal was used here to detect the beginning of the stimulation period in the
real-time recording of the force, hence to place the measured values of E vs. Time and the stimulation
duration, as exemplified on Fig. 6F-H. This allowed to observe that (i) the effect of the activating
light was almost immediate, (ii) reached a plateau after the pulse was stopped and (iii) rapidly
decayed (< 45secs duration, which is consistent with published data [38]). The values before and
after the pulse were similar, and some cells exhibited a strong variation of E upon stimulation, as
could also be observed in individual median signals from Fig. 6D. The rapid and transient,
reversible nature of the light induced perturbation may lead to an apparent weaker effect when
calculating a median over time in the regions before and after the activating light pulse in the
previous experiments. As a conclusion, the presented AFM / fluorescence coupling effect allowed to
directly, and in real-time, observe modulations of the cell mechanics upon light activation of Rac
that the simple examination of population behaviours may have not allowed to detect. 1 2 3 4 5 6 7 8 9 10 11 12 13 14 15 16 17 18 19 20 21 22 23 24
Discussion
A deflection signal that appears when usual wavelengths of fluorescence excitation light are shone
onto a soft AFM lever has been observed and described. This coupling signal varies (i) in shape as a
function of the presence of a reflective gold layer and as a function of the wavelength used, and (ii)
in intensity as a function of the power of the light when a gold coating is present. However, this
signal appeared to be, in the absence of gold reflective coating, regular and of small amplitude (~
50-100pN), with the same period as the imposed excitation, and with a controlled duration that
varies with the duration of the excitation. It was concluded from controls that this signal cannot be
totally removed, but minimized by using the proper type of commercially available AFM levers.
Importantly, it must be noted that this coupling effect has been observed qualitatively among several
labs, with different brands / types of AFM, and with light sources such as halogen lamps, diodes or
lasers (CM. Franz, PE. Milhiet, F. Rico, A. Rigato, F. Eghiaian, personal communications, among
others), but it has not been fully described and, to our knowledge, never exploited as we propose
here.
As a consequence, we chose to use it to synchronize the signals coming from the AFM (force) and
from the fluorescence detection (image) with no additional electronics, in mechanical stimulation
experiments where the cellular consequences activation was followed by simultaneous fluorescence
measurements. Conditions for this usage as a timer were established in time ranges that are
compatible with the use of single wavelength calcium probes such as Fluo4 to have (i) sufficient
excitation for a good detection and (ii) minimize dye bleaching.
Subsequently, this signal was used to follow, in real time, calcium response of T cells and
macrophages when submitted to a purely mechanical stimulation to demonstrate the capabilities of
the AFM / fluorescence set-up and the richness of the accessible mechanical, adhesive and
signalling information. Single cell passive (elastic deformation and viscous dissipation) and active
behaviours (pushing / pulling) were recorded with an excellent control over forces and times. 1 2 3 4 5 6 7 8 9 10 11 12 13 14 15 16 17 18 19 20 21 22 23 24 25
We also used the coupling signal in a reverse way, in order to record mechanical perturbations of
single T cells when cytoskeletal modifications were induced by the use of a photoactivable Rac. It
was observed that the protein modified the mechanics by stiffening the cell. Single cell recording
allowed us to observe delays and relaxations that might be due to the reversible photoconversion of
the Rac variant among other potential causes.
Hereafter, open questions concerning the origin of this signal and limitations of its use that remain
to be addressed are discussed.
Origin of the coupling signal
Controls were performed to clarify the origin of the observed coupling signal : (i) cantilever rigidity,
shape, coating were tested ; (ii) light intensity, wavelength were varied (the use of a mercury lamp
of 100W provided qualitatively the same results as the ones shown here with the Colibri diode
system) ; (iii) an IR filter was introduced in the AFM head to block any non-IR light that may have
reached the QPD ; (iv) temperature of the experimental buffer was not externally controlled (room
temperature ~ 20°C) or imposed at 25 or 37°C in order to control the potential heating of the lever /
medium by the IR laser.
It could be concluded that the signal is due to an actual bending of the lever (Suppl. Fig. 4). Low
intensity fluorescence diodes, in liquid, may create a local heating of the lever, resulting in a
bending since it is behaving as a bi component / bimetallic material. Commercial levers are usually
coated on one side with chromium (or titanium), and in some cases with a supplementary layer of
gold. When gold is present, the metallic layer deposited on the lever is thicker, so the lever is more
asymmetric and possesses a more thermally conductive structure which may explain the larger
effect that are observed on such levers (Fig. 1). The lever could then be understood as a local
thermometer, and gold dilatation to create ample asymmetric motion of the lever, by bending it
down (to negative forces). 1 2 3 4 5 6 7 8 9 10 11 12 13 14 15 16 17 18 19 20 21 22 23 24 25
On our set-up, the duration of the apparent effect has been shown to be biased by a residual time
introduced by the fluorescence microscopy controlling system (Zen / Colibri / Camera), and could
be slightly lowered (reduction ~ 10 - 20 %) by using binning and ROI-ing the image (Suppl. Fig. 3).
Nevertheless, this delay was never eliminated in our hands, hence reducing the time resolution
accessible.
Modification of levers
When gold coating was absent or removed, we observed (i) that the levers were more
« transparent » when observed in transmission (Suppl. Fig. 1), (ii) a subsequent decrease of the sum
signal of the AFM (ie. the total reflected laser reaching the QPD), similar for absent or removed
gold cases, and that (iii) in the four conditions examined, the spring constant of corresponding
levers was not varying much and that the variation stayed within the observed variation between
cantilevers batches.
As reported by other groups [48], [49], removing gold or using gold-less levers also improved the
stability of the system : the drift was reduced to almost nil (Fig. 3A). A gold-less lever offered the
supplementary advantage that the placement of the tip or the glued bead onto the cell and its
centring were greatly eased. On another hand, this transparency implies to verify that the IR laser
used for monitoring the lever bending has no strong influence on the cell's behaviour, as sometimes
reported for optical tweezers (see below).
Removing gold with harsh acidic treatment was tested here but has shown some limitations : it was
difficult to robustly achieve a very homogeneous uncoating along the entire body of the levers. On
Suppl. Fig. 1, zones with different contrasts can be observed, suggesting an incomplete removal of
the metal layer(s). Since the acidic treatment is vigorous, the underlying attaching layer of
chromium (or titanium), or even the body of the lever itself, could be deteriorated non
homogeneously. This could explain the differences between commercially available levers with no 1 2 3 4 5 6 7 8 9 10 11 12 13 14 15 16 17 18 19 20 21 22 23 24 25
gold and chemically attacked ones in particular in the shape of the coupling signal, its sign and in its
relaxation dynamics. Additional XPS studies of this residual layer may help to understand better the
variation of the signal by allowing a refined description of the lever surface composition.
The cantilever tip, when present, limits the size of beads that could be glued on the lever end to
obtain smoother, spherical indentors for mechanical stimulation (Suppl. Fig. 1B). In order to keep
the benefit of the very regular signal that was obtained using commercially available gold-less
levers, a new strategy (inspired by [50]), was preliminary tested on used levers, first washed with
EtOH / ultra pure water, then air dried. A ion-beam milling set-up, coupled to a SEM, was used to
cut the extremity of the lever to remove the tip without changing too much the lever length and their
spring constant (Suppl. Fig. 6). In this way, the surface state of commercially available uncoated
levers could be largely preserved together with their low spring constant. However, this technique is
delicate and time consuming (1 lever per 20-30 mins). We observed that the coupling signal for
470nm exciting light is similar between a cut and a non cut levers (Suppl. Fig. 4D,E). The
variations are of the same order as the inter lever dispersion observed (Fig. 3). The tip does not
appear to contribute largely to the observed effect (Fig. 1, Suppl. Fig. 2 and 6). The same results
were observed for levers without gold coating, bearing or not a 10µm glass bead, supporting the
fact that the bead does not affect much the observed signal, either in shape or in magnitude, in our
optimized conditions (Suppl. Fig. 6F,G).
Lever mirror effects
Reports have shown that gold coated levers may act, when used in combination with fluorescence,
as mirrors [33]. We set to observe this potential effect with non gold coated levers by measuring the
fluorescence signal at different (x,y) positions under the lever when pressing / pulling on a cell that
did not present a strong mechanical activation (eg. If contact time is kept low, ~ 10-20 sec ; Suppl.
Fig. 7). In such conditions, the mirror effect was observed to be of rather low intensity, depended 1 2 3 4 5 6 7 8 9 10 11 12 13 14 15 16 17 18 19 20 21 22 23 24 25
on the initial fluorescent level of the cell under study, and potentially of its spreading state (ie. its
thickness). When compared to the activation signal that were observed in Fig. 5D,E, this mirror
effect is of small amplitude.
Precautions and further developments
Limits of the timer : In order to be properly used, the coupling signal has to be characterized for
every type of lever that could be of interest. The present article reports the use of gold-less,
commercial silicium nitride levers that appear to have a reproducible, fast appearing / disappearing
coupling signal, in particular when a blue excitation light is used eg. for calcium reporters. In our
hands, the main limitation is due to the existence of a ~ 160 msec extra duration of the coupling
signal compared to the excitation coming from the excitation system, that, on our simple system,
limits the possibility to take pictures at a high frame rate (ie. with periods shorter than this extra
duration plus the duration of the excitation). Aside, when using the coupling signal as a timer, the
question of where to set the correspondence between a force point and an image (beginning, middle
or end of a jump) has to be taken into account if one wants to look at short time effects (ie. on the
order of the minimal pulse duration possible). Here, we chose to align the beginning of the pulse
for simplicity.
Other sources of excitation : Such a coupling signal can be also observed with lasers, and even in
TIRF mode of illumination (C.M. Franz, personal communication). Tests have shown that the use
of an HBO source using the Colibri as a shutter created a mechanical noise of rather large intensity
as compared to the coupling signal, preventing its use (not shown).
Cantilevers without coating : When modifying the coating of the levers, precautions have to be
taken to verify that (i) such levers have a sufficient reflectivity for the AFM to perform reliable
measurements and (ii) since they are more « transparent », that the levels of infra-red or red light 1 2 3 4 5 6 7 8 9 10 11 12 13 14 15 16 17 18 19 20 21 22 23 24 25
that pass through and hit the cell is not perturbing it. Using optical tweezers to manipulate beads
close to motile T cells have shown that they often stop migrating or move away from the laser spot
(O. Theodoly, personnal communication). On the set-up used here, with commercial gold less levers
or made using chemical attack, reflectivity was good enough to achieve a good signal to noise ratio
and the IR laser did not seem to have strong effects onto the tested cells, loaded or not with
fluorescent reporters, as inferred from their shape and behaviour.
Ratiometric or FRET imaging : We tested the superimposition of 470nm / 555 nm lights,
simultaneously or one after the other, and observed that the resulting signals are additive and stay of
low magnitude for uncoated levers (Suppl. Fig. 5). This opens, for example, the use of Fluo4 /
FuraRed mixture as a way to perform, easily, with a single detection channel, ratiometric calcium
measurements. For more complex signal reporters, such as Fura2 or even FRET dyes such as
ROZA, a reporter of Zap70 activation [29], the combination with a DualView detection system
(DV2, Photometrics, http://www.photometrics.com), allowing the simultaneous detection of two
wavelengths without any mobile part, on the same camera, could prove a rather easy
implementation, using the coupling signal as an reliable timer.
Perspectives : stimulations using specific molecules
The present experiments open the way to mechanical (with bare beads) or specific (with beads
grafted with specific, density controlled and oriented molecules) stimulation experiments.
Controlling the bead size, specific molecule grafting density, indentation force, contact time, and
recording the indentation depth may allow to gain a fine control on the number of molecules that
are presented to the tested cell. If the recognition / adhesion events are long-lived enough and
create solid bonds, the pulling part of the force curves may be compared to this number thanks to a
detailed analysis of the rupture events along the separation, opening exciting new perspectives in 1 2 3 4 5 6 7 8 9 10 11 12 13 14 15 16 17 18 19 20 21 22 23 24 25
the field of Single Cell Force Spectroscopy -based techniques [2], [6] [52-55] 1
Conclusion
A coupling signal existing between AFM and fluorescence microscopy, manifesting as a bending of
the AFM cantilever upon shinning excitation light, has been described. It has been characterized in
terms of duration, periodicity and intensity, as a function of excitation wavelength and power, for
four different types of soft cantilevers that are commonly used in biological applications of AFM
force mode. Three different geometries and rigidities (< 100 pN/nm) were examined. For
commercial uncoated levers, this signal is of moderate intensity (~ 50 – 100 pN), reproducible, and
can hence be used as an intrinsic timer for real-time use of AFM and epifluorescence.
This approach presents the advantage of avoiding the needs of a physical connection between the
AFM computer and the fluorescence detection system to synchronize the observed signals (force on
one side and fluorescence images on the other side).
Two applications were presented, namely (i) single immune cell mechanical stimulation while
following the consequences of the contact via fluorescent calcium reporters and (ii) single T cell
stimulation by light, using a photoactivable Rac protein, while recording the mechanical
consequences of this activation.
The present study highlights the precautions of use and limitations, in particular discussing the time
resolution (number of frames per second, duration of the excitation). Modifications of the set-up
have been proposed to enlarge this approach to more complex, dual wavelengths dyes (such as
ratiometric calcium dyes or FRET reporters), together with optimizing the geometry of the
mechanical contact by modifying the levers.
The mechanical stimulation experiments are paving the way to specific stimulations where a given
molecule will be oriented, at a known density, grafted on the bead modified lever, to represent a
model APC. Physical / mechanical parameters of the contact (duration, frequency, force, rigidity of
the lever ie. apparent APC rigidity [51]) could then be varied in order to decipher the transfer
function of given pathways encoding the information received at the membrane and transmitted to 1 2 3 4 5 6 7 8 9 10 11 12 13 14 15 16 17 18 19 20 21 22 23 24 25
the cytosol, exploiting the fluorescence recording in real-time or relevant markers. Such a simple
technique may open the use of AFM to dissect mechanochemistry at single cell level, by allowing
forces and their consequences to be easily correlated.
Two exquisite systems of uttermost importance in immunology would be by targeting the TCR and /
or other activating / adhesive molecules on T cells, and following the consequences of the
interaction between the antibody Fc fragment and its receptor (FcR) using suitably opsonized beads
of various sizes in the macrophage context. 1 2 3 4 5 6 7 8
Acknowledgements
Fundings : Prise de Risques CNRS, ANR JCJC « DissecTion » (ANR-09-JCJC-0091 ), PhysCancer
« H+-cancer » (to PHP). Labex INFORM LABX-0054) and A*MIDEX project
(ANR-11-IDEX-0001-02), funded by the « Investissements d’Avenir » French Government program managed
by the French National Research Agency (ANR) (to Inserm U1067 Lab and as PhD grant to AS).
GDR MIV (as a master grant to SO).
Providing material or technical help : P. Robert (U1067, Marseille), Y. Hamon & H.-T. He (CIML,
Marseille, France). A. Dumêtre (UMD3, Marseille, France) [J774 cells], K. Hahn [Rac-PA plasmid],
F. Bedu & H. Dallaporta (CINAM, Marseille) [ion beam cutting]. F. Enghaian, A. Rigato & F. Rico
(U1006, Marseille) [chemical gold removal recipes and discussions]. P. Dumas (CINAM, Marseille)
[discussions]. R. Fabre (CIML, Marseille) [preliminary experiments].
Companies : JPK Instruments (Berlin, Germany) for continuous support and generous help. Zeiss
France for support.
Contributions.
PHP designed, performed experiments, processed the data and wrote the article. MPB performed
the plasmid transfection and stimulation experiments. SC, AS, MM, SO performed experiments and
processed the data. LL performed experiments and participated in writing the article. PB
participated to the design of the study and in writing the article 1 2 3 4 5 6 7 8 9 10 11 12 13 14 15 16 17 18 19