Publisher’s version / Version de l'éditeur:
Vous avez des questions? Nous pouvons vous aider. Pour communiquer directement avec un auteur, consultez la première page de la revue dans laquelle son article a été publié afin de trouver ses coordonnées. Si vous n’arrivez pas à les repérer, communiquez avec nous à [email protected].
Questions? Contact the NRC Publications Archive team at
[email protected]. If you wish to email the authors directly, please see the first page of the publication for their contact information.
https://publications-cnrc.canada.ca/fra/droits
L’accès à ce site Web et l’utilisation de son contenu sont assujettis aux conditions présentées dans le site LISEZ CES CONDITIONS ATTENTIVEMENT AVANT D’UTILISER CE SITE WEB.
Analytical Chemistry, 90, 15, pp. 9281-9288, 2018-06-21
READ THESE TERMS AND CONDITIONS CAREFULLY BEFORE USING THIS WEBSITE. https://nrc-publications.canada.ca/eng/copyright
NRC Publications Archive Record / Notice des Archives des publications du CNRC : https://nrc-publications.canada.ca/eng/view/object/?id=45709299-174b-4f06-91d3-411ee9765217 https://publications-cnrc.canada.ca/fra/voir/objet/?id=45709299-174b-4f06-91d3-411ee9765217
NRC Publications Archive
Archives des publications du CNRC
This publication could be one of several versions: author’s original, accepted manuscript or the publisher’s version. / La version de cette publication peut être l’une des suivantes : la version prépublication de l’auteur, la version acceptée du manuscrit ou la version de l’éditeur.
For the publisher’s version, please access the DOI link below./ Pour consulter la version de l’éditeur, utilisez le lien DOI ci-dessous.
https://doi.org/10.1021/acs.analchem.8b01859
Access and use of this website and the material on it are subject to the Terms and Conditions set forth at
Determination of the isotopic composition of osmium using MC-ICPMS
Zhu, Zuhao; Meija, Juris; Tong, Shuoyun; Zheng, Airong; Zhou, Lian; Yang,
Lu
Determination of the Isotopic Composition of Osmium Using
MC-ICPMS
Zuhao Zhu,
†,‡Juris Meija,
‡Shuoyun Tong,
∥Airong Zheng,
§Lian Zhou,
∥and Lu Yang
*
,‡†
Fourth Institute of Oceanography, State Oceanic Administration (SOA), Beihai 536000, China
‡
National Research Council Canada, 1200 Montreal Road, Ottawa, Ontario K1A 0R6, Canada
§
College of Ocean and Earth Sciences, Xiamen University, Xiamen 361102, China
∥
State Key Laboratory of Geological Processes and Mineral Resources, China University of Geosciences, Wuhan 430074, China
*
S Supporting InformationABSTRACT: Despite its widespread applications in geology, all osmium isotope ratio measurements are either uncalibrated or rely on the veracity of the uncalibrated 1937 Nier values by adopting them as normalizing constants typically in conjunction with an exponential mass bias correction model. In this study, isotope ratios of osmium were determined in six commercial osmium materials, including the DROsS standard and a new NRC isotopic osmium reference material OSIS-1, by MC-ICPMS. We use a previously optimized and validated regression mass bias correction model to correct instrumental isotope fractionation effects which does not rely either on Nier’s values or on a strictly mass-dependent behavior of the isotopes. Deviations from mass-dependent fractionation (mass independent fractionation) were observed for osmium isotopes in MC-ICPMS with the most dramatic effect occurring for 187Os,
wherein, on average, close to half-percent bias in the isotope ratio187Os/188Os was observed as a result of imposing Russell’s law.
1. INTRODUCTION
In 1970, Riley and Delong noted that “very few comparisons of the natural isotopic composition of osmium have ever been made because of analytical difficulties and limited availability of osmium rich samples”.1 Since then, significant improvements in negative thermal ionization mass spectrometry (N-TIMS) methods2,3 have led to numerous applications of osmium isotopes in geological sciences. These include the study of low-and high-temperature processes such as mantle−crust interaction, sedimentation, cosmic evolution, ocean circulation, and even industrial waste migration.4−20The radioactive decay
of rhenium-187 to osmium-187 leads to significant variations of this radiogenic osmium isotope. As an example, isotope ratio 187Os/188Os varies by several orders of magnitude from 1:10 in the Earth’s mantle7 to 1:1 in seawater21 and 10:1 in some
sulfide ores.22 Owing to these variations, isotope ratios
involving osmium-187 are of key interest.23
Despite these advances, however, the measurement technique is still not mature enough to allow for new independent measurements of isotope ratios of osmium, and in turn, isotopic abundances or atomic weight.24−27 To this
day, most if not all osmium isotope ratio measurements are traceable (directly or indirectly) to the values published by Nier in 1937.28,29 As an example, the best osmium isotope ratio measurement currently recognized by the International
Union of Pure and Applied Chemistry is that of Völkening et al. measured by N-TIMS3 which relies on Nier’s values to correct for instrumental fractionation of isotope ratios. In fact, most measurements of osmium isotope ratios adopt fixed canonical values of nonradiogenic isotope ratios, such as Nier’s value192Os/188Os = 3.083,28,29for mass bias correction of the
radiogenic isotope ratio. It is remarkable that Nier’s measure-ments have not been superseded after eight decades of progress in mass spectrometry.
TIMS has been the traditional instrument of choice to obtain high-accuracy osmium isotope ratio measurements, despite the investment of extensive sample preparation and long measurement times.26,30 In the last several decades, multicollector inductively coupled plasma mass spectrometry (MC-ICPMS) has become a powerful tool for the determi-nation of isotope ratios in a variety of applications,26,31largely
due to its advantages in sample introduction and high ionization efficiency.32It has been noted that MC-ICPMS is better suited to measure osmium isotope ratios compared to TIMS33 owing to the fact that ICP measures elemental ions
(Os+) directly whereas TIMS detects oxide ions (OsO 3−)
Received: April 25, 2018
Accepted: June 21, 2018
Published: June 21, 2018
pubs.acs.org/ac
Cite This:Anal. Chem. 2018, 90, 9281−9288
which requires further signal deconvolution. Despite these advantages, however, MC-ICPMS suffers much larger instrumental mass bias compared to that of TIMS.31Although the majority of the bias (if it is not caused by an interference effect) can be modeled using dependent laws, mass-independent fractionation (MIF) has been reported in MC-ICPMS for many elements including Nd,34−37 Ce,35 W,38
Sr,35,39Ge,40Pb,40Hg,40Si,41and Ba.42Consequently, proper mass bias correction is crucial when MC-ICPMS is used for the determination of absolute isotope ratios.
A primary method to calibrate isotope ratio measurement results utilizes gravimetric mixtures of near-pure isotopes with known chemical purity43(not to be confused with the double spike calibration). For an element with N stable isotopes, this primary approach is based on measuring all (N − 1) isotope ratios in all N isotopically enriched materials along with isotopic composition measurements of (N − 1) independent gravimetric mixtures of any two enriched materials. This model has been successfully employed for many two-isotope systems (Li and C)44,45 and three-isotope systems (Si)46,47 and recently adopted for more complex elements such as molybdenum.48 While this approach provides the highest metrological quality of isotope ratio measurements, it requires weighable quantities of all enriched isotopes in a chemically pure form. As the number of isotopes increases, so does the cost of enriched isotopes, efforts to characterize their chemical purities, as well as the complexity of mathematical calculations. Hence, cost-effective alternative approaches are often sought.
The aim of this study is to provide osmium isotopic composition measurements which are fully independent from any previous osmium isotope ratio measurements. The commonly used double spike calibration31 cannot help in this regard as it relies on a material (the double spike) whose isotope ratios have to be calibrated against a known Os isotope reference. To obtain calibrated osmium isotope ratios, the regression-based model49−52is employed. This method allows calibrating isotope ratios of an element using a known isotope ratio of another element without assuming that the two elements must necessarily display identical mass bias. This approach has been successfully applied to many elements such as zinc,49 iridium,52 mercury,53−55 germanium,56 indium,57
antimony,57 silver,57 copper,58 molybdenum,51,59 iron,60 lead,61,62 and gallium.63 In this work, we have employed the improved regression mass bias correction model51,52 using IRIS-1 iridium isotopic standard as calibrator.52
2. EXPERIMENTAL SECTION
2.1. Instrumentation. A Thermo Fisher Scientific Neptune Plus (Bremen, Germany) MC-ICPMS equipped with nine Faraday cups and a combined Scott-type on the top of a cyclonic spray chamber with a PFA self-aspirating nebulizer (Elemental Scientific, Omaha NE, USA), operating at 50 μL min−1, was used for all osmium isotope ratio measurements. A platinum guard electrode was fitted to the plug-in quartz torch with quartz injector. The instrument was operated under low mass resolution mode to perform isotope ratio measurements. Briefly, the instrument was tuned for maximum sensitivity and optimal peak shape as well as stable signals using a 1.0 mg kg−1 osmium solution. The gain calibration of the Faraday cups was then performed to ensure normalization of their efficiencies. Typical operating conditions are summarized in Table S1. Under these experimental conditions, acquisition of each measurement point takes
approximately 5.6 min. Longer measurement time (17 min) was tested in our preliminary experiments, and it provided similar precision for osmium isotope ratios. Thus, the short measurement time was adopted for all subsequent work.
2.2. Reagents and Solutions.Reagent grade nitric and hydrochloric acids (Fisher Scientific, Ottawa ON, Canada) were purified before use via a sub-boiling distillation system (Milestone Inc., Shelton CT, USA). A NanoPure mixed-bed ion exchange system with reverse osmosis domestic feedwater (Barnstead/Thermolyne Corp, Iowa USA) was used to prepare high-purity (18 MΩ cm) deionized water. Environ-mental grade aqueous ammonia (20−22% volume fraction) was obtained from Anachemia Science (Montreal, Canada).
Aqueous ammonia (5%) and hydrochloric acid (1%) solutions were used to reduce the osmium memory effect after each measurement session. A severe osmium memory effect was encountered with liquid introduction to MC-ICPMS during preliminary experiments. Commonly used rinsing solutions such as 3−5 M HCl26 and EtOH were tested without much success. As suggested by Nowell et al.,26 it is beneficial to keep osmium in a reduced or complexed state for a better washout. Thus, Na2SO3, NH2OH·HCl, and NH3·H2O were tested. It was found that alternate use of 5% ammonia solution and 1% HCl (blank solution) was sufficient to wash out osmium after a session of measurement to a blank level within 30 min, likely due to the ability of ammonia to complex osmium ions. We also rinsed the spray chamber daily with 5% ammonia, 5% HCl, and water to reduce the memory effects.
Six osmium materials were purchased from different commercial vendors as summarized inTable 1. Two osmium
standard solutions (1000 mg kg−1) were sourced from SCP Science (Baie D’Urfé QC, Canada) and one from Merck (Darmstadt, Germany)all originally prepared from (NH4)2OsCl6 salt. High-purity osmium chloride, OsCl3· 3H2O (99.99% purity, Alfa Aesar, Tewksbury, MA, USA) was dissolved in 10% HCl to obtain the osmium standard solution (Os-3) with mass fraction of osmium w(Os) = 350 mg kg−1. A fifth osmium standard solution (Os-4), w(Os) = 350 mg kg−1, was prepared by dissolution of high-purity ammonium chloroosmate, (NH4)2OsCl6 (99.99% purity, Sigma-Aldrich, Oakville ON, Canada) in 10% HCl. The Durham Romil Osmium reference material (DROsS) was sourced from IAGEO Ltd. (Keyworth, Nottingham UK).
The primary isotope ratio calibrator employed in this work was Certified Reference Material of iridium (IRIS-1, 1000 mg kg−1) from National Research Council Canada (NRC, Ottawa, Canada) with certified isotope ratio value R193/191= N(193Ir)/ N(191Ir) = 1.6866(5)k=1.52
2.3. Sample Preparation and Analysis.Stock solutions of osmium and iridium were diluted with 1% HCl to prepare test solutions with mass fractions w(Os) = 1.3−1.8 mg kg−1 and w(Ir) = 1.0−1.8 mg kg−1. A self-aspiration mode was used Table 1. Osmium Standards Used in This Work
Symbol Compound Source
Os-1 Os standard solution from (NH4)2OsCl6 SCP OSIS-1 Os standard solution from (NH4)2OsCl6 SCP Os-2 Os standard solution from (NH4)2OsCl6 Merck
Os-3 OsCl3·3H2O Alfa Aesar
Os-4 (NH4)2OsCl6 Sigma-Aldrich
DROsS Os standard solution from (NH4)2OsCl6 IAGEO Ltd.
Analytical Chemistry Article
DOI:10.1021/acs.analchem.8b01859
Anal. Chem. 2018, 90, 9281−9288
for sample introduction. Two Faraday cup configurations were employed to collect all isotopes of osmium and iridium. Isotopes184Os,186Os,187Os,188Os,189Os,190Os,191Ir, and193Ir were measured using the main cup configuration, and isotopes 187Os, 188Os, 189Os, 190Os, 191Os, 192Os, and 193Ir were measured using the subcup configuration (see Table S1). Similar to the settings for the determination of iridium isotopic composition in our previous study,52 the instrument plasma radio frequency (RF) power was increased from the optimum value P0 (which corresponds to the highest sensitivity and stable signal, typically at 1240 W) to Pmaxwherein the osmium isotope signal decreased by approximately 25%, compared to its value at P0. The isotopic composition of all samples was determined five times at incrementally increasing the RF power with values of (Pmax− P0)·N/4 where N = 0, 1, 2, 3, and 4. This results in five sets of osmium (and iridium) isotope ratios and takes approximately 35 min. The measurement duration at each RF power was kept identical. Signals of all monitored isotopes in every point were subtracted by their corresponding intensity in 1% HCl blank solution at optimum RF power, P0. All data sets reported in this study were collected between August of 2017 and January of 2018.
Since the abundance of osmium-184 is 3 orders of magnitude lower than the most abundant isotopes of osmium, the signal of184Os+in a 1.8 mg kg−1Os standard solution was lower than 20 mV. Thus, a 1013Ω resistor64−66,67was used for the Faraday cup L4 which measures the osmium-184. The quality of each set of data was monitored via the determination coefficient (R2) of the regressions, which was R2> 0.9995 for all isotopes except osmium-184. Due to the low abundance of 184Os, the R2 values for the regressions ln(r
184/188) against ln(r193/191) were R2> 0.99.
2.4. Spectral Interferences. Impurities of specific elements in the samples could create spectral interferences (as shown inTable S2) for the measurements of osmium and iridium isotopes. Quantitative analysis of six different source osmium solutions (1.8 mg kg−1) spiked with iridium (1.3 mg kg−1) revealed that the mass fractions of erbium, lutetium, ytterbium, hafnium, tungsten, and rhenium were all less than 2
ng kg−1, while platinum was present at levels below 40 ng kg−1. Although the concentration of platinum was somewhat higher, interferences contributed from platinum and other elements were not significant since the mass fractions of osmium and iridium in the analyzed samples were several orders of magnitude higher than the mass fraction of platinum. A 1.8 mg kg−1Os standard produced 29.5 and 47.2 V for190Os and 192Os, respectively, whereas the 1% HCl blank produced 2.0 mV and 3.1 mV for 190Os and 192Os, respectively. This was further confirmed by the fact that a 5000 μg kg−1 platinum solution produced blank level intensities of 2.0 mV and 3.1 mV for190Os and192Os, respectively, the same as in the 1% HCl blank solution.
3. RESULTS AND DISCUSSION
3.1. Correction for Instrumental Fractionation (Mass Bias). Calibrated isotope ratio measurements are typically performed with the use of gravimetric mixtures of near-pure isotopes.43 This primary measurement method (not to be confused with double spike calibration) requires all separated near-pure stable isotopes of an element in weighable quantities which is not feasible for osmium. In this work we have employed the cost-effective regression mass bias correction model which presents itself as an alternative secondary method for isotope ratio measurements and relies on the availability of primary isotope reference material of another element. The regression mass bias correction model is based on the observed correlated temporal drift between several isotope ratios of the same or distinct elements,31,50,52 as shown in Figure 1 for osmium and iridium isotope ratios:
= +
r a b r
ln i/188Os i i ln 193/191Ir (1)
where coefficients aiand bi are the intercept and slope of the corresponding linear regression which are obtained using the least-squares fitting of data. Here the true isotope ratio is directly linked to its measured ratio by a correction factor K, Ri/188Os = Ki/188Os ·ri/188Os and R193/191lr = K193/191lr ·r193/191lr (note that KOsdoes not need to be equal to KIr). The regression model provides values for all Ki/188Os separately without the need to
impose any mass-dependent relationship between these values (such as the Russell law).Equation 1can be used to obtain the corrected isotope ratios without assuming identical mass bias for different isotope pairs:50,52
= ·
Ri/188Os (R193/191Ir )bieai
(2)
Although MC-ICPMS is equipped with nine Farday cups which would, in principle, allow for simultaneous measurement of all seven osmium isotopes and both iridium isotopes, spatial restrictions of the Faraday cups made it necessary to split the analysis in two lines. Osmium isotope ratios 184/188, 186/ 188, 187/188, 189/188, and 190/188 were established from the main line. The intensity of iridium-193 was imputed from the main line and linearly scaled to the iridium-191 intensity from the subline measurements (see cup configuration in Table S1). Such imputation was made posible due to large (half percent) gradual changes in the measured isotope ratios at different ICPMS RF power. Osmium isotope ratios 187/ 188, 189/188, 190/188, and 192/188 were then established and the results from the two measurements averaged.
It is important to note that this refined regression calibration model is not derived from either the exponential or the Russell’s isotope ratio fractionation law as it is commonly perceived and orginally presented.49 Rather, it relies on the invariability of the ratio of the fractionation coefficients and is capable of correcting both dependent and mass-independent isotope ratio fractionation occurring in MC-ICPMS.40,50,52 Given that each osmium isotope ratio is calibrated separately as shown in Figure 1, this refined regression model does not invoke the assumption that the mass bias between the various isotope ratios of an element varies smoothly as a function of nuclide mass differencean assumption that is at the core of double spike calibration which is another frequently employed secondary isotope ratio calibration method. The regression model allows for different mass bias between osmium and iridium. In addition, both the analyte and the calibrator are measured simultaneously in the same solution, thus eliminating any effect of the sample matrix. Matching the absolute signal levels of the analyte and the calibrator has an insignificant effect on the results, as demonstrated in our previous study.52
3.2. Uncertainty Evaluation.Uncertainty estimations for the calibrated osmium isotope ratios were done in accordance with the JCGM 100:2008 “Guide to the Expression of Uncertainty in Measurement” and its Supplement 1.68 In short, ordinary least-squares fit was applied to each regression set, and the corresponding intercept, slope, and their uncertainties were obtained. From these values, one calculates the osmium isotope ratios as pereq 2. The values for the three variables ineq 2(R193/191, a, and b) were modeled as random numbers drawn from the probability distributions representing the available knowledge about them. In particular, R193/191was modeled as normal distribution with the mean R193/191and its reported standard uncertainty u(R193/191) whereas a and b for each measurement set are modeled jointly as a bivariate normal distribution with the mean estimates and covariance matrix deriving from the ordinary least-squares fitting of the data (parametric bootstrap resampling). This procedure was repeated 105 times, and the best estimate of the calibrated osmium isotope ratios and their uncertainty is obtained from the resulting histograms.
We note that osmium isotope ratio uncertainties reported in the literature are significantly smaller than we report here because they are invariably based on the assumed fixed values (e.g., Nier’s value (1937) of 3.083 for 192Os/188Os) without uncertainty for the corresponding normalizing ratios. In this work, we have not constrained the measurement results to Nier’s values. Instead, our results are ultimately traceable to NIST isotopic reference materials of rhenium and thallium and our results fully incorporate the corresponding uncertainties of these standards.
3.3. Isotopic Abundances and Atomic Weight of Osmium. The isotopic abundances and atomic weight of osmium were calculated from the isotope ratios.69 The uncertainty of isotopic abundances and the atomic weight of osmium were propagated from the corresponding isotope ratio uncertainties, while taking into account the covariances. Uncertainty propagation of the isotope ratios into the corresponding isotopic abundances and atomic weight was done using the R package CIAAWconsensus.70 The atomic masses of osmium isotopes used for calculations in this report are from the 2016 Atomic Mass Evaluation.71
3.4. Measurement Results for OSIS-1 Standard. Osmium isotope ratio measurements in OSIS-1 standard were performed with replicate solutions containing 1.2−1.8 mg kg−1of osmium and 1.0−1.8 mg kg−1of iridium during a three-month period from August of 2017 to January of 2018. During this period, six different sets of ICP cones were used and a total of 156 sets of osmium−iridium regressions were obtained. The results of osmium isotope ratios (R) and isotopic abundances (x) are shown inTable 2and the corresponding atomic weight of osmium in the OSIS-1 standard is Ar(Os) = 190.2407(7)k=1.
3.5. Effect of the Sample Provenance. A core assumption in isotope systematics of many elements, including osmium, is that the ratios of nonradiogenic isotopes are expected not to vary in nature whereas ratios involving osmium-187 will vary significantly. We have surveyed the isotopic composition of five commercial osmium standards relative to OSIS-1 showing significant spread in the 187Os/188Os ratio (Table 3).
No significant differences in the osmium isotope ratios were found at 1 part per thousand level measurement uncertainty with the exception of the ratios involving osmium-187; relative variations in the187Os/188Os ratio, however, reached 50%. For example, R187/188(Os) = 0.1159(2) in OSIS-1 standard whereas Table 2. Osmium Isotope Ratios and Abundances in the OSIS-1 Standarda
Atomic mass
number, i Isotope ratio,Ri/187
Isotope ratio, Ri/188 Isotopic abundance, x(i Os) 184 0.011 20(6) 0.001 30(1) 0.000 172(1) 186 1.032(2) 0.119 73(5) 0.015 902(14) 187 1 (exact) 0.1159(2) 0.015 397(26) 188 8.626(13) 1 (exact) 0.132 817(70) 189 10.53(2) 1.2201(3) 0.162 053(53) 190 17.12(3) 1.9850(8) 0.263 642(50) 192 26.63(5) 3.087(3) 0.410 017(185)
aValues are presented in a concise notation whereby the combined
standard uncertainty is given in parentheses next to the least significant digits to which it applies; for example, R192/188= 3.087(3) represents a mean value of R192/188= 3.087 with combined standard uncertainty uc(R192/188) = 0.003.
Analytical Chemistry Article
DOI:10.1021/acs.analchem.8b01859
Anal. Chem. 2018, 90, 9281−9288
in DROsS it is R187/188(Os, DROsS) = R187/188(Os, OSIS-1) × [1 + δOs‑1(Os, DDrOsS)] and results in a value of R187/188(Os, DROsS) = 0.1159(2) × [1 + 0.3908(2)] = 0.1612(3).
The “certified” values for radiogenic isotope ratios of R187/188 and R186/188 in DROsS are listed as 0.160 924(4) and 0.119 9293(58),33shown in Table 4, which are in agreement with our measurements. This agreement, however, is largely due to the fact that our estimate of192Os/188Os, 3.087(3), aligns well with the frequently used fixed value of 3.083 (Nier’s value in 1937). It is important to appreciate that the values frequently used in geosciences, including the DROsS value, do not carry full uncertainty statements as they are based on assumed fixed values of a nonradiogenic isotope ratio of osmium (by a fixed value we mean one that carries no associated uncertainty).
3.6. Isotopic Abundance of Osmium-184. Despite osmium-184 being the least abundant of all isotopes, it plays a key role in the study of nucleosynthetic processes, in particular the P-process, occurring in stars.33,72,73 Luguet et al.33used the ratio184Os/188Os as a second normalizing ratio for mass bias correction despite the fact that its true value is not well-known. Nier reported 184Os/192Os = 0.000 43,29
whereas Luck and Allegre reported ca. 30% higher value in Merck standard, 184Os/192Os = 0.000 58 ± 0.000 07. Our results for OSIS-1 provide184Os/192Os = 0.000 421 ± 0.000 005 (k = 2) which supports Nier’s value and other compilations made by Masuda et al., who reported 184Os/192Os ratios of 0.000 42, 0.000 50, and 0.000 45, from three commercial osmium reagents,74 and is also close to 184Os/192Os = 0.000 48 ± 0.000 11 reported by the value of Völkening et al.3
3.7. Mass-Independent Fractionation.Typical analyses of osmium isotopes rely on the invariance of nonradiogenic ratios and on the applicability of a mass bias correction model. This approach adopts a fixed true value, as an example, for the 192Os/188Os ratio and then uses the measured isotope ratio value to correct all other osmium isotope ratios for the instrumental fractionation using a function that extends the observed mass bias from one isotope ratio to all others. Frequently such function is the Russell’s mass bias model which asserts that the relative bias of the measured isotope
ratios is proportional to the mass difference of these isotopes in a logarithmic scale: = − − K K m m m m
ln ( Os/ Os)/ln ( Os/ Os) (ln ( Os) ln ( Os)) /(ln ( Os) ln ( Os)) A B C D A B C D (3)
Here K(iOs/jOs) is the bias of the corresponding isotope ratio, defined as the ratio of the true (calibrated) and the measured (raw) isotope ratios.
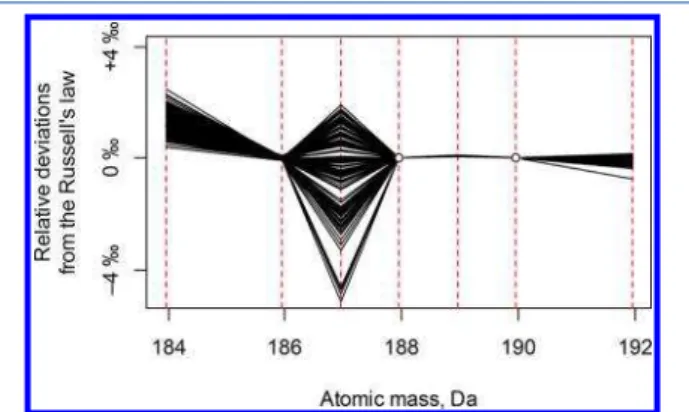
In order to evaluate the relationships between the observed mass bias values, we have evaluated the measurements of the OSIS-1 standard. For each measurement, the value K(190Os/188Os) was then used to calculate all other values as per Russell’s law (eq 3). The obtained values, KR(AOs/188Os), were then compared to the actual values of K(AOs/188Os). The ratio of the calculated and observed mass bias values for all osmium isotope ratios is shown inFigure 2.
Our results show that the190Os/188Os isotope ratio can be used reasonably well in conjunction with the Russell’s model to correct the instrumental discrimination in MC-ICPMS of isotope ratio 189Os/188Os. However, the mass bias of 187Os/188Os does not follow the mass-dependent model. We observed relative deviations from the mass-dependent fractionation model in the order of a few parts per thousand for the 187Os/188Os ratio. Deviations from Russell’s law can also be evidenced from the slopes of the measured isotope ratios. The slope of the lnr187/188 vs lnr190/188 plot is the (logarithmic) ratio of the corresponding average mass biases, which, according toeq 3implies that the slope of the lnr187/188 vs lnr189/188 plot is (lnm187 − lnm188)/(lnm189 − lnm188) = Table 3. Relative Isotope Ratios (Isotope Deltas) of
Osmium in Several Commercial Reagents against OSIS-1 Standard, δOSIS‑1(Os)a
Material 187Os/188Os 189Os/188Os
Os-1 −78.7(1) ‰ +0.05(9) ‰
Os-2 +405.9(2) ‰ −0.32(14) ‰
Os-3 −78.1(1) ‰ +0.24(10) ‰
Os-4 −24.0(1) ‰ −0.29(12) ‰
DROsS +390.8(2) ‰ −0.16(10) ‰
a1s is given in parentheses next to the least significant digits to which
it applies.
Table 4. Summary of Osmium Isotope Ratios Obtained for the DROsS Standard
Method Lead author R187/188 R186/188 Traceability ref
DS N-TIMSa Luguet, 2008 0.160924 ± 4 0.1199293 ± 58 R192/188= 3.083 33 DS MC-ICPMSa Nanne, 2017 0.160916 ± 20 0.119909 ± 17 R 192/188= 3.083 24 DS N-TIMSa Nanne, 2017 0.160916 ± 43 0.119909 ± 43 R192/188= 3.083 24
MC-ICPMSb this work 0.16119 ± 60 0.11986 ± 10 NRC IRIS-1
aReproducibility standard deviations are quoted, ±2s.bCombined expanded uncertainty is quoted in the parentheses, ±2u.
Figure 2. Deviations from Russell’s law in the MC-ICPMS measurements of OSIS-1. All mass bias values were calculated from the190Os/188Os isotope ratio which were then compared to the values determined independently using the regression-based method (from the results shown inTable 2). The black lines connect the observed deviations from the Russell’s law of osmium isotope ratios from each measurement sequence.
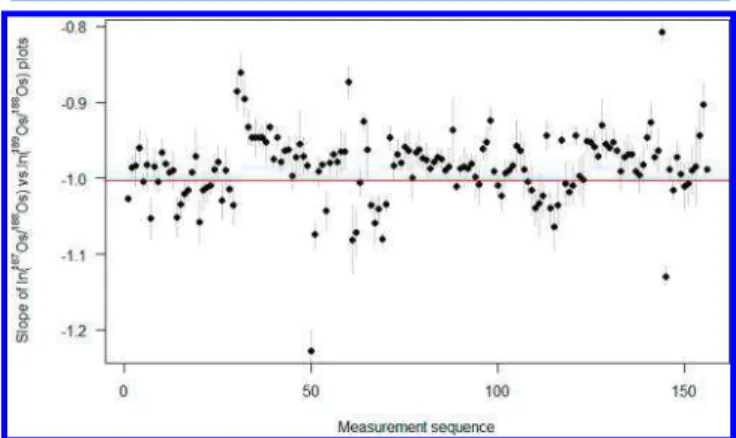
−1.003. Our measurements of OSIS-1 provide regression slopes ranging from −1.23 to −0.81 (see Figure 3). The
random character of the three-isotope plot slopes demonstrates that the instrumental fractionation of osmium isotope ratios in MC-ICPMS is not entirely driven by mass-dependent fractionation and that a significant component remains unexplained (and is commonly known as the mass-independent fractionation). The 20% variation of the three-isotope plot slope shown inFigure 3has the effect of imparting an uncertainty to the mass-bias corrected187Os/188Os isotope ratio from the assumed189Os/188Os value in the order of a few parts per thousand.
We suggest that deviations from the mass-dependent behavior are a reason in the observed 3 parts per thousand spread in the MC-ICPMS interlaboratory comparison data.75 This study was conducted under the auspices of the International Association of Geoanalysts (IAG) in 2011 and was concluded with the following comment by the organizers: “discrepancies between the results [of 187Os/188Os] of the participating laboratories are all too obvious, challenging their presumed “expertise”.75
The exact causes of MIF in MC-ICPMS are still unclear35,36,38,40,41,76−83and two physical effects are frequently thought to cause MIF: the nuclear volume effect and the magnetic isotope effect.77,78 Detailed explanations of both effects can be found elsewhere.76,78,79However, these effects cannot fully explain the observed MIF in Os isotopes. For example, both isotopes of 187Os and 189Os have nonzero nuclear spin values, yet significant MIF was observed only for 187Os. More research in this area is needed to facilitate our understanding of MIF occurring in MC-ICPMS, but it is beyond the scope of current study.
3.8. Canonical Reference Values. To the best of our knowledge, all previous osmium isotope ratio measurements rely, directly or indirectly, on osmium isotope ratios measured by Nier in 1937.29Although the 1937 study reported isotope ratio N(192Os)/N(188Os) = 100/32.4 = 3.0864, in a later publication,84 Nier summarized these values as N(192Os)/ N(188Os) = 41.0/13.3 = 3.0827, which is the value often used today.85,86 Further to this, others have renormalized Nier’s values, which alters the value for188Os from 32.4 to 32.44, thus giving rise to yet another normalizing ratio for192Os/188Os = 3.082 614 (=100/32.44).2,25,87−89Despite these discrepancies,
most researchers rely on normalizing osmium isotope ratios
against conventional values which are not fully standardized. Nier himself noted that the abundance of 188Os relative to 192Os “is correct to one percent” which means that the ratio 192Os/188Os provided by Nier is to be interpreted as 3.08 ± 0.03 and not “3.083”. Conferring any additional digits to Nier’s value is unjustified.
Chatterjee and Lassiter, for example, have noted that the canonical values used in most studies are mutually incon-sistent90referring to a parts per million level discrepancy in the 189Os/188Os ratios used by others (1.219 78 vs 1.219 73). In 1983, Luck and Allegre admitted that these reference values are “arbitrary”85and the situation has not changed since then. In this vein, although the aim of this work was to provide determination of osmium isotope ratios independent of any conventions, the values obtained for the OSIS-1 (Figure 4) might be of relevance in debating the choice of conventional osmium isotope ratios which ideally would coincide with our best estimates of the corresponding true values.
4. CONCLUSIONS
We have determined the isotopic composition of osmium standard solution which will become certified reference material OSIS-1 available from the NRC. Our MC-ICPMS measurement is the first independent determination of osmium isotopic composition since Nier (1937). In the absence of separated osmium isotope standards, we rely on the optimized regression mass bias correction model with the values ultimately traceable to the NIST thallium standard 997 and NIST rhenium standard 989 through NRC iridium standard IRIS-1. We also report significant departures in MC-ICPMS from the Russell’s mass-dependent fractionation model (mass independent fractionation) for isotopes187Os and 192Os.
■
ASSOCIATED CONTENT*
S Supporting InformationThe Supporting Information is available free of charge on the ACS Publications website at DOI: 10.1021/acs.anal-chem.8b01859.
Tables S1. MC-ICP-MS operating conditions. Table S2. Possible interferences on measured isotopes. (PDF)
■
AUTHOR INFORMATIONCorresponding Author
*E-mail:[email protected].
ORCID
Lu Yang:0000-0002-6896-8603
Figure 3. Deviations from the Russell’s law in the MC-ICPMS measurements of OSIS-1 as evidenced from the random variation of the three-isotope plot slope.
Figure 4.Histograms of the osmium isotope ratios in the OSIS-1 standard along with typical canonical reference values.
Analytical Chemistry Article
DOI:10.1021/acs.analchem.8b01859
Anal. Chem. 2018, 90, 9281−9288
Notes
The authors declare no competing financial interest.
■
ACKNOWLEDGMENTSChina Scholarship Council is gratefully acknowledged for financial support of Z. Zhu and S. Tong during the study.
■
REFERENCES(1) Riley, G. H.; Delong, S. E. Int. J. Mass Spectrom. Ion Phys. 1970, 4, 297−304.
(2) Creaser, R. A.; Papanastassiou, D. A.; Wasserburg, G. J. Geochim. Cosmochim. Acta 1991, 55, 397−401.
(3) Völkening, J.; Walczyk, T.; Heumann, K. G. Int. J. Mass Spectrom. Ion Processes 1991, 105, 147−159.
(4) Shirey, S. B.; Walker, R. J. Annu. Rev. Earth Planet. Sci. 1998, 26 (1), 423−500.
(5) Carlson, R. W. Lithos 2005, 82, 249−272.
(6) Walker, R. J.; Horan, M. F.; Morgan, J. W.; Becker, H.; Grossman, J. N.; Rubin, A. E. Geochim. Cosmochim. Acta 2002, 66, 4187−4201.
(7) Meisel, T.; Walker, R. J.; Morgan, J. W. Nature 1996, 383, 517− 520.
(8) Brandon, A. D.; Walker, R. J.; Morgan, J. W.; Norman, M. D.; Prichard, H. M. Science 1998, 280, 1570−1573.
(9) Walker, R. J. Chem. Erde 2009, 69, 101−125.
(10) Snow, J. E.; Reisberg, L. Earth Planet. Sci. Lett. 1995, 136, 723− 733.
(11) Meibom, A.; Sleep, N. H.; Chamberlain, C. P.; Coleman, R. G. Nature 2002, 419, 705−708.
(12) Brandon, A. D.; Creaser, R. A.; Shirey, S. B.; Carlson, R. W. Science 1996, 272, 861−863.
(13) Pearson, D. G.; Parman, S. W.; Nowell, G. M. Nature 2007, 449, 202−205.
(14) Dale, C. W.; Gannoun, A.; Burton, K. W.; Argles, T. W.; Parkinson, I. J. Earth Planet. Sci. Lett. 2007, 253, 211−225.
(15) Stein, H. J.; Sundblad, K.; Markey, R. J.; Morgan, J. W.; Motuza, G. Miner. Deposita 1998, 33, 329−345.
(16) Burton, K. W. J. J. Geochem. Explor. 2006, 88, 262−265. (17) Pegram, W. J.; Krishnaswami, S.; Ravizza, G. E.; Turekian, K. K. Earth Planet. Sci. Lett. 1992, 113, 569−576.
(18) Peucker-Ehrenbrink, B.; Ravizza, G. Terra Nova 2000, 12, 205− 219.
(19) Ravizza, G. E.; Bothner, M. H. Geochim. Cosmochim. Acta 1996, 60, 2753−2763.
(20) Klemm, V.; Levasseur, S.; Frank, M.; Hein, J. R.; Halliday, A. N. Earth Planet. Sci. Lett. 2005, 238, 42−48.
(21) Gannoun, A.; Burton, K. W. J. Anal. At. Spectrom. 2014, 29, 2330−2342.
(22) Mathur, R.; Ruiz, J.; Tornos, F. Miner. Deposita 1999, 34, 790− 793.
(23) Walker, R. J.; Morgan, J. W. Science 1989, 243, 519−522. (24) Nanne, J. A.; Millet, M. A.; Burton, K. W.; Dale, C. W.; Nowell, G. M.; Williams, H. M. J. Anal. At. Spectrom. 2017, 32, 749−765.
(25) Hirata, T.; Hattori, M.; Tanaka, T. Chem. Geol. 1998, 144, 269−280.
(26) Nowell, G. M.; Luguet, A.; Pearson, D. G.; Horstwood, M. S. A. Chem. Geol. 2008, 248, 363−393.
(27) Meija, J. Nat. Chem. 2014, 6, 749−750.
(28) Meija, J.; Coplen, T. B.; Berglund, M.; Brand, W. A.; De Bievre, P.; Groning, M.; Holden, N. E.; Irrgeher, J.; Loss, R. D. Pure Appl. Chem. 2016, 83, 265−291.
(29) Nier, A. O. Phys. Rev. 1937, 52, 885.
(30) Wang, G.; Sun, T.; Xu, J. Rapid Commun. Mass Spectrom. 2017, 31, 1616−1622.
(31) Yang, L. Mass Spectrom. Rev. 2009, 28, 990−1011. (32) Walczyk, T. Anal. Bioanal. Chem. 2004, 378, 229−231. (33) Luguet, A.; Nowell, G. M.; Pearson, D. G. Chem. Geol. 2008, 248, 342−362.
(34) Vance, D.; Thirlwall, M. Chem. Geol. 2002, 185, 227−240. (35) Newman, K.; Freedman, P. A.; Williams, J.; Belshaw, N. S.; Halliday, A. N. J. Anal. At. Spectrom. 2009, 24, 742−751.
(36) Newman. J. Anal. At. Spectrom. 2012, 27, 63−70.
(37) Xu, L.; Hu, Z.; Zhang, W.; Yang, L.; Liu, Y.; Gao, S.; Luo, T.; Hu, S. J. Anal. At. Spectrom. 2015, 30, 232−244.
(38) Shirai, N.; Humayun, M. J. Anal. At. Spectrom. 2011, 26, 1414− 1420.
(39) Irrgeher, J.; Prohaska, T.; Sturgeon, R. E.; Mester, Z.; Yang, L. Anal. Methods 2013, 5, 1687−1694.
(40) Yang, L.; Mester, Z.; Zhou, L.; Gao, S.; Sturgeon, R. E.; Meija, J. Anal. Chem. 2011, 83, 8999−9004.
(41) Yang, L.; Zhou, L.; Hu, Z.; Gao, S. Anal. Chem. 2014, 86, 9301−9308.
(42) Miyazaki, T.; Kimura, J. I.; Chang, Q. J. Anal. At. Spectrom. 2014, 29, 483−490.
(43) Meija, J. Anal. Bioanal. Chem. 2012, 403, 2071.
(44) Qi, H. P.; Berglund, M.; Taylor, P. D. P.; Hendrickx, F.; Verbruggen, A.; De Bièvre, P. Fresenius' J. Anal. Chem. 1998, 361, 767−773.
(45) Malinovsky, D.; Dunn, P. J. H.; Goenaga-Infante, H. J. Anal. At. Spectrom. 2013, 28, 1760−1771.
(46) Rienitz, O.; Pramann, A.; Schiel, D. Int. J. Mass Spectrom. 2010, 289, 47−53.
(47) Yang, L.; Mester, Z.; Sturgeon, R. E.; Meija, J. Anal. Chem. 2012, 84, 2321−2327.
(48) Song, P.; Wang, J.; Ren, T.; Zhou, T.; Zhou, Y.; Wang, S. Anal. Chem. 2017, 89, 9031−9038.
(49) Maréchal, C. N.; Télouk, P.; Albarède, F. Chem. Geol. 1999, 156, 251−273.
(50) Yang, L.; Meija, J. Anal. Chem. 2010, 82, 4188−4193. (51) Malinovsky, D.; Dunn, P. J. H.; Goenaga-Infante, H. J. Anal. At. Spectrom. 2016, 31, 1978−1988.
(52) Zhu, Z.; Meija, J.; Zheng, A.; Mester, Z.; Yang, L. Anal. Chem. 2017, 89, 9375−9382.
(53) Yang, L.; Sturgeon, R. E. Anal. Bioanal. Chem. 2009, 393, 377− 385.
(54) Meija, J.; Yang, L.; Sturgeon, R. E.; Mester, Z. J. Anal. At. Spectrom. 2010, 25, 384−389.
(55) Xie, Q.; Lie, S.; Evans, D.; Dillon, P.; Hintelmann, H. J. J. Anal. At. Spectrom. 2005, 20, 515−522.
(56) Yang, L.; Meija, J. Anal. Chem. 2010, 82, 4188−4193. (57) Yang, L.; Sturgeon, R. E.; Mester, Z.; Meija, J. Anal. Chem. 2010, 82, 8978−8982.
(58) Hou, Q.; Zhou, L.; Gao, S.; Zhang, T.; Feng, L.; Yang, L. J. Anal. At. Spectrom. 2016, 31, 280−287.
(59) Anbar, A. D.; Knab, K. A.; Barling. Anal. Chem. 2001, 73, 1425−1431.
(60) Arnold, G. L.; Weyer, S.; Anbar, A. D. Anal. Chem. 2004, 76, 322−327.
(61) White, W. M.; Albarède, F.; Télouk, P. Chem. Geol. 2000, 167, 257−270.
(62) Collerson, K. D.; Kamber, B. S.; Schoenberg, R. Chem. Geol. 2002, 188, 65−83.
(63) Yuan, W.; Chen, J. B.; Birck, J. L.; Yin, Z. Y.; Yuan, S. L.; Cai, H. M.; Wang, Z. W.; Huang, Q.; Wang, Z. H. Anal. Chem. 2016, 88, 9606−9613.
(64) Bouman, C.; Trinquier, A.; LIoyd, N.; Schwieters, J.; Koornneef, J.; Davies, G. Application Note 30282; Thermo Fisher Scientific: Bremen, Germany, 2015.
(65) Koornneef, J. M.; Bouman, C.; Schwieters, J. B.; Davies, G. R. Anal. Chim. Acta 2014, 819, 49−55.
(66) Gustinelli Arantes de Carvalho, G.; Vitoriano Oliveira, P.; Yang, L. J. Anal. At. Spectrom. 2017, 32, 987−995.
(67) Meija, J.; Yang, L.; Sturgeon, R. E.; Mester, Z. Anal. Chem. 2009, 81, 6774−6778.
(68) JCGM. Evaluation of measurement data − Supplement 1 to the “Guide to the expression of uncertainty in measurement” − Propagation of distributions using a Monte Carlo method; JCGM 101; 2008.
(69) Meija, J.; Mester, Z. Metrologia 2008, 45, 53−62. (70) Meija, J.; Possolo, A. Metrologia 2017, 54, 229−238. (71) Wang, M.; Audi, G.; Kondev, F. G.; Huang, W. J.; Naimi, S.; Xu, X. Chin. Phys. C 2017, 41, 030003.
(72) Liu, Y.; Huang, M.; Masuda, A.; Inoue, M. Int. J. Mass Spectrom. Ion Processes 1998, 173, 163−175.
(73) Brandon, A. D.; Walker, R. J.; Puchtel, I. S. Geochim. Cosmochim. Acta 2006, 70, 2093−2103.
(74) Masuda, A.; Hirata, T.; Shimizu, H. Geochem. J. 1986, 20, 233− 239.
(75) Meisel, T.; Kane, J. S. Accredit. Qual. Assur. 2011, 16, 407−414. (76) Fujii, T.; Moynier, F.; Albarède, F. Chem. Geol. 2009, 267, 139−156.
(77) Malinovsky, D.; Vanhaecke, F. Anal. Bioanal. Chem. 2011, 400, 1619−1624.
(78) Bigeleisen, J. J. Am. Chem. Soc. 1996, 118, 3676−3680. (79) Bergquist, B. A.; Blum, J. D. Science 2007, 318, 417−420. (80) Buchachenko, A. L. J. Phys. Chem. A 2001, 105, 9995−10011. (81) Shirai, N.; Humayun, M. J. Anal. At. Spectrom. 2011, 26, 1414− 1420.
(82) Angeli, I. At. Data Nucl. Data Tables 2004, 87, 185−206. (83) Tables of Nuclear Data:http://wwwndc.jaea.go.jp/NuC/index.
html.
(84) Bainbridge, K. T.; Nier, A. O. Relative Isotopic Ahundances of the Elements (Vol. 9), Preliminary Report; National Academies, 1950.
(85) Luck, J. M.; Allègre, C. J. Nature 1983, 302, 130−132. (86) Dickin, A. P.; McNutt, R. H.; McAndrew, J. I. J. Anal. At. Spectrom. 1988, 3, 337−342.
(87) Schoenberg, R.; Nägler, T. F.; Kramers, J. D. Int. J. Mass Spectrom. 2000, 197, 85−94.
(88) Yin, Q. Z.; Jacobsen, S. B.; Lee, C. T.; McDonough, W. F.; Rudnick, R. L.; Horn, I. Geochim. Cosmochim. Acta 2001, 65, 2113− 2127.
(89) Meija, J.; Coplen, T. B.; Berglund, M.; Brand, W. A.; De Bièvre, P.; Gröning, M.; Holden, N. E.; Irrgeher, J.; Loss, R. D.; Walczyk, T.; Prohaska, T. Pure Appl. Chem. 2016, 88, 293−306.
(90) Chatterjee, R.; Lassiter, J. C. Chem. Geol. 2015, 396, 112−123.
Analytical Chemistry Article
DOI:10.1021/acs.analchem.8b01859
Anal. Chem. 2018, 90, 9281−9288