Publisher’s version / Version de l'éditeur:
Journal of Applied Chemistry and Biotechnology, 22, pp. 1125-1138, 1972-12-01
READ THESE TERMS AND CONDITIONS CAREFULLY BEFORE USING THIS WEBSITE. https://nrc-publications.canada.ca/eng/copyright
Vous avez des questions? Nous pouvons vous aider. Pour communiquer directement avec un auteur, consultez la première page de la revue dans laquelle son article a été publié afin de trouver ses coordonnées. Si vous n’arrivez pas à les repérer, communiquez avec nous à PublicationsArchive-ArchivesPublications@nrc-cnrc.gc.ca.
Questions? Contact the NRC Publications Archive team at
PublicationsArchive-ArchivesPublications@nrc-cnrc.gc.ca. If you wish to email the authors directly, please see the first page of the publication for their contact information.
NRC Publications Archive
Archives des publications du CNRC
This publication could be one of several versions: author’s original, accepted manuscript or the publisher’s version. / La version de cette publication peut être l’une des suivantes : la version prépublication de l’auteur, la version acceptée du manuscrit ou la version de l’éditeur.
Access and use of this website and the material on it are subject to the Terms and Conditions set forth at
Influence of triethanolamine on the hydration characteristics of
tricalcium silicate
Ramachandran, V. S.
https://publications-cnrc.canada.ca/fra/droits
L’accès à ce site Web et l’utilisation de son contenu sont assujettis aux conditions présentées dans le site LISEZ CES CONDITIONS ATTENTIVEMENT AVANT D’UTILISER CE SITE WEB.
NRC Publications Record / Notice d'Archives des publications de CNRC:
https://nrc-publications.canada.ca/eng/view/object/?id=7877be5b-d657-44be-8962-5e5096c91d80 https://publications-cnrc.canada.ca/fra/voir/objet/?id=7877be5b-d657-44be-8962-5e5096c91d805e-r.
7-l4
I
B%\r2
no-
54-L
National Research Council of Cai~ada Conseil Natioi~al de Recherches du Canada
Influence of Triethanolamine on the Hydration
Characteristics of Tricalcium Silicate
by
V. S. Ramachandran
Reprinted from
Journal of Applied Chemistry and Biotechnology Vol. 22, 1972
14p.
Research Paper No. 542 of the
Division of Building Research
Ottawa
December 1972
L'lnfluence du Triethanolarnine sur les Caracteristiques d'Hydratation du Silicate de Tricalciuni
L'auteur Ctudie les caracteristiques d'hydratation du 3 C a 0 . S i 0 2 ou p2Ca0.Si02 par ['addition d e 0.0%, 0.1 %, 0.5 "/, ou 1.0% d e triethanolarnine (TEA). La quantitk d e Ca(OH)2 qui se forme en I, 3, 7 ou 28 jours etait de I'ordre de C3S f 0 % TEA > C3S
+
0.1 'j/, TEA > C3S -k 0.5 % TEA > C3S t 1 . 0 %TEA, peu importe que la chaux ait Cte Cvaluee a u moyen de rayons X, d e l'analyse thermique differentielle, d e I'analyse thermogravimetrique ou d e I'analyse chimique. Le taux d'hydratation, c'est-a-dire d e disparition du 3Ca0.Si02, indique que I'hydratation se produit plus rapidernent en presence du
TEA apres un jour. L'addition d e TEA prolonse la periode d'induction, favorise la formation d'un C-S-H ayant un taux plus eleve de CaO/Si02, augmente la formation de Ca(OH)2 non cristallin et accroit I'aire du produit d e silicate hydrate.
Influence of Triethanolamine on the Hydration
Characteristics of Tricalcium Silicate"
V. S. Ramacha~ldrail
Nntioital Res~~nrclr Corrr~cil of' Cntlcrcln, Divisiotl of Brtilclitrg Resenrclr, Ottnlvcr K I A OR6, Cn12aclu
( Prrper t.rr(~i~~crl I 1 hfcrry 1972, ui~ie~rrlerl paper acccpterl 22 Artgrrsf 1972)
The hydration characteristics of 3CaO.Si0, or $2Ca0.Si02 are studied by an addition of 0.0, 0.1, 0.5 or 1.0% triethanolamine. The amount of Ca(OHJ2 found at 1, 3, 7 or 28 days was in the order C3S+O% TEA > C3S+0.1 0/,
TEA > C3S
+
0.5 % TEA > C,S+
1.0 % TEA, irrespective of whether lime was estimated by X-ray, DTA, TGA or chemical analysis. The rate of hydration, in terms of the disappearance of 3Ca0.Si02, showed that hydration proceeded faster in the presence of TEA after 1 day. Additions of TEA increase the induction period, promote the formation of a C-S-H with higher CaO/SiO, ratio, increase the formation of non-crystalline Ca(OH), and enhance the surface area of the hydrated silicate product.1. Introduction
Certain admixture for~llulations used in concrete practice as water reducing-acclerating agents contain small anlounts of triethanolamine (TEA). The amine reduces excessive retardation effect of the water-reducing admixture. T E A is generally preferred t o CaCI2 in these forn~ulations because in large amounts CaCI, nlay promote corrosion of the embedded metals in concrete. T E A is also used as a grinding aid.'
The action of T E A in the hydration of cement is not understood. It is not yet even resolved whether it is an accelerator o r a retarder.'-3 It is quite possible that the
I amount of admixture and the chemical colnposition of the cement dictate its final
action as retarder or accelerator. A direct study of the influence of T E A on the hydration of cement, although a useful approach from the practical point of view, is not easy t o interpret because the admixture nlay act in a conlplex way to affect the hydration of the individual phases and their hydration products. lnitially it seems essential to gain an understanding of the role of T E A on the hydration of the individual, binary and ternary systems before extending the study to the cement itself. S o far, however, no systematic investigation seems t o have been done o n the kinetics of hydration of the individual phases of portlalld cement using different amounts of TEA. Ciach and Swenson, basing their observations on the transmission electron micrographs of C3S pastes, reported that T E A acts as an a c ~ e l e r a t o r . ~
" Presented at the Annual Meeting of the American Ceramic Society, Washington, May 1972. 1125
Portland cement contains 70 to 80% tricalcium silicate (C3Sy and di-calcium silicate (C2S). In pastes the hydrolysed products of the silicates predominate and influence many properties ofconcrete. As the first part ofthe investigation the hydration characteristics of C3S were therefore studied sequentially for periods ranging from a few hours to a month in the presence of different amounts of TEA.
2. Experimental 2.1. Materials
The tricalcium silicate used in this work contained 99.33% C3S, 0.21 0/, tricalciu~n aluminate and 0.46% free lime. It had a Blaine surface area of 3310 cm2/g. Trietlianol- amine of certified grade was s ~ ~ p p l i e d by Fisher Scientific Co. Some experiments were carried out using PC,S having a Blaine surface area of 2770 cin2/g.
2.2. Methods
Differential thermal analysis (DTA) was carried out in air or in a flow of
N,
using a Du Pont-900 thermal analyser at a heating rate of 20 "C/min. In the thermograins the exothermal effects are shown upwards and endothermal curves downwards wit11 respect to the base line. Surface area was obtained using N1 as the adsorbate by a Numinco-Orr surface area-pore v o l ~ ~ i n e analyser. Free lime in the samples was estimated by the solvent variation method. Thermogravimetric analysis (TGA) was carried out using a sensitive Cahn balance. The rate of heat development during tlie hydration of C3S was determined by means of a conduction calorimeter containing six chambers and supplied by the Institute of Applied Physics, Delft. Although the chambers were coated with Teflon, the hydrated p r o d ~ ~ c t s tended to stick to the surface and polyethylene liners were therefore necessary. Sensitivity of the calorimeter was 20 mV/W. The temperature of the water bath was kept at 25 "C.X-ray diffractograms were obtained by a Hilger and Watts unit using a CuK, source. Each of the samples was mixed with 20% Mg(OH), used as an internal standard. The relative amounts of c a l c i ~ ~ i n hydroxide formed at different times were determined in terms of the ratio of the intensities of peaks at 4.77 and 4.90
A
t o the peak at 2.36A.
Two peaks for Mg(OH), at 4.77 and 2.36A
were used to counteract the interference effects at 4.77 and 4.90A . "
The unhydrated C3S was expressed as a ratio of the intensity of the peak at 2.18A
to that a t 2.36A.
2.3. Preparation of samples
The hydration of C3S or C,S was studied by mixing with double-distilled water a t a water to silicate ratio of 0.5. Hydration was carried out in tightly covered polyethylene containers rotated continuously over rollers. At specified intervals of time, varying from 15 min to 1 month, each sample was ground in cold ethyl alcohol, placed in a desiccator and continuously evacuated for 24 h using liquid air in the trap. Care was taken throughout to prevent containinatio~l with CO,.
"The following nomenclature is adopted: C3S = tricalci~im silicate; C2S = dicalcium silicate;
H = H20; MH = magnesium hydroxide; TEA = triethanolamine; C H = calci~im hydroxide;
Hydration characteristics of tricalcium silicate
A similar method was followed for hydration experiments in the presence of 0.1, 0.5 or 1.0% TEA with respect to the silicate. The solution-silicate (volume/weight) ratio was kept a t 0.5.
3. Results and discussion 3.1. DTA results
Differential therinograms were obtained for C3S and C2S hydrated for periods of 5 min to 28 days and containing 0.0, 0.1, 0.5 o r 1.0% TEA. Only representative thermograms are included in Figures 1, 2 and 3.
0 200 400 600 800 1000
Temperature ( O C I
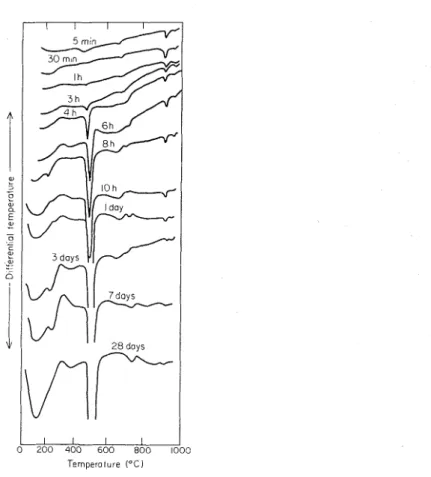
Figure 1. Thermogranis of 3CaO . S O 2 hydrated to different periods. (In this and subsequent tliermograms, exotherms are shown in an upward direction.)
Figure 1 presents the thermal curves of C3S hydrated for 5 and 30 min, for 1, 3, 4, 6, 8 and 10 h, and for 1, 3, 7 and 28 days. A t very early periods there is an almost complete absence of any endothermal effect a t temperatures below 300 "C. It can be discerned a t 8 h, however, and its intensity increases contin~~ously to 28 days. At low temperatures a small endothermic peak also appears in some of the samples at about
1128 V. S. Rarnachandran
260 "C. An endothermal valley is evident between 340 and 380 "C and is more pro- nounced a t 28 days. An unmistakable endotliermal effect appears in all sanlples at about 480 to 500 "C, but it is better defined at 1 11 and later. The rate of increase of
this peak is substantial between 3 and 4 h and continues to grow throughout the period of hydration studied. The peak temperature of this effect shifts slightly towards higher temperatures with the progress of hydration. There are also irregular, poorly defined thermal effects of small magnitude between 640 and 680 "C. In addition, two endothermal effects are registered in all samples at 930 and 980 "C, the former being of higher intensity. Both peaks decrease in intensity as hydration proceeds.
Ternperaiure ( O C )
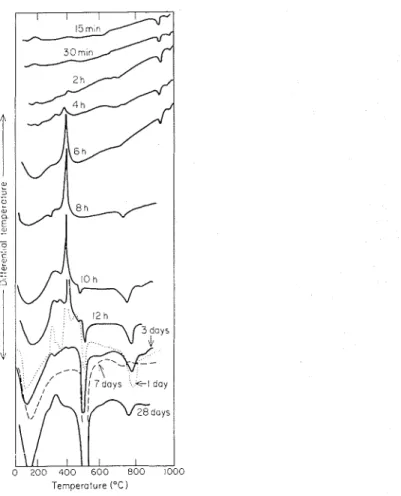
Figure 2. Ther~nogranis of 3CaO .SiOz Iiydrated t o different pcriods in prcsencc of 0.5% TEA.
Figure 2 shows the thermal behaviour of C3S hydrated in the presence of 0.5% TEA. The low-temperature endothermal effect below 300 "C is generally of greater amplitude than the corresponding effect in samples of C3S hydrated without TEA (Figure 1). A distinct characteristic of thermograms of TEA-treated sanlples is the sudden energence of a sharp exothern~al peak after 6 11 at a temperature of about
EIytlratio~~ characteristics of tricalcium silicate
400 "C. It is absent below 6 h. This peak is evident for u p to 1 day of hydration but is not clearly seen a t later periods. A small endothermal effect occurs a t about 475 "C after 10 h and increases in intensity with the progress of hydration. In this series the endothermal effect observed in the range 720 t o 760 "C is generally of higher intensity than that at 640 to 680 "C for C3S hydrated without TEA. Therrnograms of C3S hydrated with 1.0'x TEA are somewhat different from those hydrated with 0.5% TEA. With 1.0% T E A the exothermal effect a t about 400 "C is of higher intensity, whereas the endothermal effect at about 475 "C is lower. The sa~nple containing 0.1 "/, TEA shows an exothermal effect of lesser inagnit~tde than that with 0.5 0/, TEA.
Ternpero'ure ("C)
F i g ~ ~ r c 3. Thcrmograms of 2 C a 0 .SiOz liydratcd alonc (a), and (b), in thc prcsclice of triethanolaminc (obtained in an N2 atmosphere).
The hydration of C2S with 0.5% TEA may be followed by the tllermogranis presented in Figure 3. The endotheriilal peaks a t 450 to 480 "C are generally of larger intensity in the saiilple containing 0 ';/, TEA.
3.2. Hydratioil of C3S, 0
%
TEAThe hydration of C3S may be followed by different methods such as the determination of the amounts of non-evaporable water, calcium hydroxide, residual C3S, and by measurenlents involving electrical conductivity, heat of hydration or strength. The amount of calcium hydroxide liberated a t different times of hydration may be estimated by chemical, DTA, T G A or X-ray techniques. Amounts determined by these techniques seem to differ so that caution should be exercised in the interpretation of results. In conjunction wit11 the coilduction calorinletric technique, however, these techniques serve as useful tools for investigating the influence of different amounts of TEA on the hydration of C3S.
Therinograms o r pure C3S and C3S cured at earlier times indicate three endothermal peaks at 630 to 680 "C, 930 "C and 970 to 980 "C (Figure 1). They inay represent Triclinic I ;=1 Triclinic IT, Triclinic I1 ;L Triclinic 111 and
Triclinic 111
+
Monoclinic transformations in the C3S ample.^ As hydration pro- ceeds, the intensity of these peaks diminishes because of progressive depletion of C3S. The two endothermal effects below 300 "C, which seem to merge in many cases, denote the removal of loosely- as well as firmly-bound water from the C-S-H product. Increase in the intensity of this effect with time is due to the fornlation of larger amounts of C-S-H as hydration progresses.An endothermal valley between 340 and 480 "C, more evident in some samples than in others, may represent the dehydration effect of Ca(OH), present in non- crystalline form. The evolution of H,O from the C-S-H phase is also possible6 in this temperature range.
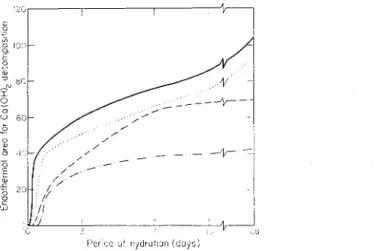
The very small endothermal effect at about 480 "C was evident at I h but more pronounced at 4 h, and may be attributed to the dehydration of Ca(OH),. The intensity of this peak is proportional to the amount of Ca(OH), and may be used to follow the kinetics of hydration of C3S. Figure 4 shows the amounts of Ca(OH)2
Figure 4. Estimation by DTA of Ca(OH)2 at different periods of hydration of 3 C a 0 .SiO, containing triethanolamine: (-) none; (. . . . .), 0.1 %; (- - - -), 0.5%, and (-. .), 1.0%.
formed at different times in terms of the endothermal areas for the Ca(OH), decom- position. A rapid increase in the quantity of Ca(OH), between 3 and 4 h represents an increase of 200
%.
Accordingly, the first 3 h should be termed the dormant period during which only very small amounts of Ca(OH), are produced. The period between 3 and 8 h may be termed the acceleratory period, because it accounts for about 25%
of all the Ca(OH), produced for up to a month. After 8 h Ca(OH), continues to form but at lower rates.The thermal effects discernible between 640 and 800 "C, especially at longer periods of hydration, represent the decarbonation of very small amounts of CaCO, as well as the loss of small amounts of H 2 0 from the C-S-H phase.'
The TGA method was applied in calculating the amount of Ca(OH), by deter- mining the quantity of H 2 0 evolved during the decomposition of Ca(OH), in the
Hydration cliaracteristics of tricalcium silicate
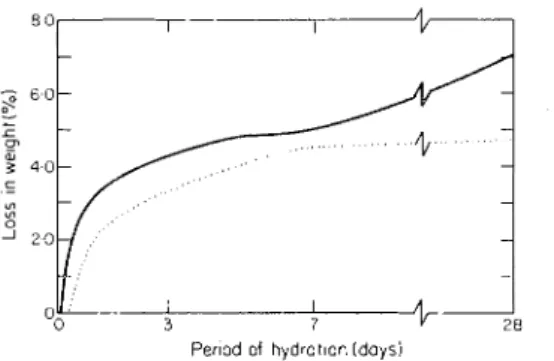
temperature range 450 to 550 "C. Weight loss was calci~lated between the temperature at which the TGA curve showed deviation from linearity and the temperature at which it alnlost levelled off, generally between 450 and 550 "C. The method is not expected to be very accurate because deviations in the curve are not sharp and, in addition, some water is lost by the C-S-H phase in the temperature range 450 to
Figure 5. TGA estimation of Ca(OH), at different periods of hydration of 3Ca0.Si02, (-) no TEA, and (. . . . .) with 0.5% TEA.
Period of hydration (days)
F i g ~ ~ r e 6. Aniou~its of Ca(OH), estiniatcd by S.V.M. method in 3 C a 0 . S i 0 2 pastes (ignited basis) in the presence of (-), no TEA and ( . . . . .), 0.5% TEA.
550 'C. It is usefill, however, for evaluating marked changes in the relative weight losses occurring at different times and in the presence of different ainounts of TEA in the hydrating C3S. I11 general, the relative ainounts of Ca(OH), determined by DTA and TGA for C3S sa~nples hydrated in the absence of TEA are similar (Figures 4, 5). Figure 6 shows the anlouncs of Ca(OH), estimated by chemical analysis. The shape of the curve suggests that the relative amounts of Ca(OH)? determined by DTA, TGA and chemical analysis follow nearly the same trend. The X-ray diffraction method was also used to estimate Ca(OH)? (each sample is mixed with 20% magnesium hydroxide). The ratio of the peak intensity for Ca(OH)2+ Mg(OH), :
relative amo~ults of Ca(OH)I formed at different periods (Figure 7). The curves in Figure 7 show some variance from those of TGA, DTA and chcmical analysis, but the X-ray method estimates only crystallille Ca(OH),.
Period of hydrol~on (days)
Figurc 7. Relative amounts of crystalline Ca(OH)2 formed at different periods of hydration of C,S:
(O), no TEA; (e), with 0.1 % TEA; (A), with 0.5% TEA, and (A), with 1.0% TEA.
Isothermal conduction calorimetry provides information on the rate of heat development in hydrating C3S. In the C3S sample hydrated without TEA, there was little heat development in the first few hours, representing the dormant period. This was also observed in the differential thermograms. The curve starts to rise steeply at about 2;- to 3 h, denoting the beginning of the acceleratory period (Figure 8). Maximum heat development occurs between 7 and 8 h and thereafter there is a decrease in the rate of heat evolution.
F i ~ u r e 8. Conduction calorimetric cLlrves of 3 C a 0 . S i 0 2 with differcnl amounts of added triethanolaminc.
Hydration characteristics of tricalciunl silicate
3.3. Hydration of C3S+TEA
The comparative rates of liydration of C3S witli or without TEA may be evaluated from Figures 1, 2 and 4 to 7. With TEA certain features were observed that have not been reported in the literature.
If, in the hydration of C3S with or witliout TEA, it is assumed that the chemical co!nposition of the C-S-H phase does not change with time, then the amounts of Ca(OH), estimated at different times sliould provide data on the relative rates of hydration of C3S. The amounts of Ca(OH), estimated by DTA, TGA, X-ray and cliemical analysis are shown in Figures 4 to 7. Irrespective of the method adopted to estiiiiate Ca(OH),, the presence of TEA leads to a decrease of Ca(OH), at any stage of hydration. One may conclude that tlie rate of hydration is retarded during the whole course of hydration. There is, in fact, a clear indication that TEA enhances the rate of hydration of C3S at 1 day, 7 days or 28 days (Figure 9). Data indicate that
Figi~rc 9. Thc rclativc amounls of C3S prcscnl at diffcrcnt pcriods of hydration: ( O ) , with no T E A ; (..), with 0.1 % T E A ; (o), with 0.5% T E A and (A), with 1.0%.
bctweeii 1 day and 28 days more C3S rcmains ~~iiliydrated in samples lacking TEA. Conduction calorimetric work also reveals that although there is a long induction period in the presence of TEA, once the acceleratory stage has been reached the sa~nples containing TEA generate large aniounts of heat (Figure 8). The formation of lower quantities of Ca(OH), and an increase in the rate of consuniption of C3S i11 the
presence of TEA can be explained by the formation of a C-S-H product with a CaO/SiO, ratio higher than that normally formed in C3S pastes hydrated without the admixture.
Ther~nograms also suggest the existence of a C-S-H product with a higher CaO/SiO, ratio. Larger endothermic peaks below 300 "C for the TEA-treated C3S are the result of larger amounts of H 2 0 in tlie C-S-H phase. It has been shown that a higher CaO/SiO, based C-S-H has also a higher H,O/SiO, ratio.%arger endothermal effects are observed at 720 to 760 "C in samples containing TEA (Figure 2). This is also typical of the high CIS ratio, hydrated product of C3S. Similar results have been obtained witli C3S hydrated in the presence of 4 to 5
%
CaC1,.9Figure 10 examines the relative amounts of C H formed at different degrees of hydration of C3S with 0 or 0.5'%, TEA. For the same degree of hydration the sample treated with TEA sliows lower values of CH and there is indication that tlie pro- portion of CH formed in the TEA-treated C,S decreases as hydration progresses.
Figure LO. A conlparison of thc amount of Ca(OH)2 with thc anlount of unreacted C3S at different periods of hydration of 3CaO.Si0,: (o), with no TEA; (e), with 0.5% TEA.
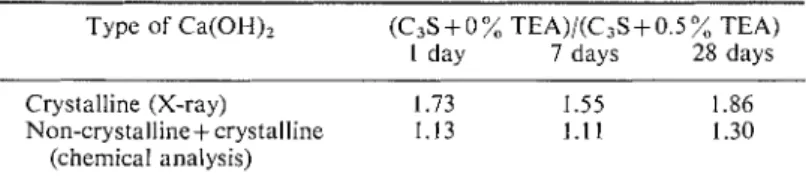
As has already been stated, the amount of C H formed in the preselice of TEA is always less, whatever the method employed or period of hydration. The percentage decrease in CH estimated for [(C3S+0
o i
TEA-C3S +0.5%
TEA)/(C3S+O% TEA) x 1001 differs fro111 one technique to another ( F ~ g u r e 11). The largest difference is shown by the X-ray technique and tlie least by cliemical analysis. Tlie X-ray technique esti~iiates only the crystalline C H ; the cheniical method, the total amount of free CH. TEA seems to discourage the develop~nent of crystallised CH. The relative a~iiountsI I I
I!; 20 25 30
Period of h y d r o l ~ o n ( d o y s i
Figilrc 11. Thc pcrccntagc dincrencc in thc amounts of Cn(OH)2 cstimatcd by different mcthods:
Hydration cl~aractcristics of tricalciun~ silicate
of CH, expressed as a ratio (C3S
+
0 "/,EA)/(C3S+
0.5%
TEA) by chemical analysis, show lower values than those shown by the X-ray technique. There is thus a pro- bability that TEA promotes the formation of non-crystalline CH (Table I). There is some evidence of this effect in the liydrated products of C,S. Figure 3 presents therino- grams of C,S hydrated to different periods with 0 . 5 w E A . The intensity of the endothermal peak for the dehydration of Ca(OH), in the sample hydrated without TEA is illuch larger. The sample containing TEA exhibits two endothermal peaks, probably indicating the amorphous and crystalline forms of Ca(OH)2.TABLE 1. Relative amounts o f crystalline and non-crystalline Ca(OH)2 Type of Ca(OH)? (C3S+ 0 % TEA)/(C3S+ 0.5 % TEA)
I day 7 days 28 days
Crystalline (X-ray) 1.73 1.55 1.86
Non-crystalline+crystalline 1.13 1.11 1.30
(chemical analysis)
The amounts of C H deteriniiied by DTA or TGA coinpare well for the hydration of C3S
+
0%
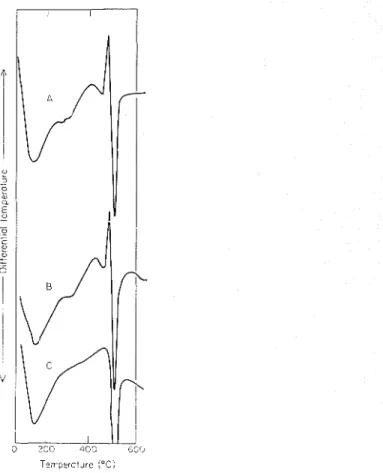
TEA. In the presence of TEA, however, larger variations occur, especially at 1 day of hydration (Figure 11). At earlier periods of hydration the large exotherinal effect occurring in the vicinity of the C H peak in the C3S-TEA-H20 system inay partially mask the endothermal effect of C H hydration. This results in the assigning of lower values for C H peak areas. The inasking effect may be eliminated by carrying out DTA in an N2 atmosphere. 111 adopting this procedure it was observed that a TEA-treated C3S, after 1 day's hydration, gave nearly the same ainount of CH as the TGA method. At 28 days both TGA and DTA gave the same values for CH because the interfering exothermic effect is absent. DTA and TGA methods seeem to estimate both crystalline and arnorplious Ca(OH),, but how quantitative the results are would need a more exhaustive study.Tlie sudden emergence in TEA-treated saillples of a sharp exothermal peak at 6 h absent at earlier times of hydration, must indicate that it is not caused by free TEA (Figure 2). The exotherniic peak was not present when the thermograin was obtained in an atmosphere of N,, showing tliat oxidation causes the peak. Additional evidence suggests tliat the exothermic peak is caused by a complex of TEA formed on the surface of hydrating C3S. A sample of C3S containing 1.0% TEA and hydrated to 3 days was leached with H,O and ethyl alcohol for several hours. TEA is soluble in both H 2 0 and ethyl alcohol, but the alcoliol leachate did not contain any TEA whereas the water leachate showed that more than 80
%
TEA was extracted from the sample. DTA of the sample leached with alcohol retained the exothermic peak but leaching with water resulted in the disappearance of this peak (Figure 12). These results resemble those obtained in the hydration of C3S in the presence of 4 to 5 % CaCI,. The exothermal peak due to the con~plex of chloride on hydrated C3S could be eliminated by extraction with water but not with alcoliol.gThe exothermal effect that emerges at 6 h disappears after 3 days of hydration. Similar beliaviour is shown by CaC1,-treated C3S s a ~ ~ i p l e s . ~ The inasking effect of the endotheriiial valley in the temperature region of the exothermal effect does not
1136 V. S. Ran~acha~idran
seem to be the major cause of its disappearance. It is Inore probable that as hydration proceeds the surface colnplex is desorbed and goes into the surrounding solution. Subsequently, it may be trapped in the interlayer positions of the C-S-H phase. As a consequence, the mechanism of deco~nposition of the TEA conlplex is modified, with loss of the sharp exother~nic peak. A change occurs in the rnechanism of decom- position of an organic material in the interlayer spaces of clay ~ n i n e r a l s . ' ~ . "
Figure 12. Effect of extraction on the exothermal pcak of C,S hydrated with T E A : (A) i~ncxtracted, (B) cxtractcd with alcohol, and (C) extracted with water.
In the hydration of C3S it has been suggested that the C-S-H forming on the surface of C3S has a high CaOISiO, ratio and retards the reaction in the induction period. It is then converted t o a second hydrate with a lower CaO/SiO, ratio and a higher permeability. Once the nuclei of the second hydrate are formed the conversion takes place with a higher velocity by an autocatalytic effect.'q~nitiaIly, a surface conlplex of the a ~ n i n e forms in the presence of TEA. Trietlianola~nine (CH2-CH,. OH),N is an a~ninoalcol~ol and cation active and it is possible that the cations of the hydrating surface of C3S are replaced by the anline-containing cation. The co~nplex thus formed
I-Iydration characteristics of tricalciuni silicatc
is strongly adsorbed and increases the induct~on period. Etllanolamine is known to interact with the silica surface and also forms con~plexes with metal ions.'3-'" The induction period is increased as the anlount of TEA added to C3S is increased. This may be explained by the formation of a thicker layer of the complex with less permeability. As an admixture, TEA should be termed a retarder, especially in the initial stages of hydration when it w o ~ ~ l d be expected to retard setting. This is in contrast with the behaviour of the CaCI, accelerator, which not only decreases the ind~~ction period but also decreases the setting time. The adsorbed complex is s ~ ~ b s e q ~ ~ e n t l y dissolved by H,O and hydration proceeds nor~nally because the freshly formed, high-surface-area C-S-H product strongly adsorbs the TEA and retards its further action on C3S.
The presence of TEA in C3S r e s ~ ~ l t s in changes in the surface area of the hydrated product. At 28 days of hydration the N, surface areas of C3S+O"/;: TEA, C3S+0.1 '%, TEA and C3S+ 1 % T E A are, respectively, 24.8, 30.9 and 44.6 m2/g. The C3S con- taining CaCI, also shows an increased area of hydration products. Under electron nlicroscopic examination the hydrated C3S sainple is reported to exhibit striated plate structure, whereas the sample treated with TEA promoted felted and fibrous plates with many forined in an unoriented s t r ~ c t u r e . ~ The latter type of niicrostructure may enhance the surface area. It may be envisaged that the chemisorption of TEA on freshly forming C-S-H inhibits the orderly growth of plates in tabular form. The formation of Inore non-crystalline Ca(OH), in the products containing TEA may also contribute, to some extent, to the increase in s~irface area.
Additions of triethanolainine (TEA) increase the induction period for the hydration of tricalci~im silicate (C3S), probably owing to the formation of a surface complex of the admixture on the hydrating surface of C3S. Thus, TEA acts as a retarder of hydration at early stages. At hydration periods exceeding a day the hydration of C3S proceeds slightly faster with than without TEA. It promotes the formation of C-S-H product with a higher CaO/SiO, ratio. The hydrated C3S with higher surface area and higher content of non-crystalline Ca(OH)? results when C3S is hydrated with 0.1 to 1.0% TEA. The effect of TEA on the hydration characteristics of F-dicalcium silicate is si~nilar to its effect on C3S, except that the rate of hydration of 9C,S is much slower.
The author wishes to thank G. M. Polomark for experimental assistance. This paper is a contribution from the Division of Building Research, National Research Council of Canada, and is published with thc approval or the Director of the Division.
Refereilces
I . Royak, S. M . ; Klemet'eva, V. S.; Tarnariitskii, G. M. ZII. pr~ilil. Kl1it11. 1970, 43, 82.
2. Report of ACI Committee 212, 'Admixtures in Concrete', J. ,4111. C ~ I I ~ I . . Itlvt. 1954, 26, 113 3. Fletcher, K. E.; Roberts, M . H. Cot~crete 1971, 5 , 142.
1138 V. S. Rarnachandran
5. Regourd, M . B~ill. Soc. f r . Mi~rCr. Crisfnllog~r. 1964, 87, 241. 6. Buckle, E. R.; Taylor, H. F. W. J . appl. Cl~er~?., L O I I ~ . 1959, 9 , 163. 7. Petzold, A , ; Gohlert, 1. Torr~rrrl.-Zfg. Iceram. Rd.\cl~. 1962, 86, 228.
8. B r ~ ~ n a u e r , S.: Kantro, D. L. In Tile Clrernisfr~~ of C e r ~ w r ~ f . Academic Prcss, New York. 1964, p. 287.
9. Ramachandran, V. S. Mafir. Corwfr. 1971, 4 , 3. 10. Carthew, A. R . Soil Sci., 1955, 80, 337.
11. Ramachandran, V. S.; Kacker, K . P. J. appl. Clren~., Lorrrl. 1964, 14, 455. 12. D c Jong, J. G . M Doctola1 Thesis, Technische Hogeschool Eindhoven. 1968. 13. Chuyko, E. A , ; Chuyko, A. A,; Tcrtykh, V. A. Ulu. kl~irn. Zlr. 1971, 37, 35. 14. Duchinskii, Yu. S. R I I S , . J. ir~org. Clrenr. 1968, 13, 974.
15. Artemenko, M . W. Ulcr. Klrim. Zlt. 1963, 29, 571.
This publication is being distributed by the Division of Building Research of the National Research Council of Canada. It should not be reproduced in whole or in part without permission of the original publisher. The Division would be glad to be of assistance in obtaining such permission.
Publications of the Division may be obtained by mailing the appropriate remittance (a Bank, Express, or Post Office Money Order, or a cheque, made payable to the Receiver General of Canada, credit NRC) to the National Research Council of Canada, Ottawa. K I A 0R6. Stamps are not acceptable.
A list of all publications of the Division is available and may be obtained from the Publications Section, Division of Building Research, National Research Council of Canada, Ottawa. KIA OR6.